Abstract
Purpose
“Quantile-dependent expressivity” describes an effect of the genotype that depends upon the level of the phenotype (e.g., whether a subject’s triglycerides are high or low relative to its population distribution). Prior analyses suggest that the effect of a genetic risk score (GRS) on fasting plasma triglyceride levels increases with the percentile of the triglyceride distribution. Postprandial lipemia is well suited for testing quantile-dependent expressivity because it exposes each individual’s genotype to substantial increases in their plasma triglyceride concentrations. Ninety-seven published papers were identified that plotted mean triglyceride response vs. time and genotype, which were converted into quantitative data. Separately, for each published graph, standard least-squares regression analysis was used to compare the genotype differences at time t (dependent variable) to average triglyceride concentrations at time t (independent variable) to assess whether the genetic effect size increased in association with higher triglyceride concentrations and whether the phenomenon could explain purported genetic interactions with sex, diet, disease, BMI, and drugs.
Results
Consistent with the phenomenon, genetic effect sizes increased (P≤0.05) with increasing triglyceride concentrations for polymorphisms associated with ABCA1, ANGPTL4, APOA1, APOA2, APOA4, APOA5, APOB, APOC3, APOE, CETP, FABP2, FATP6, GALNT2, GCKR, HL, IL1b, LEPR, LOX-1, LPL, MC4R, MTTP, NPY, SORT1, SULF2, TNFA, TCF7L2, and TM6SF2. The effect size for these polymorphisms showed a progressively increasing dose-response, with intermediate effect sizes at intermediate triglyceride concentrations. Quantile-dependent expressivity provided an alternative interpretation to their interactions with sex, drugs, disease, diet, and age, which have been traditionally ascribed to gene-environment interactions and genetic predictors of drug efficacy (i.e., personalized medicine).
Conclusion
Quantile-dependent expressivity applies to the majority of genetic variants affecting postprandial triglycerides, which may arise because the impaired functionalities of these variants increase at higher triglyceride concentrations. Purported gene-drug interactions may be the manifestations of quantile-dependent expressivity, rather than genetic predictors of drug efficacy.
Introduction
The majority of a person’s day is spent in the postprandial state, which is characterized by the elevation of triglyceride-rich lipoproteins (TRL) [1]. Zilversmit initially proposed that postprandial lipemia contributes significantly to coronary heart disease [2].
Postprandial lipemia is the consequence of the relative rates of intestinal fat absorption, TRL synthesis and lipolysis, intervascular lipid transfers, and plasma clearance of TRL remnants [1]. Following a fatty meal, long-chain fatty acids are absorbed by the intestines and esterified to form triglycerides that are then incorporated into chylomicrons for release into the circulation. The triglycerides are subsequently removed from circulation by lipoprotein lipase (LPL) which is a rate-limiting hydrolytic enzyme located on the vascular endothelium. This requires apolipoprotein (apo) CII, a cofactor for LPL that is carried on the chylomicrons after being received from high-density lipoproteins (HDL). The chylomicrons are called remnant particles when approximately 90% of their original triglyceride content has been hydrolyzed. During this process there is a loss of apo CIII (an inhibitor of TRL catabolism and clearance) and gain of apo E (a ligand for the receptor-mediated hepatic uptake of the remnants). Hepatic lipase hydrolyzes some of the remaining triglycerides, which helps facilitate hepatic receptor uptake of the remnant particles by exposing their apo E. LPL bound to the chylomicron remnants also assists with their receptor uptake.
Quantile-dependent expressivity describes an effect of the genotype on the phenotype that depends upon the level of the phenotype [3]. Using quantile regression, the relationship of plasma triglyceride levels to its genetic risk score (GRS) has been shown to increase with the percentile of the triglyceride distribution, i.e., the effect of the GRS depends upon whether an individual has high or low triglycerides relative to the others in the population [3]. Postprandial lipemia is particularly well suited for testing quantile-dependent expressivity because it represents the exposure of each individual’s genotype to substantial increases of their plasma triglyceride concentrations. Specifically, quantile-dependent expressivity hypothesizes that the triglyceride difference between genotypes (dependent variable in a simple linear regression analyses) will increase with the average triglyceride concentrations (independent variable) over the time course of the postprandial response. This means there will be a larger genetic effect size at hypertriglyceridemic (i.e., postprandial state) than at normotriglyceridemic concentrations (fasting state).
To test this hypothesis, quantitative data were extracted from the postprandial response graphs from 97 published papers out of 128 identified as potentially relevant through Pubmed search of genetics and postprandial triglycerides or oral fat tolerance test and literature cited within each paper (S1 Table) [4–131]. Included among these were several articles that were identified in preparation for another paper on gene-environment interactions of fasting triglyceride and their cited references. Studies were only considered if they presented graphs of the postprandial response by genotypes, provided information from which total and genotype-specific triglyceride levels could be calculated for at least four time point, and whose subjects were not selected for their pathological lipemic response. For each published response graph, plots were created for the genetic effect at each time point “t” vs. the average triglyceride concentrations at time t. Their analyses show that the majority of genetic variants affecting the postprandial triglyceride response have effect sizes that change depending upon the average triglyceride concentration at the time of measurement. Quantile-dependent expressivity provides an alternative explanation for: 1) purported genetic interactions of postprandial triglycerides with sex, diet, and disease, and 2) purported genetic markers of fenofibrate efficacy (i.e., personalized medicine).
Results
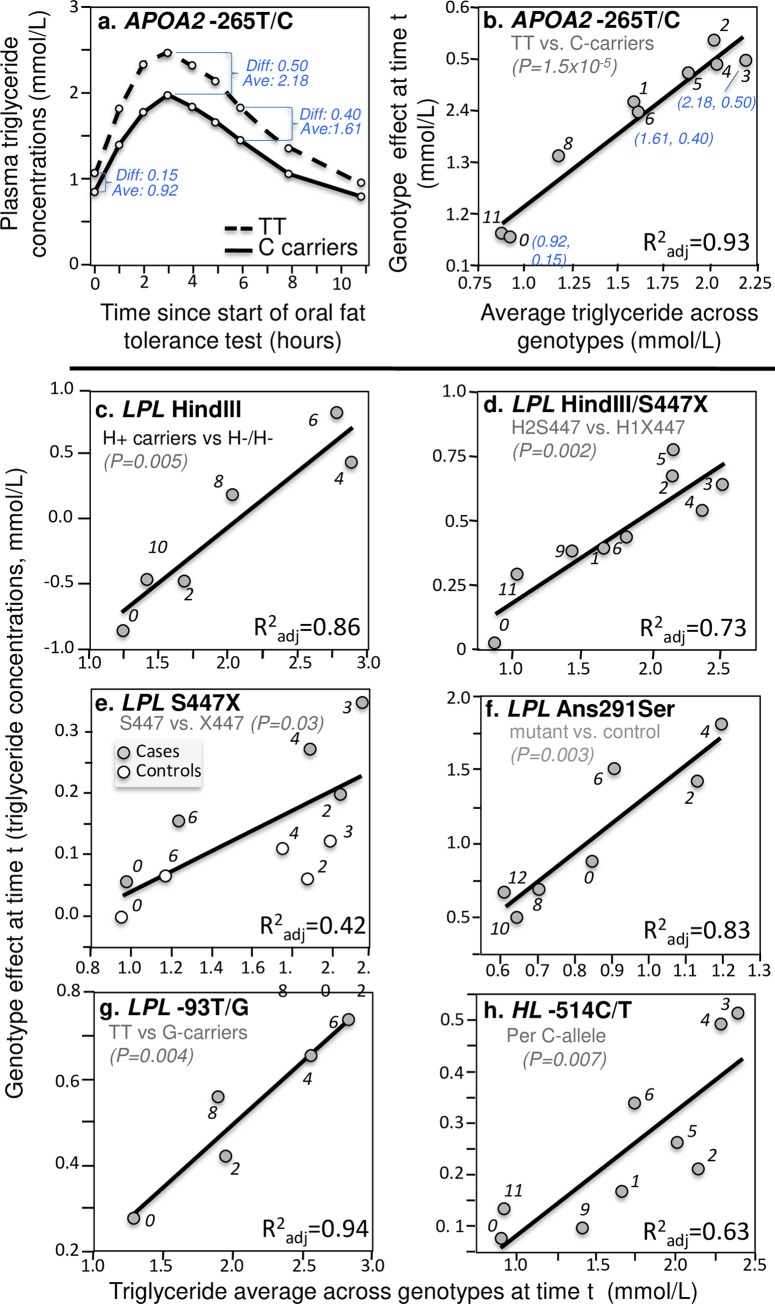
The primary analyses are graphical as illustrated in Fig 1A and 1B. Fig 1A (upper left panel) is a re-rendering of Delgado-Lista et al.’s graph [25] of the triglyceride response following an oral fat tolerance test by APOA2 -265T/C genotypes (rs5082). For each genotype, average triglyceride concentrations are presented for the fasting state at time 0, and the postprandial states at 1, 2, …, 6, 8.5 and 11 hours thereafter. The average triglyceride concentration across genotypes, and average triglyceride difference between genotypes, were determined for each time point (e.g., 0.92 and 0.15 mmol/L at time zero, respectively, 2.18 and 0.50 mmol/L at 3 hours, and 1.61 and 0.40 mmol/L at 6 hours) and used to create the quantile-dependent expressivity graph of Fig 1B. Specifically, Fig 1B plots the triglyceride differences between genotypes (the Y or dependent variable) vs. the average triglyceride value (the X or independent variable) at each time t to assess the genetic effect size as a function of triglyceride concentrations. The nine points (identified by time) exhibit a strong linear relationship as demonstrated by their proximity to their least-squares regression line, corresponding adjusted R-square of 0.93, and the statistical significance of the slope (P = 1.5x10⁻⁵). Therefore, consistent with the hypothesis of its quantile-dependent expressivity, the APOA2 -265T/C effect size increased with increasing plasma triglyceride concentrations.
Fig 1. Quantile-dependent expressivity plots for postprandial triglyceride responses by APOA2, HL, and LPL polymorphisms.
Panels (a) and (b) illustrate the methodology: (a) the re-rendering of the published triglyceride response to an oral fat tolerance test by APOA2 -265T/C genotypes (rs5082) [25], from which is produced: (b) its quantile-dependent expressivity plot showing the linear relationship between the genotype differences (dependent variable) vs. the average triglyceride values (independent variable) at each time point “t” and its significance level. The lower panels present quantile-dependent expressivity plots derived from figures by: (c) Reiber et al. for 27 H+/+ and H+/- vs. 5 H-/- patients for the LPL intron 8 HindIII polymorphism (rs320) [103]; (d) López-Miranda et al. for 26 H2S447 vs. 15 H1X447 haplotypes (rs328) [68]; (e) Humphries et al. for 70.4% H+S447 and 19.2% H-S447 vs. 10.4% H-X447 male haplotypes (rs328) [49]; (f) Pimstone et al. for three Asn291Ser mutations of the LPL gene vs. five controls (rs268) [99]; (g) Talmud et al. for 70 TT homozygotes vs. 25 G-allele carriers of the -93T/G polymorphism in the LPL promoter region (rs1800590) [117]; and (h) Gómez et al. for 26 CC, 22 CT, and 3 TT of the -514C/T polymorphism in the promoter region of the hepatic lipase (HL) gene (rs1800588) [40]. The numerical labels refer to time (“0” is fasting).
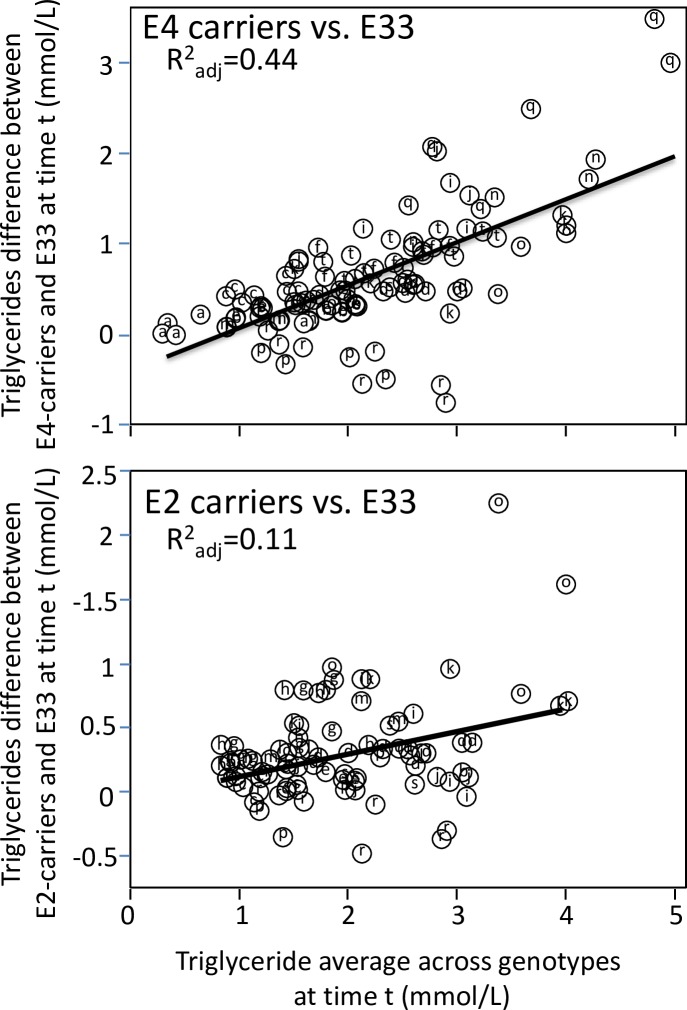
Apo E isoforms are the most-reported genetic modifier of postprandial triglyceride concentrations, with heightened responses reported for both E2-carriers [22, 51,104] and E4-carriers [7,11,18,22,23,60,104]. Apo E is thought to be a cofactor of VLDL catabolism, and reverse cholesterol transport, and is located on the surface of remnant particles where it is recognized by remnant receptors [18]. Fig 2 shows the differences between E4-carriers and E33 homozygotes (dependent variable) increased an average of 0.48 mmol/L for each one mmol/L increment in average triglyceride levels (0.39 mmol/L slope when weighted by study sample sizes) and differences between E2-carriers and E33 homozygotes increased an average of 0.12 mmol/L for each one mmol/L increment in average triglyceride levels (the same as when weighted by study sample size).
Fig 2. Quantile-dependent expressivity plots for postprandial triglyceride responses by APOE genotypes.
Quantile-dependent expressivity showing increasing genetic effect of apo E4- and E2-carriers vs. E33 homozygotes with increasing average triglyceride levels. Data estimated from the published excursion plots from 10,876 measurements in E33, 4682 measurements in E4-carriers, and 2311 measurements in E2-carriers. Point source coded as follows: a) Bergeron et al. [7], b) Boerwinkle et al. [9], c) Brown et al. [11], d) Carvalho-Wells et al. [18], e) Dallongeville et al. [22], f) Dart et al. [23], g) Erkkila et al. at 8 weeks [30], h) Erkkilä et al. at baseline [30], i) Ferreira et al. for intensive training [32], j) Ferreira et al. for moderate training [32], k) Ferreira et al. for sedentary activity [32], l) Irvin et al. post-treatment [51], m) Irvin et al. pre-treatment [51], n) Kobayashi et al. [60], o) Nikkilä et al. cases [85], p) Nikkilä et al. controls [85], q) Reiber et al. [103], r) Reznik et al. [104], s) Vansant et al. [122], and t) Wolever et al. [129].
The LPL enzyme plays a central role in TRL catabolism by hydrolyzing triglyceride, and it participates in hepatic TRL clearance via the LDL receptor-related protein. The 447X variant of the Serine447-Stop S447X (rs328) polymorphism has a 2 amino acid truncation on LPL’s carboxyl-terminal domain, which enhances binding of cell surface receptors to TRL. The S447X polymorphism is in complete linkage disequilibrium with the HindIII polymorphism (rs320) [49,68]. Fig 1C–1G display the quantile dependence expressivity of these and other lipoprotein lipase genetic variants on postprandial triglyceride concentrations. Fig 1G shows that quantile-dependent expressivity also affected the postprandial triglyceride levels associated with the -93G allele of LPL promoter (rs1800590) [117]. Quantile-dependent expressivity is evident for the -514C/T polymorphism in the promoter region of the hepatic lipase (HL) gene (rs1800588, Fig 1H) [40].
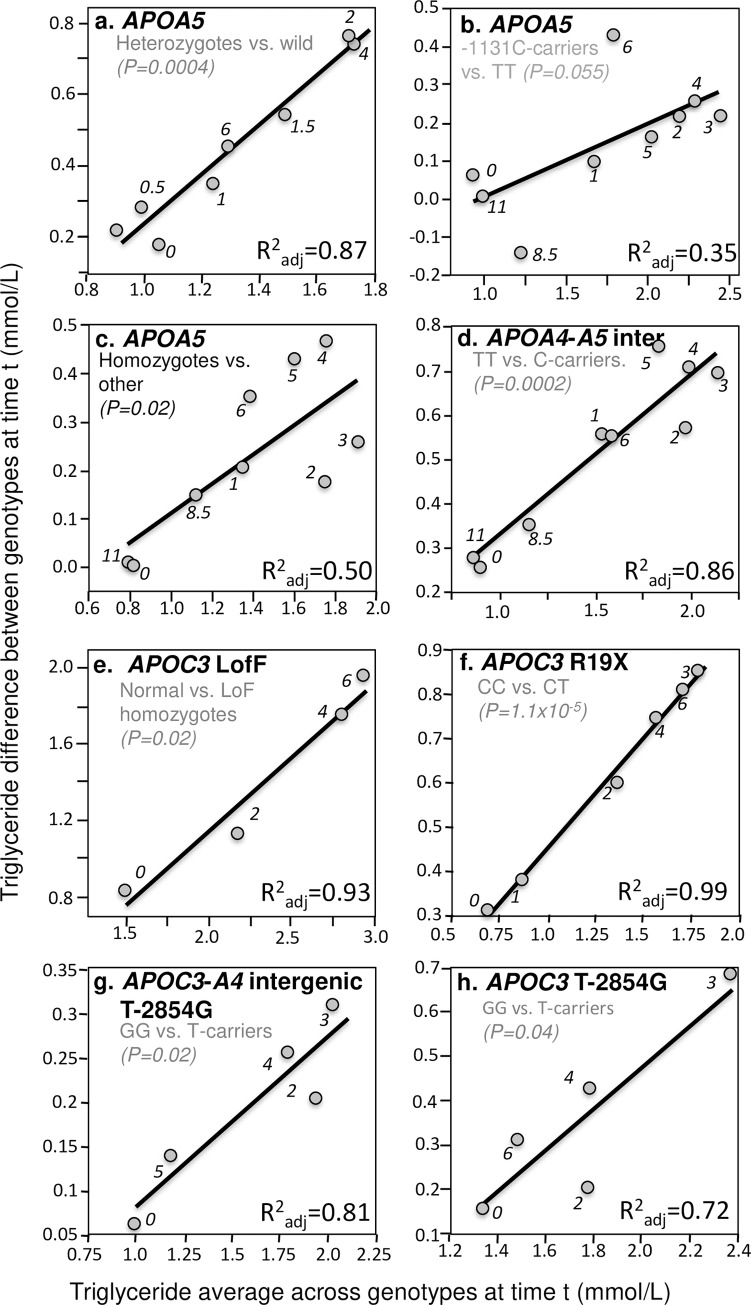
The APOA5 gene is the strongest genetic determinant of plasma triglyceride concentrations [132]. It is thought to participate in hepatic synthesis and secretion of TRL, stimulate LPL activity, and facilitate receptor-mediated clearance of TRL [133]. Located in the promoter region of APOA5 gene, -1131T>C (rs662799) might lower apo AV levels by down-regulating APOA5 mRNA translation [134]. Jang et al. [56], Moreno et al. [79], Martin et al. [71], Cardona et al. [16], and Zemánková et al. [131] all report significantly greater postprandial triglyceride increases in carriers of the C allele than in TT homozygote. Fig 3A–3C illustrate quantile-dependent expressivity for APOA5 genetic variants. In addition, Cardona et al. reported that C-carriers had triglyceride concentrations that were 55% higher at baseline, 61% higher after 3 hours postprandial, and 68% higher after 4 hours postprandial than in TT homozygotes [16] (their results are examined in the Discussion Section in the context of drug treatment). Fig 3D shows the rs1263177 polymorphism in the intergenic region between APOA4 and APOA5, which is thought to be a nonfunctional variant, also exhibits quantile-dependent expressivity [27].
Fig 3. Quantile-dependent expressivity plots for postprandial triglyceride responses by APOA4, APOA5, and APOC3 polymorphisms.
Derived from the postprandial response figures published by: (a) Zemánková et al. for ten heterozygotes (seven -1131T->C and three 56C>G heterozygotes, rs662799 and rs3135506, respectively) vs. 20 wild type carriers of the APOA5 gene [131]; (b) Moreno et al. for 12 C-allele carriers vs. 39 TT patients for the -1131T>C polymorphism of the APOA5 promoter region (rs662799) [79]; (c) Moreno-Luna et al. for 65 patients with the haplotype defined by homozygous for the major alleles of -1131T>C (rs662799), c.-3A>G (rs651821), c56C>G (rs3135506), IVS3+476G>A (rs2072560) and c.1259T>C (rs2266788) vs. 21 others [80]; (d) Delgado-Lista et al. for 30 TT, 42 TC and 16 CC genotypes from the intergenic region between APOA4 and APOA5 (rs1263177) [27]; (e) Saleheen et al. for seven normal vs. six APOC3 loss of function homozygotes (rs76353203) [108]; (f) Pollin et al. for 763 CC vs. 39 CT for the R19X mutation of the APOC3 gene (rs76353203) [100]; (g) Waterworth et al. for 284 TT, 348 TG, and 85GG patients for the T-2854G polymorphism (rs1263177) within the APOC3-APOA4 intergenic region [126]; and (h) Woo et al. for 18 GG vs. 42 T-carriers for this polymorphism within the APOC3-APOA4 intergenic region [130].
Apo C-III is a component of TRLs that inhibits apoE-mediated remnant clearance [19]. Multiple APOC3 genetic variants exhibit quantile-dependent expressivity. These include the Saleheen et al. report of lower fasting and postprandial triglycerides in loss of function (LofF) APOC3 p.Arg19Ter homozygotes (rs76353203, Fig 3E) [108], the Pollin et al. report of heterozygous carriers of a null mutation (R19X) in the APOC3 gene that express half the apoC-III of non-carriers (rs76353203, Fig 3F) [100], and the Waterworth et al. [126] (Fig 3G) and Woo et al. [130] (Fig 3H) reports of the T-2854G site that lies in the APOC3-APOA4 intergenic region within an APOC3 and APOA4 enhancer element.
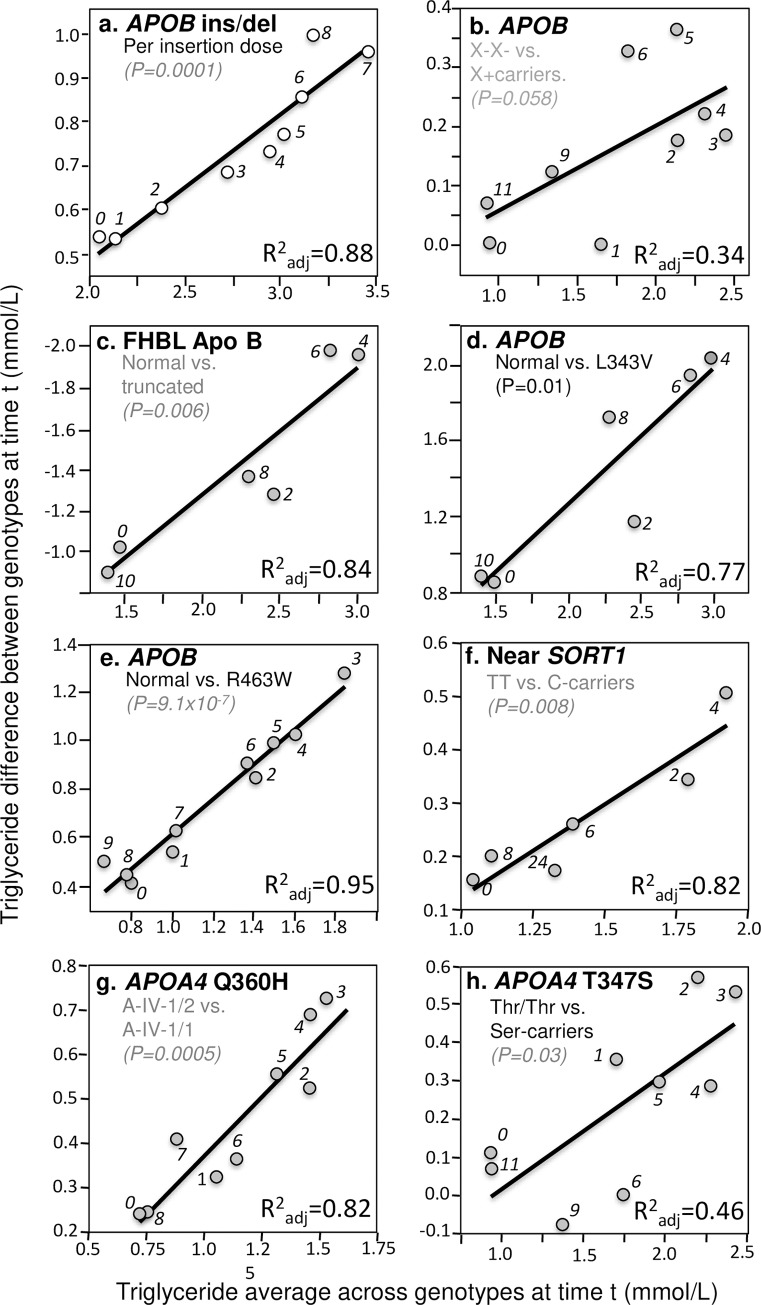
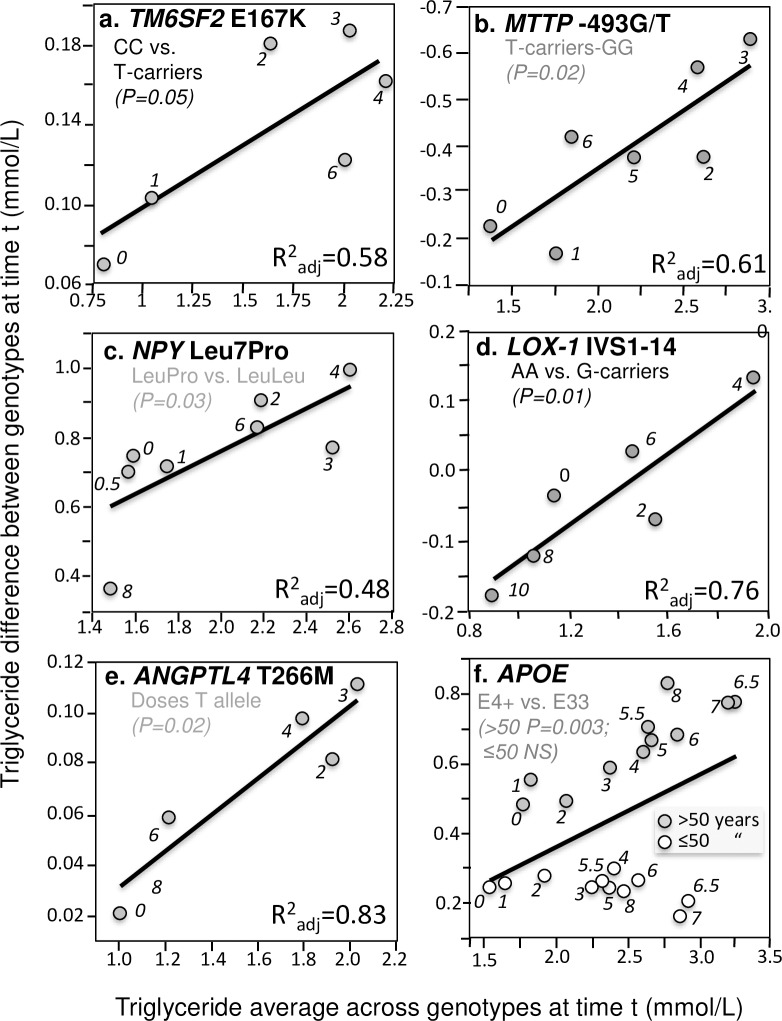
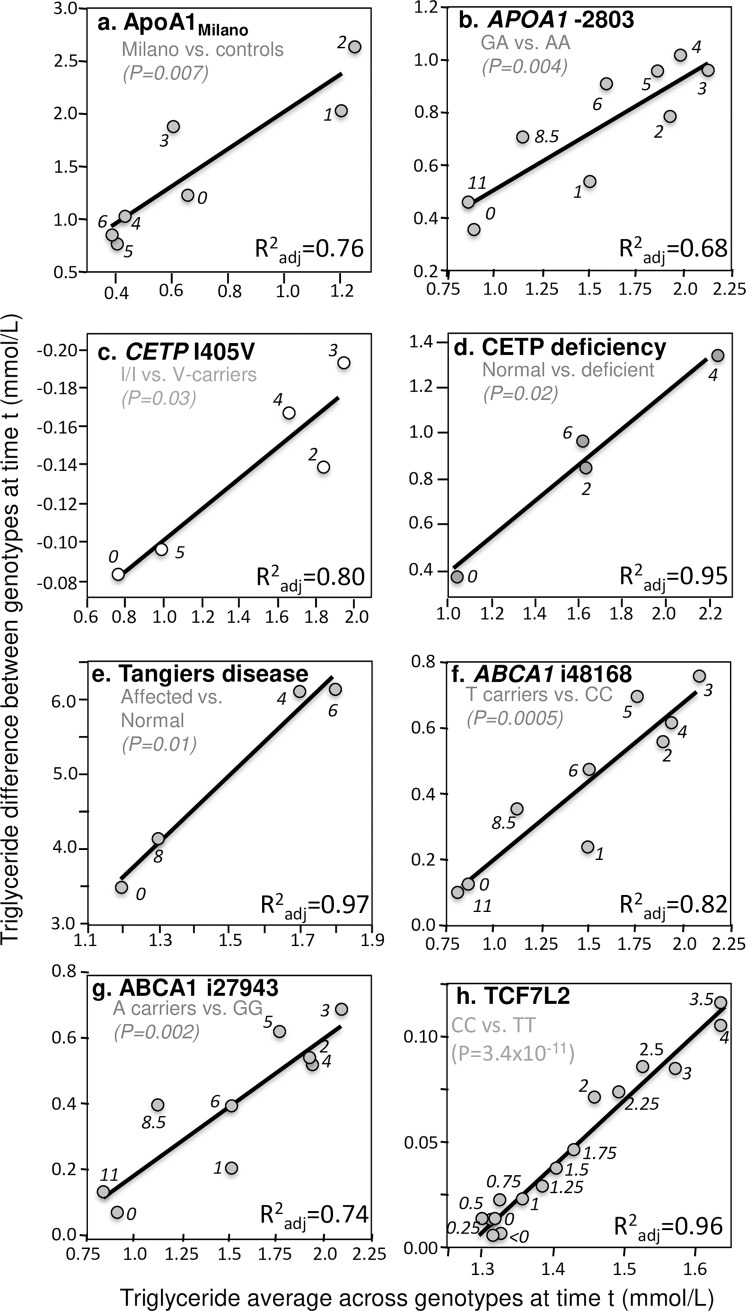
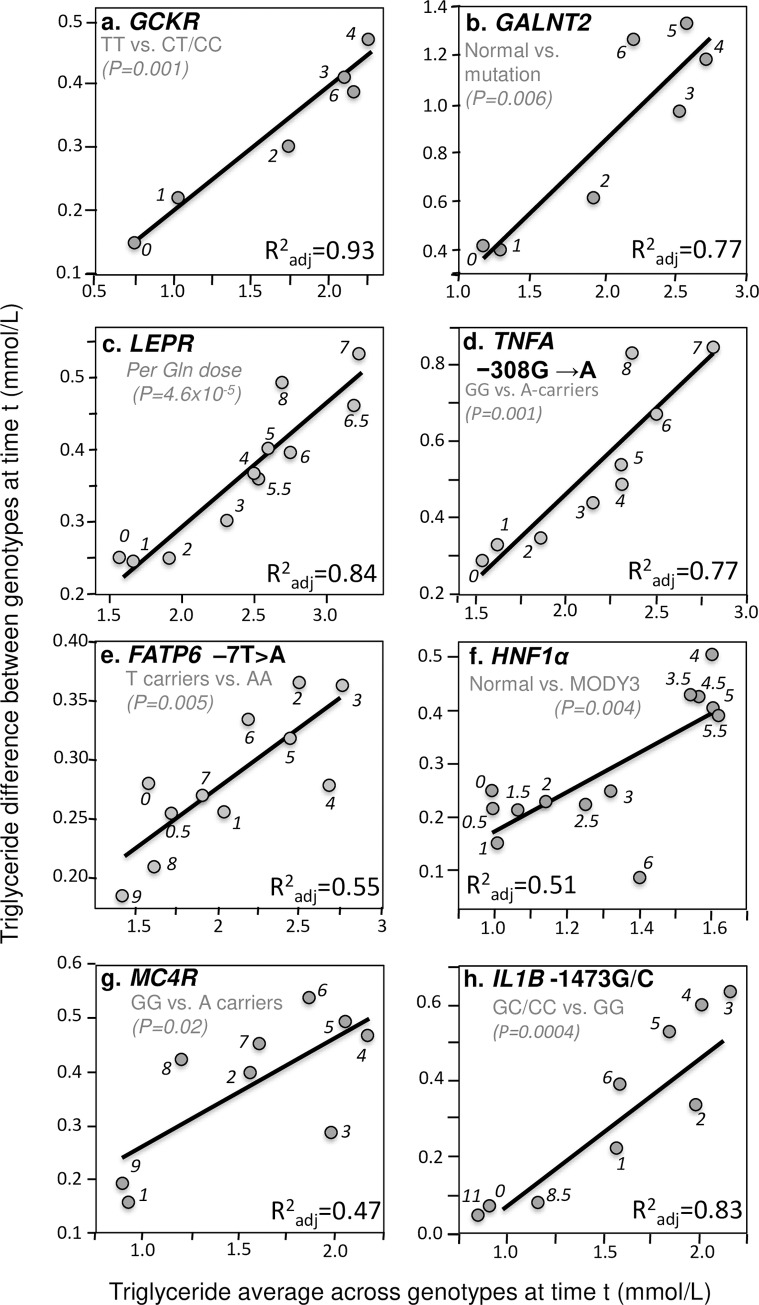
In addition to these four important examples, significant quantile-dependent expressivity is suggested across a broad spectrum of other genetic variants affecting postprandial lipemia. Those achieving P≤0.05 significance are presented in Figs 4–7. Included among these are variants affecting secretion, lipolysis, and clearance, including APOB insertion/deletion (rs172404441, Fig 4A and 4B), familial hypobetalipoproteinemia cases with truncated apoB (Fig 4C), APOB L343V mutation (Fig 4D), APOB R463W substitution (Fig 4E), SORT1 (Fig 4F), APOA4 Q360H substitution (Fig 4G) and 347 Ser mutation (Fig 4H), Apo A-1Milano (Fig 5A), APOA1–2803 polymorphism (Fig 5B), cholesterol ester transfer protein (CETP) isoleucine 405 to valine substitution (I405 → V) in exon 14 (Fig 5C), CETP deficiency (Fig 5D), Tangier disease (Fig 5E), ABCA1 i48168 (rs4149272, Fig 5F) and i27943 genetic variants (rs2575875, Fig 5G), the rs7903146C/T polymorphism in Transcription factor 7–like 2 (TCF7L2, Fig 5H), rs1260326/P446L polymorphism of the glucokinase regulatory protein gene (GCKR, Fig 6A), the D314A mutation of the GALNT2 gene which codes the UDP-N-Acetyl-D-galactosamine:polypeptide N-Acetylgalactosaminyl-transferase 2 enzyme (Fig 6B), the common leptin receptor (LEPR) Gln223Arg polymorphism (rs1137101, Fig 6C), the rs1800629 (-308G>A) polymorphism in the promoter region of tumor necrosis factor-alpha gene (TNFA, Fig 6D), the fatty acid transport protein 6 (FATP6)–7T>A polymorphism (rs2526246, Fig 6E), Mature Onset Diabetes of the Young type 3 (Fig 6F), the rs12970134 polymorphism near the melanocortin-4 receptor gene (MC4R, Fig 6G), the -1473G/C polymorphism of the interleukin 1 beta gene (IL1b, rs1143623, Fig 6H), the transmembrane 6 superfamily member 2 (TM6SF2) loss-of-function variant (rs58542926, Fig 7A), the -493G>T polymorphism in the promoter region of the microsomal triglyceride transfer protein (MTTP, rs1800591, Fig 7B), the Leu7Pro polymorphism of the neuropeptide Y (NPY) gene (Fig 7C); the lectin-like oxidized LDL receptor-1 (LOX-1) IVS4-14 A/G polymorphism (Fig 7D), and the angiopoietin-like protein 4 (ANGPTL4) T266M SNP (rs1044250, Fig 7E). Other example of quantile dependence are examined in the Discussion Section in relation to sex, age, disease, treatment and diet: APOE (Figs 7F, 9 and 13), APOA5 (Figs 8 and 10), FABP2 codon 54 (Fig 11), SULF2 rs2281279 polymorphism (Fig 11), and TCF7L2, TM6SF2, and MTTP (Fig 12).
Fig 4. Quantile-dependent expressivity plots for postprandial triglyceride responses by APOA4, APOB, and SORT1 polymorphisms.
Derived from the postprandial response figures published by: (a) Vimaleswaran et al. for 52 del/del, 70 del/ins, and 25 ins/ins patients for the APOB insertion/deletion (ins/del) polymorphism (rs17240441) [124]; (b) Lopez-Miranda et al. for 31 carriers of the X+ allele vs. 20 X- homozygotes for the XbaI restriction site adjacent to APOB (rs693) [67]; (c) Hooper et al. for 10 normolipidemic controls vs. six heterozygous (three apoB-6.9, one apoB-25.8, and two apoB-40.3) familial hypobetalipoproteinemia (FHBL) patients [47]; (d) Hooper et al. for 10 healthy controls v. three heterogeneous APOB L343V mutations for FHBL [48]; (e) Noto et al. for six healthy controls vs. four heterogeneous APOB R463W mutations [86]; (f) Connors et al. for 15 TT homozygotes vs. 15 C-allele carriers for rs646776 variant of the 1p13 locus (near SORT1) [20]; (g) Hockey et al. for 14 A-IV-2 heterozygous vs. 14 A-IV-1 homozygous and for the APOA4 Q360H polymorphism (rs5110) [45]; and (h) Ostos et al. for 36 Thr/Thr homozygote vs. 14 Ser-allele carriers for the APOA4 347Ser polymorphism [91].
Fig 7. Quantile-dependent expressivity plots for postprandial triglycerides by ANGPTL4, APOE, LOX-1, MTTP, NPY, and TM6SF2 polymorphisms.
Derived from the postprandial response figures published by: (a) O’Hare et al. for 853 CC homozygotes vs.130 T-carriers for the TM6SF2 loss-of-function variant (rs58542926) [87]; (b) Lundahl et al. for 24 GG homozygote vs. 36 carriers of the T-allele of the -493G/T polymorphism of the microsomal triglyceride transfer protein (MTTP, rs1800591) (P = 0.02) [69]; (c) Schwab et al. for 7 LeuPro heterozygotes vs. 7 LeuLeu homozygotes for the Leu7Pro polymorphism of the neuropeptide Y (NPY, rs16139) gene [109]; (d) Musso et al. for 26 AA homozygotes vs. 54 G-carriers of the lectin-like oxidized LDL receptor-1 (LOX-1) IVS4-14 A/G polymorphism in the pooled sample of NASH and healthy control patients [82]; (e) Talmud et al. for 1355 TT, 1108 TM, and 262 MM genotypes of ANGPTL4 T266M (rs1044250) [118]; (f) Carvalho-Wells et al. for 143 E33 and 64 E4 carriers verifying their different postprandial response by age when matched for average triglyceride concentrations [18].
Fig 5. Quantile-dependent expressivity plots for postprandial triglyceride responses by ABCA1, APOA1, CETP, and TCF7L2 polymorphisms.
Derived from the postprandial response figures published by: (a) Calabresi et al. for 6 heterozygous apo A-IMilano vs. 6 matched controls [13]; (b) Delgado-Lista et al. for 32 GA vs. 9 AA genotypes for the -2803G/A polymorphisn in the APOA1 promoter region (rs2727784) [27]; (c) Gudnason et al. for 60 I/I, 55 I/V, and 27 V/V men for the I405V CETP polymorphism in men homozygous for the TaqIB B2 allele (rs5882) [42]; (d) Inazu et al. for 10 normal vs. 4 CETP deficient patients (mutations of intron 14(+1) G-to-A (14A) and D442G) [50]; (e) Kolovou et al. for five Tangier disease patients (3 homozygotes, 2 heterozygotes) vs. 25 normal male controls [61]; (f) Delgado-Lista et al. for 65 T-carriers vs. 23 CC homozygotes for the i48168 variant of the ABCA1 gene (rs4149272) [26]; (g) Delgado-Lista et al. for 67 A-allele carriers vs. 15 GG homozygotes vs. for the i27943 variant (rs2575875) of the ABCA1 gene [26]; and (h) Engelbrechtsen et al. for 31 CC vs. 31 TT homozygotes of the TCF7L2 polymorphism (rs7903146) [29].
Fig 6. Quantile-dependent expressivity plots for postprandial triglycerides by GALNT2, GCKR, lL1B, LEPR, MC4R and TNFA polymorphisms.
Derived from the postprandial response figures published by: (a) Shen et al. in 80 TT homozygotes vs. 690 carriers of the C allele of the P446L polymorphism in the GCKR gene (rs1260326) [112]; (b) Holleboom et al. for 4 normal and 4 patients with c.941A>C, p.D314A mutations in the GALNT2 gene [46]; (c) Jackson et al. for 71 patients with zero, 122 with one, and 38 patients with two doses of the Gln allele for the Gln223Arg polymorphism (rs1137101) in the common leptin receptor (LEPR) gene [52]; (d) Jackson et al. for 64 carriers of the A allele vs. 162 GG homozygotes for the TNFA −308 G/A polymorphism (rs1800629) [54]; (e) Auinger et al. 583 T carriers vs. 102 AA homozygotes for the FATP6 –7T>A polymorphism (rs2526246) [6]; (f) St-Jean et al. for 9 normal vs. 5 genotypically confirmed Mature Onset Diabetes of the Young type 3 (MODY3) patients (two C.872insC and three P.arg159trp patients) [115]; (g) Perez-Martinez et al. for 53 GG homozygotes vs. 35 A-carriers for rs12970134 polymorphism near the MC4R gene [97], and (h) Delgado-Lista et al. for 43 carriers of the C allele vs. 45 GG homozygotes of the -1473G/C polymorphism (rs1143623) in the lL1B promoter region [28].
Fig 9. Quantile-dependent expressivity plots for pre- and post-fenofibrate treated postprandial triglyceride responses by APOE genotypes.
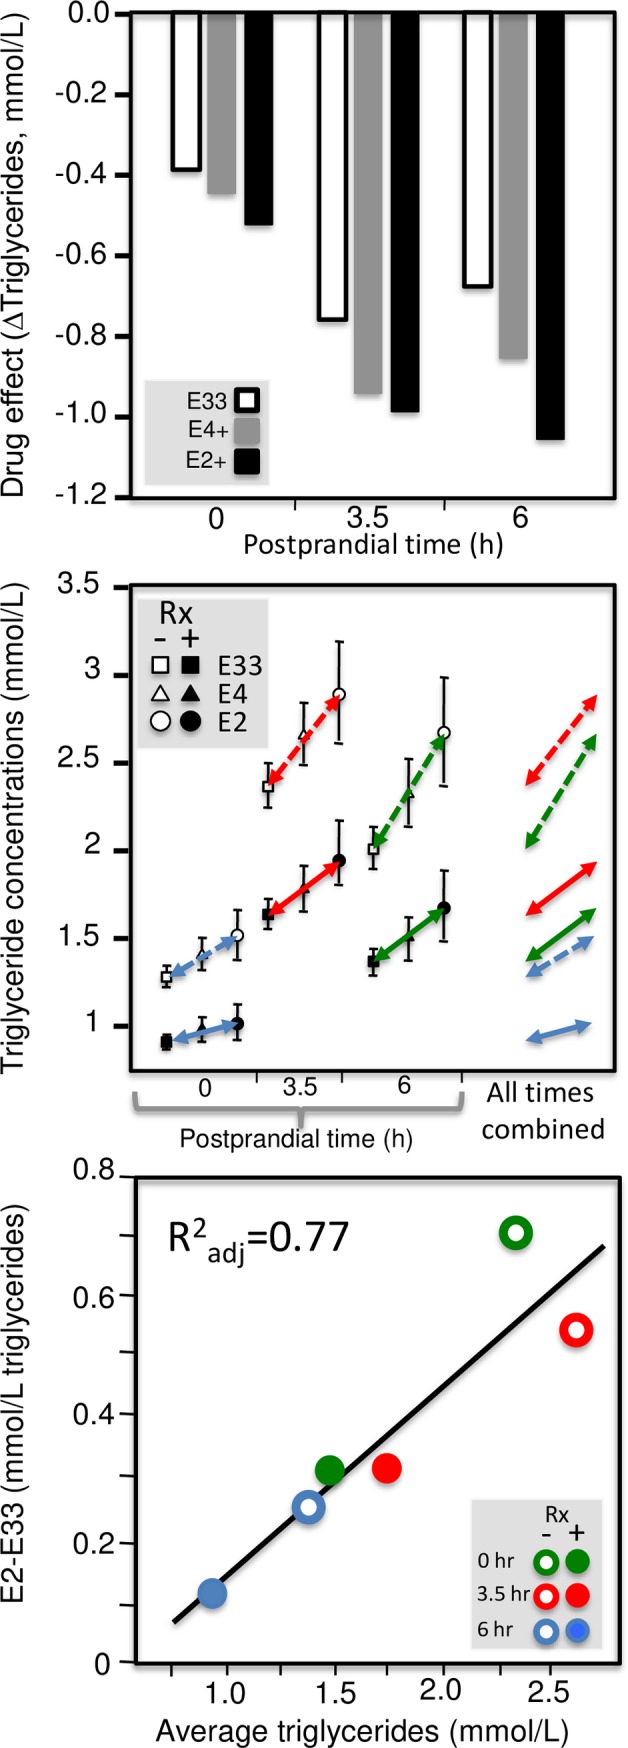
Using data presented by Irvin et al. [51]: pre vs. post fenofibrate treated triglyceride concentrations by genotype (upper panel); genotype-specific mean triglyceride concentrations by treatment and genotype by time since meal (middle panel); quantile-dependent expressivity plot of the E2-E33 effect size vs. average triglyceride concentrations (bottom panel), suggesting the effect size is largely attributable to its relationship to mean triglyceride concentrations.
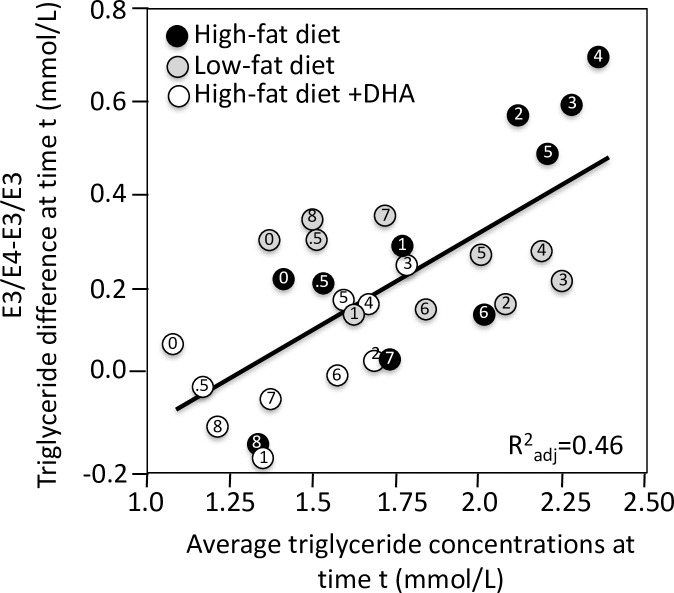
Fig 13. Quantile-dependent expressivity plots for postprandial triglyceride responses by APOE polymorphisms and diet.
Derived from the postprandial response figures published by Jackson et al. for differences between 11 APOE E34 vs. 12 E33 men on low-fat diet; high saturated-fat diet; and high saturated-fat diet with fish oil [53].
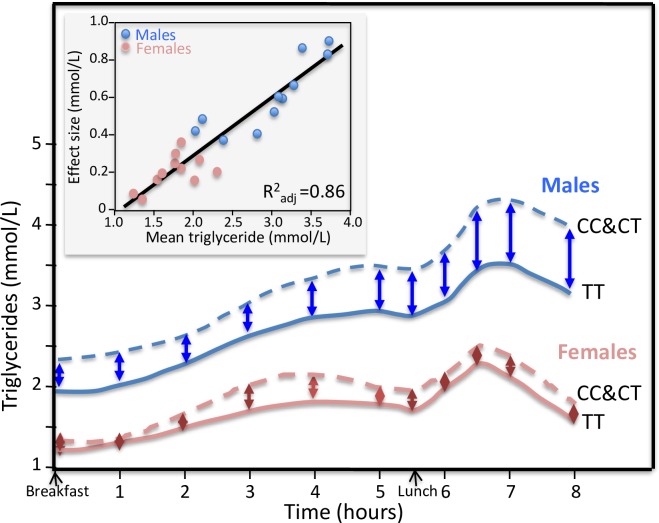
Fig 8. Sex-specific postprandial triglyceride responses in C-carrier vs. TT homozygotes of the APOA5–1131 T>C polymorphism.
Re-rendering of the sex-specific postprandial triglyceride response published by Olano-Martin et al. [88]. The insert presents the quantile-dependent expressivity plot showing that males and females represent largely nonoverlapping triglyceride concentrations over which higher mean triglyceride concentrations predict increasing larger effect size between the C-carriers and TT homozygotes (P = 3.9x10⁻¹⁰).
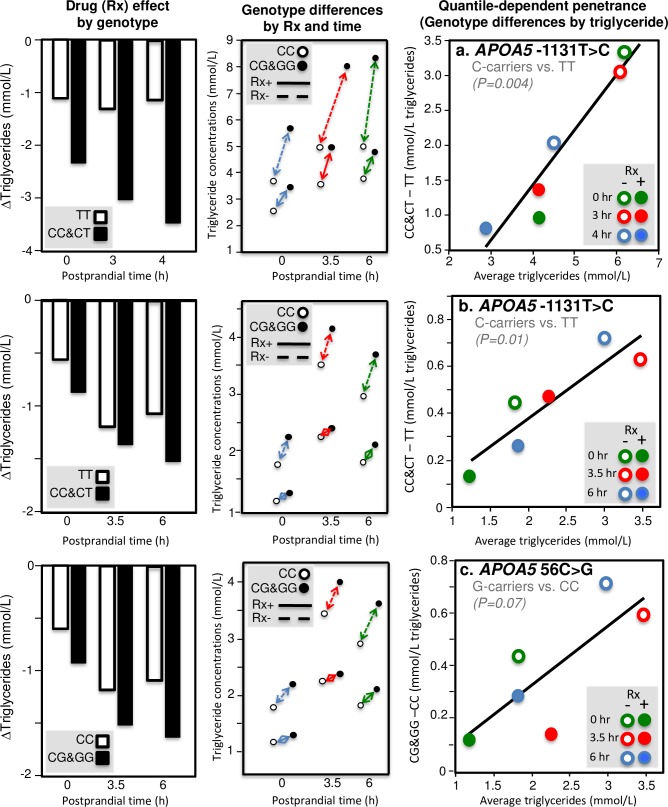
Fig 10. Quantile-dependent expressivity plots for pre- and post-fenofibrate treated postprandial triglyceride responses by APOA5 genotypes.
Derived from data presented by Cardona et al. for the -1131T>C of the APOA5 gene (top row) [16] and Lai et al. for the -1131T>C (middle row) and 56C>G polymorphisms (bottom row) of the APOA5 gene [63]. Left column presents pre vs. post fenofibrate treated triglyceride concentrations by genotype; center column present genotype-specific mean triglyceride concentrations by treatment and genotype by time since meal, and right column present quantile-dependent expressivity plot of the genetic effect size vs. average triglyceride concentrations, suggesting the effect sizes are largely attributable to their relationship to overall mean triglyceride concentrations.
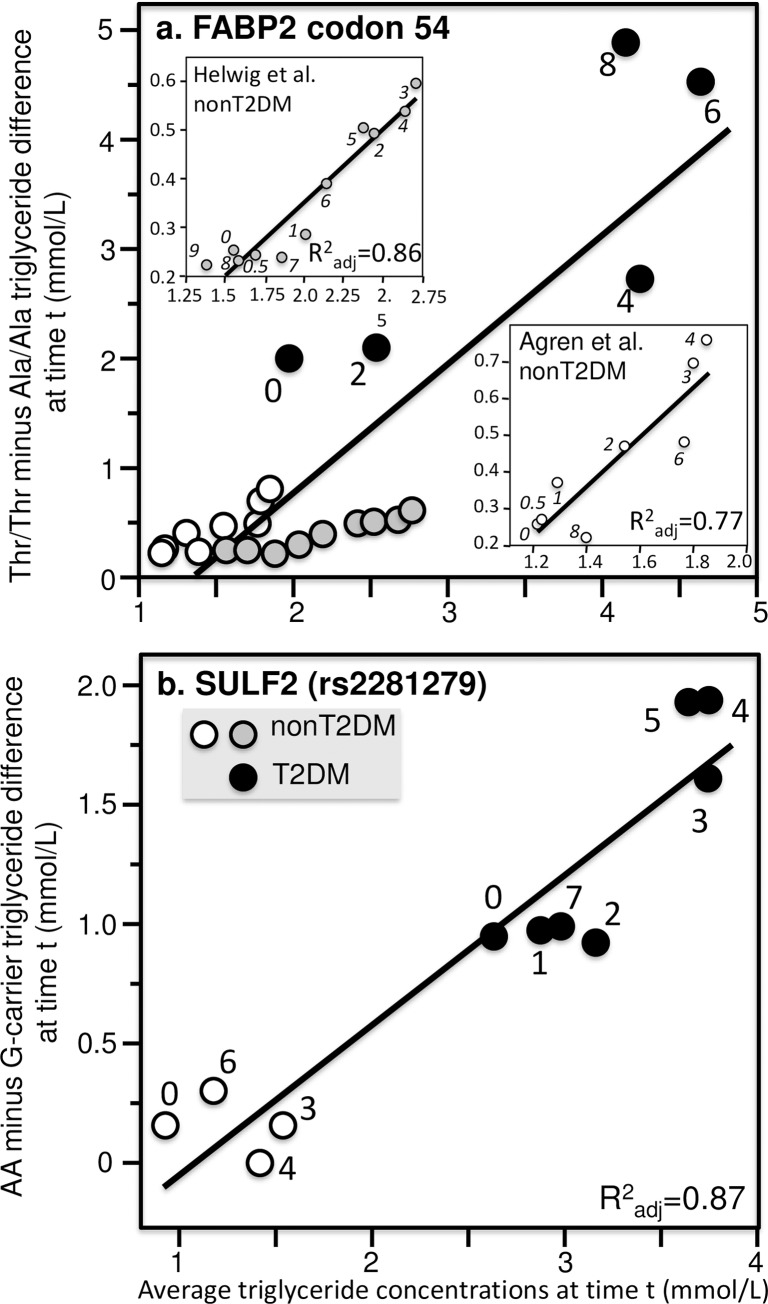
Fig 11. Quantile-dependent expressivity plots for postprandial triglyceride responses by FABP2 and SULF2 polymorphisms.
(a) Derived from the postprandial response figures published by Helwig et al. for 360 AlaAla, 287 AlaThr, and 53 ThrThr nondiabetic patients [44] (shaded circles, P = 2.2x10⁻⁵), Agren et al. for 7 AlaAla and 8 ThrThr nondiabetic patients [4] (open circles, P = 0.003), and Georgopoulos et al. for 9 T2DM AlaAla and 6 T2DM ThrThr (P = 0.10) [37] of the codon 54 polymorphism of the FABP2 gene (solid black circles rs1799883). Significance of the combined data: P = 8.1x10⁻⁸. (b) Matikainen et al. for 22 AA and 46 carriers of the G allele in nondiabetics (P = 0.54) [74] and Hassing et al. for 11 AA and 18 carriers of the G-allele in T2DM (P = 0.007) of the SULF2 rs2281279 polymorphism [43] (combined data: P = 6.3x10⁻⁶).
Fig 12. Quantile-dependent expressivity plots for postprandial triglyceride responses by TCF7L2, TM6SF2, and MTTP polymorphisms.
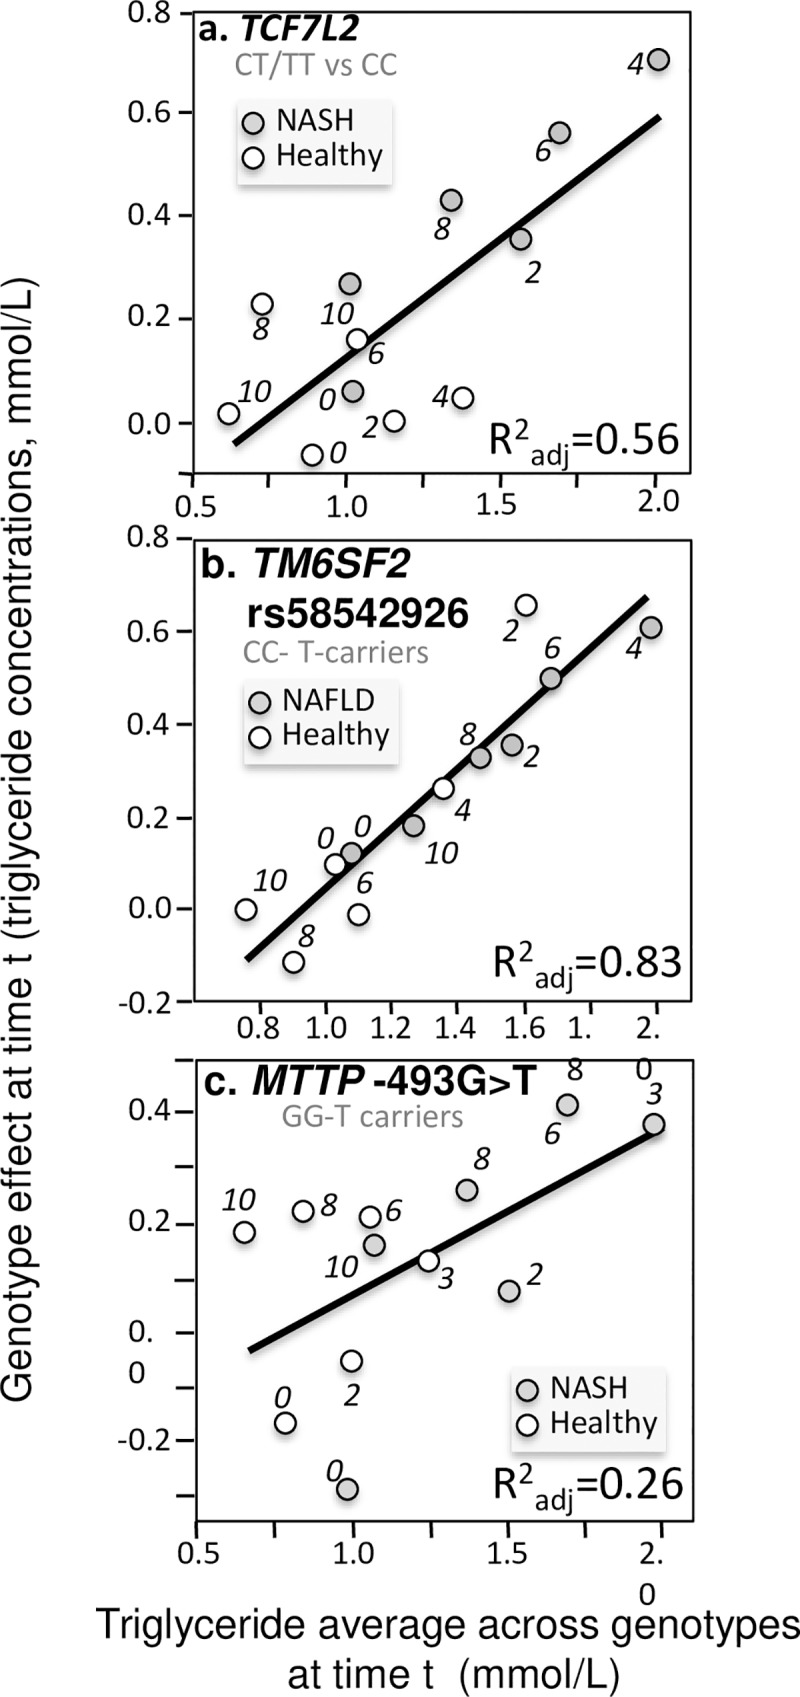
Derived from the postprandial responses in NAFLD and non-NAFLD patients published by: a) Musso et al. for 38 T-carriers vs. 30 CC homozygotes of the rs7903146 polymorphism in the TCF7L2 gene (P = 0.003) [81]; b) Musso et al. for 853 CC homozygotes vs. 130 T-carriers for the TM6SF2 loss-of-function variant (rs58542926, P = 2.5x10⁻⁵) [83]; c) Gambino et al. for 32 GG homozygotes vs. 24 T-carriers for the -493 G/T polymorphism in the MTTP gene (P = 0.05) [35].
Twenty-six other reports did not provide significant evidence for quantile-dependent expressivity. Twelve of these were not actually negative results because they reported no significant effect of genotypes on postprandial triglyceride in their original publications and therefore could not be expected to provide evidence for quantile dependence, i.e., Byrne et al. for the APOB insertion/deletion polymorphism [12], Fisher et al. for APOA4 Gln360His [33], Gerdes et al. analysis of LPL D9S [38], Jansen et al. for the C-480T transition in the HL promoter [57], Jayewardene analysis of CD36 gene polymorphisms [58], Masana et al. for APOA 5-1131T>C [72], Mooij et al. for hereditary multiple exostosis [77], Nierman et al. for LPL S447X [84]; Ostos et al. analyses of APOA4 Gln360His [92], Pratley et al. for FABP2 Ala54Thr [101], Tahvanainen et al. for FABP2 Ala54Thr [116], and Tilly-Kiesi et al. for apoA-1 deletion of the codon for Lys 107 [121]. The remaining 14 papers showed limited or no statistically significant evidence for quantile dependence because of their limited statistical power, or lack of effect: Delgado-Lista et al. for APOC3 at binding site -640 (P = 0.85) [27], Gerdes et al. for LPL N291S (P = 0.48) [38], Gertow et al. for FATP1 intron 8 G/A polymorphism (P = 0.10) [39], Gudnason et al. for CETP Taq1B polymorphism (P = 0.11) [42], Jang et al. for APOA5 -1131T>C (P = 0.17) [56], Kolovou et al. for CETP Taq1B polymorphism (P = 0.47) [62], Gomez-Delgado et al. for TNF-alpha rs1800629 (P = 0.08) [41], Martin et al. for APOA5 S19W (P = 0.17) and APOA5 -1131T>C (P = 0.11) [71], Masuda et al. for CD36 deficiency (P = 0.72) [73], Mero et al. for LPL Asn291Ser (P = 0.76) [75], Miesenböck et al. for LPL missense mutation at codon 188 (P = 0.41) [76], Ooi et al. for PCSK9 loss of function carriers (P = 0.35) [89], and Perez-Martinez et al. for the APOB -516C/T polymorphism (P = 0.07) [94]. Contrary to quantile dependent expressivity, Carpentier et al. report that 3 lipoprotein lipase deficient individual with extreme phenotype (fasting triglycerides >18 mmol/L) showed significantly smaller effect size when the controls postprandial triglycerides were highest [17].
Discussion
Genetic variants are traditionally characterized by a fixed effect size, whereas the analyses presented in this report show that the effect size for the majority of genes affecting plasma triglyceride concentrations increase as plasma concentrations increase in the postprandial state. This phenomenon, quantile-dependent expressivity, may arise because the impaired functionalities of these genetic variants increase at higher triglyceride concentrations. These genetic variants showed a progressively increasing dose-response, with intermediate effect sizes at intermediate triglyceride concentrations. Postprandial observations are particularly compelling arguments for quantile-dependent expressivity because they demonstrate the phenomenon when triglyceride levels are manipulated within individuals, while factors contributing to the substantial between-person variability in lipemic response remain constant.
Quantile-dependent expressivity affects biological interpretation. Factors affecting plasma triglyceride concentration (e.g., sex, drugs, disease, diet, age [135]) will appear to interact significantly with genetic variants, leading to conclusions of gene-environment interactions and genetic predictors of drug efficacy (i.e., personalized medicine). Examples to follow show that such results may be more simply explained by the factors’ effects on triglyceride concentrations, which in turn change the genotype’s effect size in accordance with quantile-dependent expressivity.
Sex differences
Olano-Martin et al.’s report on APOA5–1131 T>C polymorphism [88], Jackson et al.’s report on the LEPR Gln223Arg polymorphism (rs1137101) [52], Vimaleswaran et al. ‘s report on the APOB insertion/deletion polymorphism (rs17240441) [124], and Swatwan et al. reported on LPL S447X polymorphism [110] all hypothesize sex-dependent genetic effects. However, males are reported to have 63% higher fasting triglycerides, 61% higher maximum concentrations during the postprandial period, 63% greater area under the curve (AUC), and 77% greater incremental AUC when fasting triglycerides are subtracted (IAUC) [136]. All four genetic variants show strong dependence on total triglyceride concentrations during lipemia. Thus, quantile-dependent expressivity would predict a greater difference between genotypes in males than females in the postprandial state, as observed.
As a specific example, Fig 8 (upper panel) shows the TC vs. TT postprandial triglyceride difference for the APOA5–1131 T>C polymorphism in men and women [88]. The sex differences were originally attributed to the effects of sex steroids on receptor- and nonreceptor-dependent stages in TRL metabolism. The quantile-dependent expressivity plot in the lower panel shows that males and females represent largely nonoverlapping range of values over which the mean triglyceride concentrations predict increasingly larger TC vs. TT postprandial triglyceride differences. The graph clearly ascribes the difference between the sexes to male-female differences in plasma triglyceride levels and a shared (i.e., non-sex specific) underlying relationship between the effect size and overall average triglyceride levels.
Fenofibrate treatment
Fenofibrate is a highly effective triglyceride-lowering treatment [137]. The effects of fenofibrate on postprandial triglycerides have been reported by apo E isoforms [51], −1131T>C APOA5 polymorphism [16], APOA5 56G carriers vs. noncarriers [63], S19W polymorphism in APOA5 [114], and the exon 1 G2S variant of the SCARB1 gene [66]. All five studies concluded that the genotype predicted the efficacy of fenofibrate treatment to lower postprandial triglyceride concentrations.
Using data presented by Irvin et al. [51], the histogram in Fig 9 (upper panel) was created showing that fenofibrate-induced reductions in mean plasma triglyceride concentrations were greater in E4-carriers and E2-carriers than E33 homozygotes. This was true at fasting (time 0) and postprandially at 3.5 and 6 hours. This histogram of the treatment effect by genotype ignores the mean triglyceride concentrations pre- and post treatment, which are displayed in the middle panel. This middle panel emphasizes the difference between genotypes with arrows connecting the mean triglyceride concentrations from the E33 to the E2 carriers (E4-carriers always had an intermediate concentration). The far right section within the middle panel combines the arrows without regard to postprandial time. It shows that the genotype differences increase with average triglyceride concentrations, as illustrated by the quantile dependent expressivity plot of the E2-E33 effect size (dependent variable) vs. average triglyceride concentrations (independent variable) in the bottom panel. These analyses show an underlying relationship between the genetic effect size and average triglyceride concentration (bottom panel) that produces the difference between E2 and E33 genotypes (upper panel) when average triglyceride concentrations change in response to fenofibrate and fat ingestion (middle panel).
Fig 10 repeats these analyses for the results presented by Cardona et al. [16] and Lai et al. [63], showing: 1) genotype-specific mean reductions in fasting and postprandial triglycerides from fenofibrate treatment (left column), 2) different genetic effect sizes by fenofibrate use and postprandial status (center column), and 3) the underlying relationship between the genetic effect size (dependent variable) and average triglyceride concentration (independent variable) in the quantile-dependent expressivity plots (right column). Thus, each case suggests an underlying relationship between the genetic effect size and average triglyceride concentration (right column) that produces the difference between genotypes (left column) when average triglyceride concentrations change in response to fenofibrate and fat ingestion (center column).
Quantile-dependent expressivity provides a very different conceptual framework affecting the translation of these findings to clinical practice. There are two different interpretations to Figs 7 and 8: 1) the genetic variant predicts the change in postprandial lipemia (personalized medicine perspective represented by the histograms), and 2) postprandial triglyceride concentrations predict the effect size of the genetic variant (quantile-dependent expressivity). Whereas, some advocate individualized drug prescriptions through the use of genetic markers to identify patients most likely to benefit from fenofibrate treatment [138], quantile-dependent expressivity postulates that the results represent a basic phenomenon where the genetic effect size increases with plasma triglyceride concentration.
Disease conditions
Metabolic syndrome, type 2 diabetes mellitus (T2DM), non-alcoholic fatty liver disease (NAFLD) and nonalcoholic steatohepatitis (NASH, NAFLD patients with inflammation) are all conditions known to increase plasma triglyceride concentration in fasting and postprandial states [135].
Fig 11 (upper panel) present apparent differences between T2DM and non-T2DM patients that we attribute to quantile-dependent expressivity. The first example involves the Fatty Acid–Binding Protein 2 (FABP2) gene codon 54, which produces a Thr-containing (mutated-type) intestinal fatty acid binding protein that has 2-fold greater affinity for long-chain fatty acids than the wild type Ala-containing protein. This mutation is hypothesized to increase intestinal absorption and processing of fatty acids leading to increased postprandial triglycerides observed in three studies [4,37,44]. Fig 11A shows the effect size increased with increasing average triglyceride concentrations separately within non-diabetics and diabetic patients, and for the patient populations combined. Thus, the apparent difference between T2DM and nonT2DM is consistent with their different triglyceride concentrations in the context of the gene’s greater effect size at higher triglyceride concentrations.
The second example involves the sulfate glucosamine-6-O- endosulfatase 2 (SULF2) gene, which is thought to play a role in hepatic clearance of postprandial remnants [43]. Fig 11B shows that carriers of the minor G allele of the SULF2 rs2281279(A>G) SNP had lower postprandial triglycerides. Again, the different effect size in T2DM [43] than nonT2DM patients [74] was consistent with quantile-dependent expressivity and the difference in average triglyceride levels between T2DM vs. nonT2DM. Fig 12 presents three examples where apparent differences between patients with nonalcoholic fatty liver disease (NAFLD) and healthy controls can be attributed to quantile-dependent expressivity. Musso et al. reported that the transmembrane 6 superfamily member 2 (TM6SF2) rs58542926 polymorphism [83] and the transcription Factor 7–Like 2 (TCF7L2) rs7903146 polymorphism [81] had no effect on fasting plasma triglyceride concentrations. However, both polymorphisms affected postprandial triglyceride concentrations in patients with NAFLD. In NASH patients, carriers of the T allele of TCF7L2 showed significantly greater increases in postprandial plasma triglycerides than CC homozygotes, and the difference between genotypes in NASH patients was significantly greater than the difference in healthy patients (Fig 12A). In NAFLD patients, CC homozygotes of TM6SF2 showed significantly greater increases in postprandial plasma triglycerides than carriers of the T allele, and the difference between genotypes in NAFLD patients was again significantly greater than the difference in healthy patients (Fig 12B). The combined patient data show that for both polymorphisms, the difference between genotypes increased linearly with increasing average triglyceride concentrations, with the healthy patients clustered in the lower left quadrant and the NASH and NAFLD patients distributed along the diagonal (lower panels). The quantile-dependent expressivity interpretation is that the genetic effect size of the each polymorphism increases with increasing triglyceride concentrations, with NAFLD patients occupying different portions of the underlying triglyceride distribution (higher triglyceride) than healthy patients (lower triglycerides).
The third example involves the microsomal triglyceride transport protein’s lipid transfer activity that is required to lipidate and assemble chylomicrons, VLDL and LDL. Inhibition of the protein leads to decreased hepatic VLDL triglyceride secretion and triglyceride accumulation in hepatic cells leading to hepatic steatosis. The functional -493G->T polymorphism (rs1800591) occurs in the MTTP gene’s promoter region. Gambino et al. reported that carriers of the T allele had lower incremental area under the curve (iAUC) for triglycerides despite slightly higher fasting triglycerides in both healthy and NASH patients [35]. Fig 12C shows a somewhat greater increase in the triglyceride difference between genotypes with increasing triglyceride concentrations, with similar effects in healthy and NASH patients except for a larger genotype difference for NASH patients in accordance with their high average postprandial triglycerides.
Diet
Consistent with the quantile-dependence expressivity of Fig 2, Fig 13 shows that the triglyceride differences between APOE E3/E4 and E3/E3 genotypes tend to be intermediate on a low fat diet (when plasma and postprandial triglycerides were intermediate), highest on a high fat, high-saturated fat diet (corresponding to higher average triglyceride concentrations), and lowest on a high fat, high-saturated fat diet consumed with 3.45 g/day docosahexaenoic acid (corresponding to lowest average triglyceride concentrations).
Limitations
In almost all cases, the data were extracted using the vertical dimension of lines superimposed on figures that were imported into a computer-drawing program (Microsoft Powerpoint). This, no doubt, introduced error from both the original author’s rendering of the figures and my drawing of lines to extract their numerical data. The t-test for the linear regression slope should include these sources of measurement error. Regression analysis was performed separately from data extraction to ensure their independence. Approximately eighteen percent of the figures did not include standard errors, and those that did seemed less exactly drawn than the genotype-specific means themselves. Therefore, no effort was made to use the supplied standard errors to further improve upon the test for significant regression slopes. It is the author’s belief that the simple regression analyses presented in the figures is likely robust given that the fitted points are the average of multiple observations, and the genetic makeup of the sample did not change during the oral fat tolerance test. The extracted data are included as supplementary information that will hopefully motivate alternative analyses by others. My use of published results will certainly include publication bias in that there is little motivation for publishing nonsignificant results and that the vast majority of genotype data goes unreported for nonsignificant results. However, it is unlikely that publication bias affected the test of quantile-dependence given the hypothesis was heretofore largely unknown.
The analyses presented in this manuscript are not proposed as an alternative to the repeated measures analysis of variance or linear mixed models used in the studies identified by Parnell and colleagues [139,140]. Those analyses are designed test whether the genotypes affect the mean levels and the time course of the postprandial lipemia responses by genotype. The examples presented herein were selected on the basis of the repeated measures analyses attaining the statistical significance required to warrant publication, and nothing in our analyses raises questions about the validity of those original findings. Several of the included examples tested whether environmental factors significantly affect the genotypic postprandial lipemia response, as evidence for gene-environment interactions. Again, the analyses of this report do not challenge the statistical significance of the environmental effect.
The current analyses represent a post-hoc test of a very different question, whether the difference between genotypes increases linearly in association with mean plasma triglyceride concentrations. as a test of quantile-dependent expressivity. Biological explanations of gene-environment interactions traditionally assume epigenetic processes [139]. Quantile-dependent expressivity proposes that for genetic effects that are quantile dependent, environmental factors that distinguish high from low triglyceride concentrations will create a statistically significant environment-genotype interaction.
Conclusion
Quantile-dependent expressivity applies to the majority of genetic variants affecting postprandial triglycerides. It provides an alternative explanation for sex, disease, and dietary interactions with genotype, and an alternative explanation to genetic markers for fenofibrate efficacy. Other results are fortified by controlling for quantile-dependent expressivity, such as Carvalho-Wells et al. claim that APOE genetic variants had a greater effect on postprandial triglycerides in older than younger patients (Fig 7F) [18]. Elsewhere it has been shown that quantile-dependent expressivity affects the genetic determination of other phenotypes (body mass index, HDL-cholesterol, LDL-cholesterol, fasting glucose concentrations) [3], that heritability of coffee consumption is quantile specific [141], and that quantile effects may partially explain the obesity epidemic affecting Western societies [142].
Methods
The analyses presented in this paper are based exclusively on the published graphs of postprandial triglyceride responses over time. Of the 128 published papers, we identified 97 papers providing plots of postprandial triglyceride lipoprotein differences between genotypes at four or more time points (S1 Table). The figures were imported from the articles’ pdf files into Microsoft Powerpoint to extract their quantitative information (version 12.3.6 for Macintosh computers, Microsoft corporation, Redmond WA). For each figure, vertical lines were drawn to correspond to the overall height of the Y-axis, and the vertical distances between the X-axis and each plotted point. Their heights were recorded from the software’s formatting pallet and the individual plotted points were converted into concentrations based on the relative heights of the Y-axis and the plotted points (88.5 mg/dl = 1 mmol/L). The resultant dataset is provided as supplementary material (S1 Data). For each published figure, plots were created for the genetic effect by average triglyceride concentrations at each time point. Except where noted (Figs 2 and 11), the regression slopes were calculated within each study. In most cases the genetic effect was calculated as the difference between two genotypes with the heterozygote combined with one of the homozygotes, in other cases it was estimated from least squares regression as the average effect per dose of the higher-valued allele. Within each figure, the average triglyceride concentration at each time point “t” was calculated from triglyceride averages and sample sizes of the genotype-specific means. Specifically, if genotype “1” had a frequency of P1 and an average triglyceride of X1(t) and genotype “2” a frequency of (1- P1) and an average triglyceride of X2(t) then the average triglyceride for the total sample at time t was P1*X1(t) + (1-P1)*X2(t). For three genotypes with frequencies of P1, P2, and 1-P1-P2 and average triglycerides of X1(t), X2(t) and X3(t), respectively, the average triglycerides at time t was calculated as P1*X1(t) + P2*X2(t) + (1-P1-P2)*X3(t). In the case of a rare genotype vs. unaffected controls, the average triglyceride concentration was taken as the mean triglyceride concentration of the unaffected controls.
Linear regression analyses of the genetic effect (dependent variable) versus mean triglyceride concentrations (independent variable) were performed using JMP (version 5.1, SAS institute, Cary North Carolina). The regression models are based on the mean triglyceride values presented in the published figures and not individual subject responses. Adjusted coefficients of determination (R2adj) are presented to assess the level of correspondence between the average triglyceride differences between genotypes vs. average triglyceride concentrations at each time point, including the fasting (baseline) value. Although all of the regression models include only one explanatory variable, the adjusted R2 was used to penalize the R2 for the small number of observations (time points) used in the model. The slopes are presented with their standard error, and their significances based on the degrees of freedom (number of time points with fasting or postprandial measurements minus two).
The data is based on published summary reports that are publically available. A spreadsheet of the extracted quantified information by time and genotype are provided in supplementary material (S1 Data).
Supporting information
(DOCX)
(XLSX)
Data Availability
All relevant data are within the manuscript and its Supporting Information files.
Funding Statement
The author received no specific funding for this work.
References
- 1.Roche HM, Gibney MJ. Postprandial triacylglycerolaemia: nutritional implications. Prog Lipid Res. 1995;34:249–266. 10.1016/0163-7827(95)00012-o [DOI] [PubMed] [Google Scholar]
- 2.Zilversmit DB. Atherogenesis: A postprandial phenomenon. Circulation. 1979;60:473–485 10.1161/01.cir.60.3.473 [DOI] [PubMed] [Google Scholar]
- 3.Williams PT. Quantile-specific expressivity of genes affecting lipoproteins, adiposity and height. PLoS One. 2012;7:e28764 10.1371/journal.pone.0028764 [DOI] [PMC free article] [PubMed] [Google Scholar]
- 4.Agren JJ, Valve R, Vidgren H, Laakso M, Uusitupa M. Postprandial lipemic response is modified by the polymorphism at codon 54 of the fatty acid-binding protein 2 gene. Arterioscler Thromb Vasc Biol. 1998;18:1606–1610. 10.1161/01.atv.18.10.1606 [DOI] [PubMed] [Google Scholar]
- 5.Anagnostopoulou KK, Kolovou GD, Kostakou PM, Mihas C, Hatzigeorgiou G, Marvaki C, et al. Sex-associated effect of CETP and LPL polymorphisms on postprandial lipids in familial hypercholesterolaemia. Lipids Health Dis. 2009:8:24 10.1186/1476-511X-8-24 [DOI] [PMC free article] [PubMed] [Google Scholar]
- 6.Auinger A, Helwig U, Pfeuffer M, Rubin D, Luedde M, Rausche T, et al. A variant in the heart-specific fatty acid transport protein 6 is associated with lower fasting and postprandial TAG, blood pressure and left ventricular hypertrophy. Br J Nutr. 2012;107:1422–1428. 10.1017/S0007114511004727 [DOI] [PubMed] [Google Scholar]
- 7.Bergeron N, Havel RJ. Prolonged postprandial responses of lipids and apolipoproteins in triglyceride-rich lipoproteins of individuals expressing an apolipoprotein epsilon 4 allele. J Clin Invest. 1996;97:65–72. 10.1172/JCI118408 [DOI] [PMC free article] [PubMed] [Google Scholar]
- 8.Berthier MT, Couillard C, Prud'homme D, Nadeau A, Bergeron J, Tremblay A, et al. Effects of the FABP2 A54T mutation on triglyceride metabolism of viscerally obese men. Obes Res. 2001;9:668–675. 10.1038/oby.2001.91 [DOI] [PubMed] [Google Scholar]
- 9.Boerwinkle E, Brown S, Sharrett AR, Heiss G, Patsch W. Apolipoprotein E polymorphism influences postprandial retinyl palmitate but not triglyceride concentrations. Am J Hum Genet. 1994;54:341–360. [PMC free article] [PubMed] [Google Scholar]
- 10.Brenninkmeijer BJ, Stuyt PM, Demacker PN, Stalenhoef AF, van 't Laar A. Catabolism of chylomicron remnants in normolipidemic subjects in relation to the apoprotein E phenotype. J Lipid Res. 1987;28:361–370. [PubMed] [Google Scholar]
- 11.Brown AJ, Roberts DC. The effect of fasting triacylglyceride concentration and apolipoprotein E polymorphism on postprandial lipemia. Arterioscler Thromb. 1991;11:1737–1744 10.1161/01.atv.11.6.1737 [DOI] [PubMed] [Google Scholar]
- 12.Byrne CD, Wareham NJ, Mistry PK, Phillips DI, Martensz ND, Halsall D, et al. The association between free fatty acid concentrations and triglyceride-rich lipoproteins in the post-prandial state is altered by a common deletion polymorphism of the apo B signal peptide. Atherosclerosis. 1996;127:35–42. 10.1016/s0021-9150(96)05932-1 [DOI] [PubMed] [Google Scholar]
- 13.Calabresi L, Cassinotti M, Gianfranceschi G, Safa O, Murakami T, Sirtori CR, et al. Increased postprandial lipemia in Apo A-IMilano carriers. Arterioscler Thromb. 1993;13:521–528 10.1161/01.atv.13.4.521 [DOI] [PubMed] [Google Scholar]
- 14.Cardona F, Morcillo S, Gonzalo-Marin M, Tinahones FJ. The apolipoprotein E genotype predicts postprandial hypertriglyceridemia in patients with the metabolic syndrome. J Clin Endocrinol Metab. 2005;90:2972–2975. 10.1210/jc.2004-1912 [DOI] [PubMed] [Google Scholar]
- 15.Cardona F, Morcillo S, Gonzalo-Marín M, Garrido-Sanchez L, Macias-Gonzalez M, Tinahones FJ. Pro12Ala sequence variant of the PPARG gene is associated with postprandial hypertriglyceridemia in non-E3/E3 patients with the metabolic syndrome. Clin Chem. 2006;52:1920–1925. 10.1373/clinchem.2006.069690 [DOI] [PubMed] [Google Scholar]
- 16.Cardona F, Guardiola M, Queipo-Ortuño MI, Murri M, Ribalta J, Tinahones FJ. The -1131T>C SNP of the APOA5 gene modulates response to fenofibrate treatment in patients with the metabolic syndrome: a postprandial study. Atherosclerosis. 2009;206:148–152. 10.1016/j.atherosclerosis.2009.02.024 [DOI] [PubMed] [Google Scholar]
- 17.Carpentier AC, Frisch F, Labbé SM, Gagnon R, de Wal J, Greentree S, et al. Effect of alipogene tiparvovec (AAV1-LPL(S447X)) on postprandial chylomicron metabolism in lipoprotein lipase-deficient patients. J Clin Endocrinol Metab. 2012;97:1635–1644. 10.1210/jc.2011-3002 [DOI] [PubMed] [Google Scholar]
- 18.Carvalho-Wells AL, Jackson KG, Gill R, Olano-Martin E, Lovegrove JA, Williams CM, et al. Interactions between age and apoE genotype on fasting and postprandial triglycerides levels. Atherosclerosis. 2010;212:481–487. 10.1016/j.atherosclerosis.2010.06.036 [DOI] [PubMed] [Google Scholar]
- 19.Clemente-Postigo M, Queipo-Ortuño M, Valdivielso P, Tinahones FJ, Cardona F. Effect of apolipoprotein C3 and apolipoprotein A1 polymorphisms on postprandial response to a fat overload in metabolic syndrome patients. Clin Biochem. 2010;43:1300–1304. 10.1016/j.clinbiochem.2010.08.014 [DOI] [PubMed] [Google Scholar]
- 20.Connors KE, Karlos AE, Gnatiuk EA, Shearer J, Reimer RA, Hittel DS. SORT1 protective allele is associated with attenuated postprandial: lipaemia in young adults. Circ Cardiovasc Genet. 2014;7:576–582. 10.1161/CIRCGENETICS.114.000534 [DOI] [PubMed] [Google Scholar]
- 21.Corella D, Arnett DK, Tsai MY, Kabagambe EK, Peacock JM, Hixson JE, et al. The -256T>C polymorphism in the apolipoprotein A-II gene promoter is associated with body mass index and food intake in the genetics of lipid lowering drugs and diet network study. Clin Chem. 2007;53:1144–1152. 10.1373/clinchem.2006.084863 [DOI] [PubMed] [Google Scholar]
- 22.Dallongeville J, Tiret L, Visvikis S, O'Reilly DS, Saava M, Tsitouris G, et al. Effect of apo E phenotype on plasma postprandial triglyceride levels in young male adults with and without a familial history of myocardial infarction: the EARS II study. European Atherosclerosis Research Study. Atherosclerosis. 1999;145:381–388. 10.1016/s0021-9150(99)00069-6 [DOI] [PubMed] [Google Scholar]
- 23.Dart A, Sherrard B, Simpson H. Influence of apo E phenotype on postprandial triglyceride and glucose responses in subjects with and without coronary heart disease. Atherosclerosis. 1997;130(1–2):161–70. 10.1016/s0021-9150(96)06062-5 [DOI] [PubMed] [Google Scholar]
- 24.Dart AM, Cooper B. Independent effects of Apo E phenotype and plasma triglyceride on lipoprotein particle sizes in the fasting and postprandial states. Arterioscler Thromb Vasc Biol. 1999;19:2465–2473. 10.1161/01.atv.19.10.2465 [DOI] [PubMed] [Google Scholar]
- 25.Delgado-Lista J, Perez-Jimenez F, Tanaka T, Perez-Martinez P, Jimenez-Gomez Y, Marin C, et al. An apolipoprotein A-II polymorphism (-265T/C, rs5082) regulates postprandial response to a saturated fat overload in healthy men. J Nutr. 2007;137:2024–2028. 10.1093/jn/137.9.2024 [DOI] [PubMed] [Google Scholar]
- 26.Delgado-Lista J, Perez-Martinez P, Perez-Jimenez F, Garcia-Rios A, Fuentes F, Marin C, et al. ABCA1 gene variants regulate postprandial lipid metabolism in healthy men. Arterioscler Thromb Vasc Biol. 2010;30:1051–1057. 10.1161/ATVBAHA.109.202580 [DOI] [PMC free article] [PubMed] [Google Scholar]
- 27.Delgado-Lista J, Perez-Jimenez F, Ruano J, Perez-Martinez P, Fuentes F, Criado-Garcia J, et al. Effects of variations in the APOA1/C3/A4/A5 gene cluster on different parameters of postprandial lipid metabolism in healthy young men. J Lipid Res. 2010;51:63–73. 10.1194/jlr.M800527-JLR200 [DOI] [PMC free article] [PubMed] [Google Scholar]
- 28.Delgado-Lista J, Garcia-Rios A, Perez-Martinez P, Solivera J, Yubero-Serrano EM, Fuentes F, et al. Interleukin 1B variant -1473G/C (rs1143623) influences triglyceride and interleukin 6 metabolism. J Clin Endocrinol Metab. 2011;96:E816–E820. 10.1210/jc.2010-2455 [DOI] [PMC free article] [PubMed] [Google Scholar]
- 29.Engelbrechtsen L, Hansen TH, Mahendran Y, Pyl P, Andersson E, Jonsson A, et al. Homozygous carriers of the TCF7L2 rs7903146 T-allele show altered postprandial response in triglycerides and triglyceride-rich lipoproteins. Sci Rep. 2017;7:43128 10.1038/srep43128 [DOI] [PMC free article] [PubMed] [Google Scholar]
- 30.Erkkilä AT, Schwab US, Agren JJ, Hallikainen M, Gylling H, Uusitupa MI. Moderate increase in dietary sucrose does not influence fasting or postprandial serum lipids regardless of the presence of apolipoprotein E2 allele in healthy subjects. Eur J Clin Nutr. 2007;61:1094–1101. 10.1038/sj.ejcn.1602620 [DOI] [PubMed] [Google Scholar]
- 31.Fernández-Miranda C, Cancelas P, Sanz M, Porres A, Gámez Gerique J. Influence of apolipoprotein-E phenotypes on postprandial lipoprotein metabolism after three different fat loads. Nutrition. 2001;17:529–533. 10.1016/s0899-9007(01)00552-4 [DOI] [PubMed] [Google Scholar]
- 32.Ferreira AP, Ferreira CB, Brito CJ, Souza VC, Córdova C, Nóbrega OT, et al. The effect of aerobic exercise intensity on attenuation of postprandial lipemia is dependent on apolipoprotein E genotype. Atherosclerosis. 2013;229:139–144. 10.1016/j.atherosclerosis.2013.03.027 [DOI] [PubMed] [Google Scholar]
- 33.Fisher RM, Burke H, Nicaud V, Ehnholm C, Humphries SE. Effect of variation in the apo A-IV gene on body mass index and fasting and postprandial lipids in the European Atherosclerosis Research Study II. EARS Group. J Lipid Res. 1999;40:287–294. [PubMed] [Google Scholar]
- 34.Fontaine-Bisson B, Wolever TM, Chiasson JL, Rabasa-Lhoret R, Maheux P, Josse RG, et al. Tumor necrosis factor alpha -238G > A genotype alters postprandial plasma levels of free fatty acids in obese individuals with type 2 diabetes mellitus. Metabolism. 2007;56:649–655. 10.1016/j.metabol.2006.12.013 [DOI] [PubMed] [Google Scholar]
- 35.Gambino R, Cassader M, Pagano G, Durazzo M, Musso G. Polymorphism in microsomal triglyceride transfer protein: a link between liver disease and atherogenic postprandial lipid profile in NASH? Hepatology. 2007;45:1097–1107. 10.1002/hep.21631 [DOI] [PubMed] [Google Scholar]
- 36.Geng X, Irvin MR, Hidalgo B, Aslibekyan S, Srinivasasainagendra V, An P, et al. An exome-wide sequencing study of lipid response to high-fat meal and fenofibrate in Caucasians from the GOLDN cohort. J Lipid Res. 2018;59:722–729. 10.1194/jlr.P080333 [DOI] [PMC free article] [PubMed] [Google Scholar]
- 37.Georgopoulos A, Aras O, Tsai MY. Codon-54 polymorphism of the fatty acid-binding protein 2 gene is associated with elevation of fasting and postprandial triglyceride in type 2 diabetes. J Clin Endocrinol Metab. 2000;85:3155–3160. 10.1210/jcem.85.9.6791 [DOI] [PubMed] [Google Scholar]
- 38.Gerdes C, Fisher RM, Nicaud V, Boer J, Humphries SE, Talmud PJ, et al. Lipoprotein lipase variants D9N and N291S are associated with increased plasma triglyceride and lower high-density lipoprotein cholesterol concentrations: studies in the fasting and postprandial states: the European Atherosclerosis Research Studies. Circulation. 1997;96:733–740. 10.1161/01.cir.96.3.733 [DOI] [PubMed] [Google Scholar]
- 39.Gertow K, Skoglund-Andersson C, Eriksson P, Boquist S, Orth-Gomér K, Schenck-Gustafsson K, et al. A common polymorphism in the fatty acid transport protein-1 gene associated with elevated post-prandial lipaemia and alterations in LDL particle size distribution. Atherosclerosis. 2003;167:265–273. 10.1016/s0021-9150(02)00454-9 [DOI] [PubMed] [Google Scholar]
- 40.Gómez P, Miranda JL, Marín C, Bellido C, Moreno JA, Moreno R, et al. Influence of the -514C/T polymorphism in the promoter of the hepatic lipase gene on postprandial lipoprotein metabolism. Atherosclerosis. 2004;174:73–79. 10.1016/j.atherosclerosis.2003.12.038 [DOI] [PubMed] [Google Scholar]
- 41.Gomez-Delgado F, Alcala-Diaz JF, Garcia-Rios A, Delgado-Lista J, Ortiz-Morales A, Rangel-Zuñiga O, et al. Polymorphism at the TNF-alpha gene interacts with Mediterranean diet to influence triglyceride metabolism and inflammation status in metabolic syndrome patients: From the CORDIOPREV clinical trial. Mol Nutr Food Res. 2014;58:1519–1527. 10.1002/mnfr.201300723 [DOI] [PubMed] [Google Scholar]
- 42.Gudnason V, Kakko S, Nicaud V, Savolainen MJ, Kesäniemi YA, Tahvanainen E, et al. Cholesteryl ester transfer protein gene effect on CETP activity and plasma high-density lipoprotein in European populations. The EARS Group. Eur J Clin Invest. 1999;29:116–128. 10.1046/j.1365-2362.1999.00412.x [DOI] [PubMed] [Google Scholar]
- 43.Hassing HC, Surendran RP, Derudas B, Verrijken A, Francque SM, Mooij HL, et al. SULF2 strongly prediposes to fasting and postprandial triglycerides in patients with obesity and type 2 diabetes mellitus. Obesity (Silver Spring). 2014;22:1309–1316. [DOI] [PMC free article] [PubMed] [Google Scholar]
- 44.Helwig U, Rubin D, Klapper M, Li Y, Nothnagel M, Fölsch UR, et al. The association of fatty acid-binding protein 2 A54T polymorphism with postprandial lipemia depends on promoter variability. Metabolism. 2007;56:723–731. 10.1016/j.metabol.2006.11.014 [DOI] [PubMed] [Google Scholar]
- 45.Hockey KJ, Anderson RA, Cook VR, Hantgan RR, Weinberg RB. Effect of the apolipoprotein A-IV Q360H polymorphism on postprandial plasma triglyceride clearance. J Lipid Res. 2001;42:211–217. [PubMed] [Google Scholar]
- 46.Holleboom AG, Karlsson H, Lin RS, Beres TM, Sierts JA, Herman DS, et al. Heterozygosity for a loss-of-function mutation in GALNT2 improves plasma triglyceride clearance in man. Cell Metab. 2011;14:811–818. 10.1016/j.cmet.2011.11.005 [DOI] [PMC free article] [PubMed] [Google Scholar]
- 47.Hooper AJ, Robertson K, Barrett PH, Parhofer KG, van Bockxmeer FM, Burnett JR. Postprandial lipoprotein metabolism in familial hypobetalipoproteinemia. J Clin Endocrinol Metab. 2007;92:1474–1478. 10.1210/jc.2006-1998 [DOI] [PubMed] [Google Scholar]
- 48.Hooper AJ, Heeks L, Robertson K, Champain D, Hua J, Song S, et al. Lipoprotein Metabolism in APOB L343V Familial Hypobetalipoproteinemia. J Clin Endocrinol Metab. 2015;100:E1484–E1490 10.1210/jc.2015-2731 [DOI] [PubMed] [Google Scholar]
- 49.Humphries SE, Nicaud V, Margalef J, Tiret L, Talmud PJ. Lipoprotein lipase gene variation is associated with a paternal history of premature coronary artery disease and fasting and postprandial plasma triglycerides: the European Atherosclerosis Research Study (EARS). Arterioscler Thromb Vasc Biol. 1998;18:526–534. 10.1161/01.atv.18.4.526 [DOI] [PubMed] [Google Scholar]
- 50.Inazu A, Nakajima K, Nakano T, Niimi M, Kawashiri MA, Nohara A, et al. Decreased post-prandial triglyceride response and diminished remnant lipoprotein formation in cholesteryl ester transfer protein (CETP) deficiency. Atherosclerosis. 2008;196:953–957. 10.1016/j.atherosclerosis.2007.02.028 [DOI] [PubMed] [Google Scholar]
- 51.Irvin MR, Kabagambe EK, Tiwari HK, Parnell LD, Straka RJ, Tsai M, et al. (2010) Apolipoprotein E polymorphisms and postprandial triglyceridemia before and after fenofibrate treatment in the Genetics of Lipid Lowering Drugs and Diet Network (GOLDN) study. Circ Cardiovasc Genet 2010;3:462–467. 10.1161/CIRCGENETICS.110.950667 [DOI] [PMC free article] [PubMed] [Google Scholar]
- 52.Jackson KG, Delgado-Lista J, Gill R, Lovegrove JA, Williams CM, López-Miranda J, et al. The leptin receptor Gln223Arg polymorphism (rs1137101) mediates the postprandial lipaemic response, but only in males. Atherosclerosis. 2012;225:135–141. 10.1016/j.atherosclerosis.2012.08.035 [DOI] [PubMed] [Google Scholar]
- 53.Jackson KG, Lockyer S, Carvalho-Wells AL, Williams CM, Minihane AM, Lovegrove JA. Dietary fat manipulation has a greater impact on postprandial lipid metabolism than the apolipoprotein E (epsilon) genotype-insights from the SATgenε study. Mol Nutr Food Res. 2012;56:1761–1770. 10.1002/mnfr.201200452 [DOI] [PubMed] [Google Scholar]
- 54.Jackson KG, Li Y, Ryan MF, Gibney ER, Brennan L, Roche HM, et al. Association of the tumor necrosis factor-alpha promoter polymorphism with change in triacylglycerol response to sequential meals. Nutr J 2016;15:70 10.1186/s12937-016-0190-9 [DOI] [PMC free article] [PubMed] [Google Scholar]
- 55.Jackson KG, Lockyer S, Carvalho-Wells AL, Williams CM, Minihane AM, Lovegrove JA. Apolipoprotein E (epsilon) genotype has a greater impact on apoB-48 than apoB-100 responses to dietary fat manipulation-insights from the SATgenε study. Mol Nutr Food Res. 2017;61(4). [DOI] [PubMed] [Google Scholar]
- 56.Jang Y, Kim JY, Kim OY, Lee JE, Cho H, Ordovas JM, et al. The -1131T—>C polymorphism in the apolipoprotein A5 gene is associated with postprandial hypertriacylglycerolemia; elevated small, dense LDL concentrations; and oxidativestress in nonobese Korean men. Am J Clin Nutr. 2004;80:832–840. 10.1093/ajcn/80.4.832 [DOI] [PubMed] [Google Scholar]
- 57.Jansen S, Chu G, Ehnholm C, Dallongeville J, Nicaud V, Talmud PJ. The T allele of the hepatic lipase promoter variant C-480T is associated with increased fasting lipids and HDL and increased preprandial and postprandial LpCIII:B. Arterioscler Thromb Vasc Biol 1999;19:303–308. 10.1161/01.atv.19.2.303 [DOI] [PubMed] [Google Scholar]
- 58.Jayewardene AF, Mavros Y, Hancock DP, Gwinn T, Rooney KB. Associations between CD36 gene polymorphisms, fat tolerance and oral fat preference in a young-adult population. Eur J Clin Nutr. 2016. November;70(11):1325–1331. 10.1038/ejcn.2016.132 [DOI] [PubMed] [Google Scholar]
- 59.Jiménez-Gómez Y, Pérez-Jiménez F, Marín C, Gómez P, Moreno R, Delgado J, et al. The -250G/A polymorphism in the hepatic lipase gene promoter influences the postprandial lipemic response in healthy men. Nutr Metab Cardiovasc Dis. 2008;18:173–181. 10.1016/j.numecd.2006.11.002 [DOI] [PubMed] [Google Scholar]
- 60.Kobayashi J, Saito Y, Taira K, Hikita M, Takahashi K, Bujo H, et al. Effect of apolipoprotein E3/4 phenotype on postprandial triglycerides and retinyl palmitate metabolism in plasma from hyperlipidemic subjects in Japan. Atherosclerosis. 2001;154:539–546. 10.1016/s0021-9150(00)00464-0 [DOI] [PubMed] [Google Scholar]
- 61.Kolovou G, Daskalova D, Anagnostopoulou K, Hoursalas I, Voudris V, Mikhailidis DP, et al. Postprandial hypertriglyceridaemia in patients with Tangier disease. J Clin Pathol. 2003;56:937–941. 10.1136/jcp.56.12.937 [DOI] [PMC free article] [PubMed] [Google Scholar]
- 62.Kolovou G, Anagnostopoulou K, Kostakou P, Marvaki C, Mihas C, Mikhailidis DP, et al. Association between the TaqIB polymorphism in the cholesteryl ester transfer protein gene locus and postprandial plasma lipoprotein levels in heterozygotes for familial hypercholesterolemia. Clin Chem Lab Med 2007;45:1190–1198. 10.1515/CCLM.2007.267 [DOI] [PubMed] [Google Scholar]
- 63.Lai CQ, Arnett DK, Corella D, Straka RJ, Tsai MY, Peacock JM, et al. Fenofibrate effect on triglyceride and postprandial response of apolipoprotein A5 variants: the GOLDN study. Arterioscler Thromb Vasc Biol. 2007;27:1417–1425. 10.1161/ATVBAHA.107.140103 [DOI] [PubMed] [Google Scholar]
- 64.Lai CQ, Wojczynski MK, Parnell LD, Hidalgo BA, Irvin MR, Aslibekyan S, et al. Epigenome-wide association study of triglyceride postprandial responses to a high-fat dietary challenge. J Lipid Res. 2016;57:2200–2207 10.1194/jlr.M069948 [DOI] [PMC free article] [PubMed] [Google Scholar]
- 65.Lefevre M, Lovejoy JC, Smith SR, Delany JP, Champagne C, Most MM, et al. Comparison of the acute response to meals enriched with cis- or trans-fatty acids on glucose and lipids in overweight individuals with differing FABP2 genotypes. Metabolism. 2005;54:1652–1658. 10.1016/j.metabol.2005.06.015 [DOI] [PubMed] [Google Scholar]
- 66.Liu Y, Ordovas JM, Gao G, Province M, Straka RJ, Tsai MY, et al. The SCARB1 gene is associated with lipid response to dietary and pharmacological interventions. J Hum Genet. 2008;53:709–717. 10.1007/s10038-008-0302-2 [DOI] [PMC free article] [PubMed] [Google Scholar]
- 67.Lopez-Miranda J, Ordovas JM, Ostos MA, Marin C, Jansen S, Salas J, et al. Dietary fat clearance in normal subjects is modulated by genetic variation at the apolipoprotein B gene locus. Arterioscler Thromb Vasc Biol. 1997;17:1765–1773. 10.1161/01.atv.17.9.1765 [DOI] [PubMed] [Google Scholar]
- 68.López-Miranda J, Cruz G, Gómez P, Marín C, Paz E, Pérez-Martínez P, et al. The influence of lipoprotein lipase gene variation on postprandial lipoprotein metabolism. J Clin Endocrinol Metab. 2004;89:4721–4728. 10.1210/jc.2003-031642 [DOI] [PubMed] [Google Scholar]
- 69.Lundahl B, Hamsten A, Karpe F. Postprandial plasma ApoB-48 levels are influenced by a polymorphism in the promoter of the microsomal triglyceride transfer protein gene. Arterioscler Thromb Vasc Biol. 2002;22:289–293. 10.1161/hq0202.102876 [DOI] [PubMed] [Google Scholar]
- 70.Marín C, López-Miranda J, Gómez P, Paz E, Pérez-Martínez P, Fuentes F, et al. Effects of the human apolipoprotein A-I promoter G-A mutation on postprandial lipoprotein metabolism. Am J Clin Nutr 2002;76:319–325. 10.1093/ajcn/76.2.319 [DOI] [PubMed] [Google Scholar]
- 71.Martin S, Nicaud V, Humphries SE, Talmud PJ; EARS group. Contribution of APOA5 gene variants to plasma triglyceride determination and to the response to both fat and glucose tolerance challenges. Biochim Biophys Acta. 2003;1637:217–225. 10.1016/s0925-4439(03)00033-4 [DOI] [PubMed] [Google Scholar]
- 72.Masana L, Ribalta J, Salazar J, Fernández-Ballart J, Joven J, Cabezas MC. The apolipoprotein AV gene and diurnal triglyceridaemia in normolipidaemic subjects. Clin Chem Lab Med. 2003;41:517–521. 10.1515/CCLM.2003.078 [DOI] [PubMed] [Google Scholar]
- 73.Masuda D, Hirano K, Oku H, Sandoval JC, Kawase R, Yuasa-Kawase M, et al. Chylomicron remnants are increased in the postprandial state in CD36 deficiency. J Lipid Res. 2009;50:999–1011. 10.1194/jlr.P700032-JLR200 [DOI] [PMC free article] [PubMed] [Google Scholar]
- 74.Matikainen N, Burza MA, Romeo S, Hakkarainen A, Adiels M, Folkersen L, et al. Genetic variation in SULF2 is associated with postprandial clearance of triglyceride-rich remnant particles and triglyceride levels in healthy subjects. PLoS One. 2013;8:e79473 10.1371/journal.pone.0079473 [DOI] [PMC free article] [PubMed] [Google Scholar]
- 75.Mero N, Suurinkeroinen L, Syvänne M, Knudsen P, Yki-Järvinen H, Taskinen MR. Delayed clearance of postprandial large TG-rich particles in normolipidemic carriers of LPL Asn291Ser gene variant. J Lipid Res. 1999;40:1663–1670. [PubMed] [Google Scholar]
- 76.Miesenböck G, Hölzl B, Föger B, Brandstätter E, Paulweber B, Sandhofer F, et al. Heterozygous lipoprotein lipase deficiency due to a missense mutation as the cause of impaired triglyceride tolerance with multiple lipoprotein abnormalities. J Clin Invest. 1993;91:448–455. 10.1172/JCI116222 [DOI] [PMC free article] [PubMed] [Google Scholar]
- 77.Mooij HL, Bernelot Moens SJ, Gordts PL, Stanford KI, Foley EM, van den Boogert MA, et al. Ext1 heterozygosity causes a modest effect on postprandial lipid clearance in humans. J Lipid Res. 2015;56:665–673. 10.1194/jlr.M053504 [DOI] [PMC free article] [PubMed] [Google Scholar]
- 78.Moreno JA, López-Miranda J, Marín C, Gómez P, Pérez-Martínez P, Fuentes F, et al. The influence of the apolipoprotein E gene promoter (-219G/ T) polymorphism on postprandial lipoprotein metabolism in young normolipemic males. J Lipid Res. 2003;44:2059–2064. 10.1194/jlr.M300124-JLR200 [DOI] [PubMed] [Google Scholar]
- 79.Moreno R, Perez-Jimenez F, Marin C, Moreno JA, Gomez P, Bellido C, et al. A single nucleotide polymorphism of the apolipoprotein A-V gene -1131T>C modulates postprandial lipoprotein metabolism. Atherosclerosis. 2006;189:163–168. 10.1016/j.atherosclerosis.2005.11.029 [DOI] [PubMed] [Google Scholar]
- 80.Moreno-Luna R, Perez-Jimenez F, Marin C, Perez-Martinez P, Gomez P, Jimenez-Gomez Y, et al. Two independent apolipoprotein A5 haplotypes modulate postprandial lipoprotein metabolism in a healthy Caucasian population. J Clin Endocrinol Metab. 2007;92:2280–2285. 10.1210/jc.2006-1802 [DOI] [PubMed] [Google Scholar]
- 81.Musso G, Gambino R, Pacini G, Pagano G, Durazzo M, Cassader M. Transcription factor 7-like 2 polymorphism modulates glucose and lipid homeostasis, adipokine profile, and hepatocyte apoptosis in NASH. Hepatology. 2009;49:426–435. 10.1002/hep.22659 [DOI] [PubMed] [Google Scholar]
- 82.Musso G, Cassader M, De Michieli F, Saba F, Bo S, Gambino R. Effect of lectin-like oxidized LDL receptor-1 polymorphism on liver disease, glucose homeostasis, and postprandial lipoprotein metabolism in nonalcoholic steatohepatitis. Am J Clin Nutr. 2011;94:1033–1042. 10.3945/ajcn.111.015610 [DOI] [PubMed] [Google Scholar]
- 83.Musso G, Cipolla U, Cassader M, Pinach S, Saba F, De Michieli F, et al. TM6SF2 rs58542926 variant affects postprandial lipoprotein metabolism and glucose homeostasis in NAFLD. J Lipid Res. 2017;58:1221–1229. 10.1194/jlr.M075028 [DOI] [PMC free article] [PubMed] [Google Scholar]
- 84.Nierman MC, Rip J, Kuivenhoven JA, van Raalte DH, Hutten BA, Sakai N, et al. Carriers of the frequent lipoprotein lipase S447X variant exhibit enhanced postprandial apoprotein B-48 clearance. Metabolism. 2005;54:1499–1503. 10.1016/j.metabol.2005.05.016 [DOI] [PubMed] [Google Scholar]
- 85.Nikkilä M, Solakivi T, Lehtimäki T, Koivula T, Laippala P, Aström B. Postprandial plasma lipoprotein changes in relation to apolipoprotein E phenotypes and low density lipoprotein size in men with and without coronary artery disease. Atherosclerosis. 1994;106:149–157. 10.1016/0021-9150(94)90120-1 [DOI] [PubMed] [Google Scholar]
- 86.Noto D, Cefalù AB, Cannizzaro A, Minà M, Fayer F, Valenti V, et al. Familial hypobetalipoproteinemia due to apolipoprotein B R463W mutation causes intestinal fat accumulation and low postprandial lipemia. Atherosclerosis. 2009;206:193–198. 10.1016/j.atherosclerosis.2009.01.037 [DOI] [PubMed] [Google Scholar]
- 87.O'Hare EA, Yang R, Yerges-Armstrong LM, Sreenivasan U, McFarland R, Leitch CC, et al. TM6SF2 rs58542926 impacts lipid processing in liver and small intestine. Hepatology. 2017;65:1526–1542. 10.1002/hep.29021 [DOI] [PMC free article] [PubMed] [Google Scholar]
- 88.Olano-Martin E, Abraham EC, Gill-Garrison R, Valdes AM, Grimaldi K, Tang F, et al. Influence of apoA-V gene variants on postprandial triglyceride metabolism: impact of gender. J Lipid Res. 2008;49:945–953. 10.1194/jlr.M700112-JLR200 [DOI] [PubMed] [Google Scholar]
- 89.Ooi TC, Krysa JA, Chaker S, Abujrad H, Mayne J, Henry K, et al. The Effect of PCSK9 Loss-of-Function Variants on the Postprandial Lipid and ApoB-Lipoprotein Response. J Clin Endocrinol Metab. 2017;102:3452–3460. 10.1210/jc.2017-00684 [DOI] [PubMed] [Google Scholar]
- 90.Orth M, Wahl S, Hanisch M, Friedrich I, Wieland H, Luley C. Clearance of postprandial lipoproteins in normolipemics: role of the apolipoprotein E phenotype. Biochim Biophys Acta. 1996;1303:22–30. 10.1016/0005-2760(96)00075-6 [DOI] [PubMed] [Google Scholar]
- 91.Ostos MA, Lopez-Miranda J, Ordovas JM, Marin C, Blanco A, Castro P, et al. Dietary fat clearance is modulated by genetic variation in apolipoprotein A-IV gene locus. J Lipid Res. 1998;39:2493–2500. [PubMed] [Google Scholar]
- 92.Ostos MA, Lopez-Miranda J, Marin C, Castro P, Gomez P, Paz E, et al. The apolipoprotein A-IV-360His polymorphism determines the dietary fat clearance in normal subjects. Atherosclerosis. 2000;153:209–217. 10.1016/s0021-9150(00)00400-7 [DOI] [PubMed] [Google Scholar]
- 93.Pérez-Martínez P, López-Miranda J, Ordovás JM, Bellido C, Marín C, Gómez P, et al. Postprandial lipemia is modified by the presence of the polymorphism present in the exon 1 variant at the SR-BI gene locus. J Mol Endocrinol. 2004;32:237–245. 10.1677/jme.0.0320237 [DOI] [PubMed] [Google Scholar]
- 94.Pérez-Martínez P, Pérez-Jiménez F, Ordovás JM, Moreno JA, Marín C, Moreno R, et al. Postprandial lipemia is modified by the presence of the APOB-516C/T polymorphism in a healthy Caucasian population. Lipids. 2007;42:143–150. 10.1007/s11745-007-3027-7 [DOI] [PubMed] [Google Scholar]
- 95.Perez-Martinez P, Yiannakouris N, Lopez-Miranda J, Arnett D, Tsai M, Galan E, et al. Postprandial triacylglycerol metabolism is modified by the presence of genetic variation at the perilipin (PLIN) locus in 2 white populations. Am J Clin Nutr. 2008;87:744–752. 10.1093/ajcn/87.3.744 [DOI] [PubMed] [Google Scholar]
- 96.Perez-Martinez P, Corella D, Shen J, Arnett DK, Yiannakouris N, Tai ES, et al. Association between glucokinase regulatory protein (GCKR) and apolipoprotein A5 (APOA5) gene polymorphisms and triacylglycerol concentrations in fasting, postprandial, and fenofibrate-treated states. Am J Clin Nutr 2009;89:391–399. 10.3945/ajcn.2008.26363 [DOI] [PMC free article] [PubMed] [Google Scholar]
- 97.Perez-Martinez P, Garcia-Rios A, Delgado-Lista J, Delgado-Casado N, Malagon MM, Marin C, et al. A variant near the melanocortin-4 receptor gene regulates postprandial lipid metabolism in a healthy Caucasian population. Br J Nutr. 2011;106:468–471. 10.1017/S0007114511002212 [DOI] [PubMed] [Google Scholar]
- 98.Perez-Martinez P, Perez-Caballero AI, Garcia-Rios A, Yubero-Serrano EM, Camargo A, Gomez-Luna MJ, et al. Effects of rs7903146 variation in the Tcf7l2 gene in the lipid metabolism of three different populations. PLoS One. 2012;7:e43390 10.1371/journal.pone.0043390 [DOI] [PMC free article] [PubMed] [Google Scholar]
- 99.Pimstone SN, Clee SM, Gagné SE, Miao L, Zhang H, Stein EA, et al. A frequently occurring mutation in the lipoprotein lipase gene (Asn291Ser) results in altered postprandial chylomicron triglyceride and retinyl palmitate response in normolipidemic carriers. J Lipid Res. 1996;37:1675–84. [PubMed] [Google Scholar]
- 100.Pollin TI, Damcott CM, Shen H, Ott SH, Shelton J, Horenstein RB, et al. A null mutation in human APOC3 confers a favorable plasma lipid profile and apparent cardioprotection. Science. 2008;322:1702–1705. 10.1126/science.1161524 [DOI] [PMC free article] [PubMed] [Google Scholar]
- 101.Pratley RE, Baier L, Pan DA, Salbe AD, Storlien L, Ravussin E, et al. Effects of an Ala54Thr polymorphism in the intestinal fatty acid–binding protein on responses to dietary fat in humans. J Lipid Res 2000;41:2002–2008 [PubMed] [Google Scholar]
- 102.Regis-Bailly A, Visvikis S, Steinmetz J, Fournier B, Gueguen R, Siest G. Effects of apo B and apo E gene polymorphisms on lipid and apolipoprotein concentrations after a test meal. Clin Chim Acta. 1996;253:127–43. 10.1016/0009-8981(96)06364-4 [DOI] [PubMed] [Google Scholar]
- 103.Reiber I, Mezõ I, Kalina A, Pálos G, Romics L, Császár A. Postprandial triglyceride levels in familial combined hyperlipidemia. The role of apolipoprotein E and lipoprotein lipase polymorphisms. J Nutr Biochem. 2003;14:394–400. 10.1016/s0955-2863(03)00061-5 [DOI] [PubMed] [Google Scholar]
- 104.Reznik Y, Pousse P, Herrou M, Morello R, Mahoudeau J, Drosdowsky MA, et al. Postprandial lipoprotein metabolism in normotriglyceridemic non-insulin-dependent diabetic patients: influence of apolipoprotein E polymorphism. Metabolism. 1996;45:63–71. [DOI] [PubMed] [Google Scholar]
- 105.Reznik Y, Morello R, Pousse P, Mahoudeau J, Fradin S. The effect of age, body mass index, and fasting triglyceride level on postprandial lipemia is dependenton apolipoprotein E polymorphism in subjects with non-insulin-dependent diabetes mellitus. Metabolism. 2002;51:1088–1092. 10.1053/meta.2002.34696 [DOI] [PubMed] [Google Scholar]
- 106.Ribalta J, Halkes CJ, Salazar J, Masana L, Cabezas MC. Additive effects of the PPARgamma, APOE, and FABP-2 genes in increasing daylong triglycerides of normolipidemic women to concentrations comparable to those in men. Clin Chem. 2005;51:864–871. 10.1373/clinchem.2004.044347 [DOI] [PubMed] [Google Scholar]
- 107.Rubin D, Helwig U, Nothnagel M, Lemke N, Schreiber S, Fölsch UR, et al. Postprandial plasma adiponectin decreases after glucose and high fat meal and is independently associated with postprandial triacylglycerols but not with—11388 promoter polymorphism. Br J Nutr. 2008;99:76–82. 10.1017/S0007114507791857 [DOI] [PubMed] [Google Scholar]
- 108.Saleheen D, Natarajan P, Armean IM, Zhao W, Rasheed A, Khetarpal SA, et al. Human knockouts and phenotypic analysis in a cohort with a high rate of consanguinity. Nature. 2017;544:235–239. 10.1038/nature22034 [DOI] [PMC free article] [PubMed] [Google Scholar]
- 109.Schwab US, Agren JJ, Valve R, Hallikainen MA, Sarkkinen ES, Jauhiainen M, et al. The impact of the leucine 7 to proline 7 polymorphism of the neuropeptide Y gene on postprandial lipemia and on the response of serum total and lipoprotein lipids to a reduced fat diet. Eur J Clin Nutr. 2002;56:149–156. 10.1038/sj.ejcn.1601297 [DOI] [PubMed] [Google Scholar]
- 110.Shatwan IM, Minihane AM, Williams CM, Lovegrove JA, Jackson KG, Vimaleswaran KS. Impact of Lipoprotein Lipase Gene Polymorphism, S447X, on Postprandial Triacylglycerol and Glucose Response to Sequential Meal Ingestion. Int J Mol Sci. 2016;17:397 10.3390/ijms17030397 [DOI] [PMC free article] [PubMed] [Google Scholar]
- 111.Shen J, Arnett DK, Pérez-Martínez P, Parnell LD, Lai CQ, Peacock JM, et al. The effect of IL6-174C/G polymorphism on postprandial triglyceride metabolism in the GOLDN studyboxs. J Lipid Res. 2008;49:1839–1845. 10.1194/jlr.P700033-JLR200 [DOI] [PMC free article] [PubMed] [Google Scholar]
- 112.Shen H, Pollin TI, Damcott CM, McLenithan JC, Mitchell BD, Shuldiner AR. Glucokinase regulatory protein gene polymorphism affects postprandial lipemic response in a dietary intervention study. Hum Genet. 2009;126:567–574. 10.1007/s00439-009-0700-3 [DOI] [PMC free article] [PubMed] [Google Scholar]
- 113.Smart MC, Dedoussis G, Yiannakouris N, Grisoni ML, Dror GK, Yannakoulia M, et al. Genetic variation within IL18 is associated with insulin levels, insulin resistance and postprandial measures. Nutr Metab Cardiovasc Dis. 2011;21:476–84. 10.1016/j.numecd.2009.12.004 [DOI] [PMC free article] [PubMed] [Google Scholar]
- 114.Smith JA, Arnett DK, Kelly RJ, Ordovas JM, Sun YV, Hopkins PN, et al. The genetic architecture of fasting plasma triglyceride response to fenofibrate treatment. Eur J Hum Genet. 2008;16:603–13 10.1038/sj.ejhg.5202003 [DOI] [PMC free article] [PubMed] [Google Scholar]
- 115.St-Jean M, Boudreau F, Carpentier AC, Hivert MF. HNF1α defect influences post-prandial lipid regulation. PLoS One. 2017;12:e0177110 10.1371/journal.pone.0177110 [DOI] [PMC free article] [PubMed] [Google Scholar]
- 116.Tahvanainen E, Molin M, Vainio S, Tiret L, Nicaud V, Farinaro E, et al. Intestinal fatty acid binding protein polymorphism at codon 54 is not associated with postprandial responses to fat and glucose tolerance tests in healthy young Europeans. Results from EARS II participants. Atherosclerosis. 2000;152:317–25. 10.1016/s0021-9150(99)00488-8 [DOI] [PubMed] [Google Scholar]
- 117.Talmud PJ, Hall S, Holleran S, Ramakrishnan R, Ginsberg HN, Humphries SE. LPL promoter -93T/G transition influences fasting and postprandial plasma triglycerides response in African-Americans and Hispanics. J Lipid Res. 1998;39:1189–1196. [PubMed] [Google Scholar]
- 118.Talmud PJ, Smart M, Presswood E, Cooper JA, Nicaud V, Drenos F, et al. ANGPTL4 E40K and T266M: effects on plasma triglyceride and HDL levels, postprandial responses, and CHD risk. Arterioscler Thromb Vasc Biol. 2008;28:2319–2325. 10.1161/ATVBAHA.108.176917 [DOI] [PubMed] [Google Scholar]
- 119.Tanaka T, Delgado-Lista J, Lopez-Miranda J, Perez-Jimenez F, Marin C, Perez-Martinez P, et al. Scavenger receptor class B type I (SCARB1) c.1119C>T polymorphism affects postprandial triglyceride metabolism in men. J Nutr. 2007. March;137(3):578–82. 10.1093/jn/137.3.578 [DOI] [PubMed] [Google Scholar]
- 120.Tanaka T, Ordovas JM, Delgado-Lista J, Perez-Jimenez F, Marin C, Perez-Martinez P, et al. Peroxisome proliferator-activated receptor alpha polymorphisms and postprandial lipemia in healthy men. J Lipid Res. 2007. June;48(6):1402–8. 10.1194/jlr.M700066-JLR200 [DOI] [PubMed] [Google Scholar]
- 121.Tilly-Kiesi M, Lichtenstein AH, Rintarahko J, Taskinen MR. Postprandial responses of plasma lipids and lipoproteins in subjects with apoA-I(Lys107—>0). Atherosclerosis. 1998;137:37–47. 10.1016/s0021-9150(97)00250-5 [DOI] [PubMed] [Google Scholar]
- 122.Vansant G, Mertens A, Muls E. Determinants of postprandial lipemia in obese women. Int J Obes Relat Metab Disord. 1999;23 Suppl 1:14–21. [DOI] [PubMed] [Google Scholar]
- 123.van 't Hooft FM, Ruotolo G, Boquist S, de Faire U, Eggertsen G, Hamsten A. Human evidence that the apolipoprotein a-II gene is implicated in visceral fat accumulation and metabolism of triglyceride-rich lipoproteins. Circulation. 2001;104:1223–8. 10.1161/hc3601.095709 [DOI] [PubMed] [Google Scholar]
- 124.Vimaleswaran KS, Minihane AM, Li Y, Gill R, Lovegrove JA, Williams CM, et al. The APOB insertion/deletion polymorphism (rs17240441) influences postprandial lipaemia in healthy adults. Nutr Metab (Lond). 2015;12:7. [DOI] [PMC free article] [PubMed] [Google Scholar]
- 125.Warodomwichit D, Arnett DK, Kabagambe EK, Tsai MY, Hixson JE, Straka RJ, et al. Polyunsaturated fatty acids modulate the effect of TCF7L2 gene variants on postprandial lipemia. J Nutr. 2009;139:439–46 10.3945/jn.108.096461 [DOI] [PMC free article] [PubMed] [Google Scholar]
- 126.Waterworth DM, Ribalta J, Nicaud V, Dallongeville J, Humphries SE, Talmud P. ApoCIII gene variants modulate postprandial response to both glucose and fat tolerance tests. Circulation. 1999;99:1872–7. 10.1161/01.cir.99.14.1872 [DOI] [PubMed] [Google Scholar]
- 127.Weintraub MS, Eisenberg S, Breslow JL. Dietary fat clearance in normal subjects is regulated by genetic variation in apolipoprotein E. J Clin Invest. 1987. December;80(6):1571–7. 10.1172/JCI113243 [DOI] [PMC free article] [PubMed] [Google Scholar]
- 128.Wojczynski MK, Parnell LD, Pollin TI, Lai CQ, Feitosa MF, O'Connell JR, et al. Genome-wide association study of triglyceride response to a high-fat meal among participants of the NHLBI Genetics of Lipid Lowering Drugs and Diet Network (GOLDN). Metabolism 2015;64:1359–71. 10.1016/j.metabol.2015.07.001 [DOI] [PMC free article] [PubMed] [Google Scholar]
- 129.Wolever TM, Hegele RA, Connelly PW, Ransom TP, Story JA, Furumoto EJ, et al. Long-term effect of soluble-fiber foods on postprandial fat metabolism in dyslipidemic subjects with apo E3 and apo E4 genotypes. Am J Clin Nutr. 1997;66:584–90. 10.1093/ajcn/66.3.584 [DOI] [PubMed] [Google Scholar]
- 130.Woo SK, Kang HS. The apolipoprotein CIII T2854G variants are associated with postprandial triacylglycerol concentrations in normolipidemic Korean men. J Hum Genet 2003;48:551–5. 10.1007/s10038-003-0074-7 [DOI] [PubMed] [Google Scholar]
- 131.Zemánková K, Dembovská R, Piťha J, Kovář J. Glucose added to a fat load suppresses the postprandial triglyceridemia response in carriers of the -1131C and 56G variants of the APOA5 gene. Physiol Res. 2017;66:859–866. 10.33549/physiolres.933552 [DOI] [PubMed] [Google Scholar]
- 132.Guardiola M, Ribalta J. Update on APOA5 genetics: toward a better understanding of its physiological impact. Curr Atheroscler Rep 2017;19:30 10.1007/s11883-017-0665-y [DOI] [PubMed] [Google Scholar]
- 133.Garelnabi M, Lor K, Jin J, Chai F, Santanam N. The paradox of ApoA5 modulation of triglycerides: evidence from clinical and basic research. Clin Biochem. 2013;46(1–2):12–9. 10.1016/j.clinbiochem.2012.09.007 [DOI] [PMC free article] [PubMed] [Google Scholar]
- 134.Xu C, Bai R, Zhang D, Li Z, Zhu H, Lai M, et al. Effects of APOA5 -1131T>C (rs662799) on fasting plasma lipids and risk of metabolic syndrome: evidence from a case-control study in China and a meta-analysis. PLoS One. 2013;8:e56216 10.1371/journal.pone.0056216 [DOI] [PMC free article] [PubMed] [Google Scholar]
- 135.Jackson KG, Poppitt SD, Minihane AM. Postprandial lipemia and cardiovascular disease risk: Interrelationships between dietary, physiological and genetic determinants. Atherosclerosis. 2012;220:22–33. 10.1016/j.atherosclerosis.2011.08.012 [DOI] [PubMed] [Google Scholar]
- 136.Jackson KG, Clarke DT, Murray P, Lovegrove JA, O'Malley B, Minihane AM, et al. Introduction to the DISRUPT postprandial database: subjects, studies and methodologies. Genes Nutr. 2010;5:39–48. 10.1007/s12263-009-0149-y [DOI] [PMC free article] [PubMed] [Google Scholar]
- 137.Staels B, Dallongeville J, Auwerx J, Schoonjans K, Leitersdorf E, Fruchart JC. Mechanism of action of fibrates on lipid and lipoprotein metabolism. Circulation 1998;98:2088–93. 10.1161/01.cir.98.19.2088 [DOI] [PubMed] [Google Scholar]
- 138.Degoma EM, Rivera G, Lilly SM, Usman MH, Mohler ER 3rd. Personalized vascular medicine: individualizing drug therapy. Vasc Med. 2011;16:391–404. 10.1177/1358863X11422251 [DOI] [PMC free article] [PubMed] [Google Scholar]
- 139.Parnell LD, Blokker BA, Dashti HS, Nesbeth PD, Cooper BE, Ma Y, et al. CardioGxE, a catalog of gene-environment interactions for cardiometabolic traits. BioData Min.;7:21 10.1186/1756-0381-7-21 [DOI] [PMC free article] [PubMed] [Google Scholar]
- 140.Parnell LD, Ordovas JM, Lai CQ. Environmental and epigenetic regulation of postprandial lipemia. Curr Opin Lipidol. 2018;29:30–35. 10.1097/MOL.0000000000000469 [DOI] [PubMed] [Google Scholar]
- 141.Williams PT. Quantile-specific heritability may account for gene-environment interactions involving coffee consumption. Behavorial Genetics 2020 (in press). [DOI] [PMC free article] [PubMed] [Google Scholar]
- 142.Williams PT. Evidence that obesity risk factor potencies are weight dependent, a phenomenon that may explain accelerated weight gain in western societies. PLoS One. 2011;6:e27657 10.1371/journal.pone.0027657 [DOI] [PMC free article] [PubMed] [Google Scholar]
Associated Data
This section collects any data citations, data availability statements, or supplementary materials included in this article.
Supplementary Materials
(DOCX)
(XLSX)
Data Availability Statement
All relevant data are within the manuscript and its Supporting Information files.


