

Abstract
We have previously studied the role of β1 integrin and some of its different alpha partners relevant to Erythropoiesis. Although clear and consistent answers regarding the role of α4β1 (VLA-4) were evident, the role of its companion integrin α5β1 (VLA-5) was clouded by inconsistent outcomes in all prior publications. Furthermore, the functional consequences of integrin deficiencies only in microenvironmental cells (ME) supporting erythroid cell expansion and maturation post stress have never been explored. In the present studies we have created several additional mouse models aiming to address unanswered questions regarding functional consequences of single or combined integrin deficiencies in erythroid cells or only in ME supporting cells. Our novel and expansive data solidified the intrinsic requirement of both α4 and α5 integrins in erythroid cells for their proliferative expansion and maturation in response to stress; α5 integrin alone, deleted either early in all hematopoietic cells or only in erythroid cells has only a redundant role in proliferative expansion and is dispensable for erythroid maturation. By contrast, α4 integrin, on its own, exerts a dominant effect on timely and optimal erythroid maturation. Deficiency of both α4 and α5 integrins in ME cells including macrophages does not negatively influence stress response by normal erythroid cells, in great contrast to the effect of ME cells deficient in all β1 integrins. Collectively the present data offer a deeper insight on the coordination of different β1 integrin functional activities in erythroid cells or in ME cells for optimal erythroid stress response.
Keywords: β1 integrin, macrophages, erythroblasts, knockout mice, integrin alpha5, integrin alpha4, microenvironmental cells
INTRODUCTION
Beta-1 integrins are the largest family of integrin heterodimers (24 members) with wide cell expression in both hematopoietic and non-hematopoietic cells. Their main function is to integrate communication of cells with their ME, through matrix-binding or cell-cell interactions. There is a diverse cell type-specificity of integrin expression and this together with the integrin’s ability to assemble variable signaling complexes provides multiple layers of signaling specificity that is cell type dependent.
In our prior studies, we have employed animal models with deficiency of all β1-dependent integrins, or only of α4β1 in all hematopoietic cells1,2, as well as models deficient specifically in α4 or α5 integrin only in erythroid cells3. Functional phenotypes of these models uncovered distinct roles of the relevant integrins as instrumental players in erythroid stress responses4.
However, several of the conclusions, especially regarding the role of α5 integrin, were somewhat unexpected5 and only added to inconsistences previously noted with this integrin in several other settings6–10. Furthermore, the contribution of microenvironmental cells (ME), i.e., macrophages and/or stromal/endothelial cells, also deficient in the same integrins, to the overall stress response has not been studied in these settings.
To clarify several of the unanswered or controversial issues, we generated additional relevant murine models. In the present studies, the role of α5 integrin when deleted either alone or together with α4β1 integrin in all hematopoietic cells compared to only in erythroid cells was explored. Further, ME contributions were studied in animals with normal Macrophages but mutant erythroid cells, or under settings where normal erythroid cells and normal Macrophages were present within an otherwise integrin deficient ME (i.e., in deficient host reconstituted with normal Hematopoietic cells). In addition, whether a previously advocated crosstalk among erythroid cells was influencing the response of chimeric animals partially reconstituted with normal cells was examined.
In aggregate, our data significantly expand prior biological knowledge on the role of integrins, particularly on stress erythropoiesis. In the present communication, through the use of multiple mouse models, we have clarified the intrinsic functional contribution of individual α4 or α5 integrins vs. their combined requirement for stress erythropoiesis. Further, we have uncovered a previously unrecognized role of β1integrins in ME cells, in addition to α4+α5, for their support of stress erythropoiesis.
MATERIAL AND METHODS
Mice and treatments:
To obtain mice with deletion of α4 and α5 integrins in all hematopoietic cells, we first bred α4f/f mice1 with α5f/f mice11, the resulting α4f/f,α5f/f mice were bred with Mx-Cre+ transgenics and Cre-positive animals were treated with poly(I:C) (two ip injections of 6 mg/kg body weight one day apart) to induce gene ablation. Mice doubly deficient in α4 and β1 integrins were described elsewhere4. To obtain mice with deletion of β1 integrins or double deletion of α4 and α5 integrins selectively in erythroid cells, we bred β1f/f3 or α4f/f,α5f/f mice with EpoR-Cre mice12.
PHZ-treatment.
To induce acute anemia, mice were injected with phenylhydrazine (PHZ; Sigma-Aldrich) at 60 mg/kg intraperitoneally on 2 consecutive days or with the single injection at 100 mg/kg. These two regimens differ in kinetics of reaching the peak response in normal mice, i.e., by day 4 with a single injection vs. days 5–6 with 2 injections. Mice in our different experiments irrespective of their injection schemes were sacrificed for analysis from day 4 to day 8 post injection (as indicated in the figure legends).
Transplantation:
wild-type (WT) or ko recipients were lethally (1150 cGy) irradiated and received 5 × 10⁶ of either WT (control) or integrin ko BM cells. In some experiment ko recipient mice received 5 × 10⁶ normal GFP+ BM cells following sub-lethal (400 cGy) irradiation. After BM reconstitution, mice were challenged with PHZ. All experiments with mice were approved by the University of Washington Institutional Animal Care and Use Committee.
Peripheral blood (PB) evaluation, Fluorescence Activated Cell Sorting (FACS) analysis, progenitor assays (CFU-C), and ROS measurement were described previously3,4.
Caspase 3 activation measurement.
After staining with surface marker antibodies (Ter119 and CD71), cells were fixed in 4% buffered formaldehyde (20 min at 4°C), washed and permeabilized using Perm/wash reagent (BD Biosciences). Permeabilized cells were stained with FITC-conjugated rabbit anti-active caspase 3 antibody (clone C92–605) for 30 min at room temperature, washed and subjected to FACS analysis.
Statistical analysis.
Data shown are means ± standard error of mean (sem). Statistical analyses were performed using a Student t test and p values of < 0.05 were considered significant.
RNA seq analysis.
For the analysis erythroblasts from control and [α4+α5] ko mice were isolated from the spleen on day 3.5 and on day 8, respectively. To obtain erythroblasts, total splenic cell suspension was subjected to RBC lysis and after washing non-lysed cells were put through FBS to get rid of dead cells. Lineage-positive (B220, CD3, Mac1, Gr1) cells were removed using magnetic beads. After labeling the resulting cells with Ter119 antibody, Ter119– and Ter119+ fractions were separated by magnetic column. Some of these fractionated cells were analyzed for expression of CD71, Ter119, c-Kit and α4 by FACS, some were used in cytospins to analyze their morphology after Wright Giemsa staining. The remaining cell fractions were used to isolate total RNA by Trizol method according to the manufacturer’s (Ambion) instructions. The resultant RNA was used for RNA seq analysis in Fred HUTCH core facility.
RNA-sequencing.
The Illumina TruSeq Stranded mRNA kit was used to prepare RNA-seq libraries. Samples were barcoded, pooled, and sequenced on the Illumina Hiseq 2500 in “Rapid Run” mode using a paired-end 50bp strategy. Image analysis and base calling were performed with Illumina’s Real Time Analysis v1.18 software, followed by “demultiplexing” of indexed reads and generation of FASTQ files using Illumina’s bcl2fastq Conversion Software v1.8.4. Read pairs passing standard Illumina quality filters were aligned with STAR2 version 2.5.2a against the mouse mm10 reference. Gene-level counts, using UCSC mm10 gene annotations, were generated from the resulting BAM alignment files with the featureCount software from the Subread package version 1.6.0.
Differential Gene Expression analysis.
Differential expression (DE) analysis was performed using the package DESeq2 (REF). Statistically significant differentially expressed genes were selected based on the Benjamini-Hochberg corrected p-values (adjusted p-value < 0.01), the absolute shrunken log2 fold changes (absolute l2fc > 1), and mean expression (mean gene counts > 30). Gene sets were compiled from gene expression sets retrieved from MGI GXD (Mouse Genome Informatics, Gene Expression Database. http://www.informatics.jax.org/gxd) and from gene ontology annotations retrieved from PANTHER database available at http://pantherdb.org. Cell type enrichment analysis was performed with Enrichr (http://amp.pharm.mssm.edu/Enrichr/) using the Mouse Gene Atlas database. Only terms with adjusted p-value < 0.05 were considered.
RESULTS
A. Studies in mice deficient in α5 integrin in all hematopoietic cells
We have previously documented that α5 integrin deficiency specifically in erythroid cells did not impair erythropoiesis at homeostasis or after stress5. To test whether absence of α5 integrin in all stem/HSPC cells had any impact downstream in erythroid cells, we made α5 integrin knockouts by generating Mx-Cre+/α5f/f mice and treating them with poly(I:C) (these mice will be referred to subsequently as [α5]ko). Gene ablation in all hematopoietic cells four weeks after treatment was highly efficient (Fig 1A,upper panel). At homeostasis, [α5]ko mice did not show any abnormalities in peripheral blood parameters, including hematocrits (HCTs) and circulating cells of different lineages (white blood cells, red blood cells and platelets), as well as circulating progenitor cells (Fig. 1B). Steady state erythropoiesis in the BM was also normal (Fig. 1 C, SS). Hematologic parameters and ablation levels were re-evaluated following phenyl hydrazine (PHZ) challenge. The proportion of α5 integrin-negative erythroid cells in BM and spleen in [α5]ko mice did not change from that at steady state, whereas some increase of α5 integrin expression level in differentiating erythroid cells was seen in control mice (Fig. 1A, lower panel). The overall erythroid response of [α5]ko mice to the PHZ challenge was similar to their controls; BM cellularity and erythroblast numbers, as well as spleen weight (not shown), total cellularity and the number of erythroblasts in the spleen were no different between control and ko mice (Fig. 1 C). In all respects the [α5]ko mice, in which ablation of α5 integrins occurs early on at the progenitor level, were similar to previously reported EpoR-Cre+α5f/f mice in which α5 integrin deletion starts at about the proerythroblast level: animals from both mouse models were able to mount a normal response to PHZ. One major relevant difference between these two models is that in the former all hematopoietic cells including macrophages lack α5 integrins, whereas in the latter macrophages (and other non-erythroid cell) retain α5 integrins on their surface. Despite these differences, the observed normal response of α5 ko mice to PHZ suggests that α5 integrin on erythroid cells, or in erythroid cells and their progenitors, as well as in macrophages (MFs), is dispensable for optimal erythropoietic response to stress.
Figure 1. [α5]ko mice display a normal phenotype at steady state and post stress.
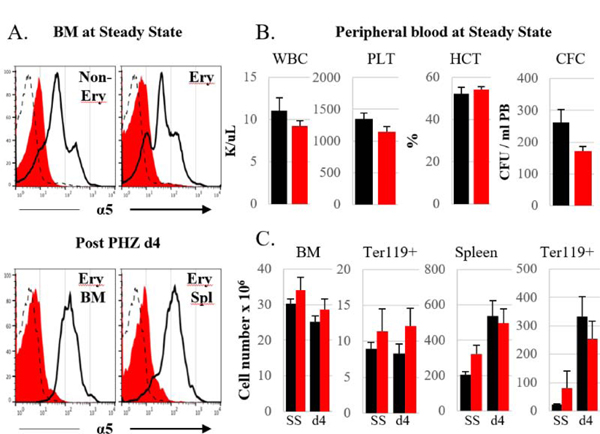
A. Integrin α5 expression in erythroid and non-erythroid cells of control (black line) and [α5]ko (red filled histogram) mice at steady state, SS, (upper panel) and at day 4 post PHZ challenge (single injection of 100 mg PHZ/kg body weight) (lower panel). Representative samples for each group are shown. Dashed line represents an isotype control. B. Peripheral blood at steady state: white blood cells (WBC) and platelet (PLT) counts, hematocrit (HCT) levels and numbers of circulating progenitors (CFC) are shown. C. Total cellularity and number of erythroblasts (nucleated Ter119+) in BM (per femur) and spleen at steady state and at day 4 post PHZ challenge. Control mice, black bars, n=6; [α5]ko mice, red bars, n=6.
Studies in mice with α4+α5 deletion in all hematopoietic cells
To create mice with gene ablation of both, α4 and α5, integrins in all hematopoietic cells we bred our α4f/f and 5f/f mice with Mx-Cre transgenics and treated the Mx-Cre+ α4f/f,α5f/f mice with poly(I:C). (These mice will subsequently be referred as [α4+α5]ko mice). When levels of integrin expression were assessed four weeks after poly(I:C) treatment, among all nucleated (CD45+) cells in BM and spleen only a small proportion of cells were positive for α4 or α5 integrins and all positive cells had low mean fluorescence intensity (MFI) levels (Suppl. Fig. 1). Similar to total nucleated cells, up to 95 % of erythroblasts in the BM were negative for alpha 4 and alpha 5 integrins (Fig. 2A). Further analysis of integrin expression in erythroid cells at various stages of their maturation confirmed efficient ablation of α4 and α5 integrins at every stage tested (data not shown).
Figure 2. [α4+α5]ko mice at homeostasis.
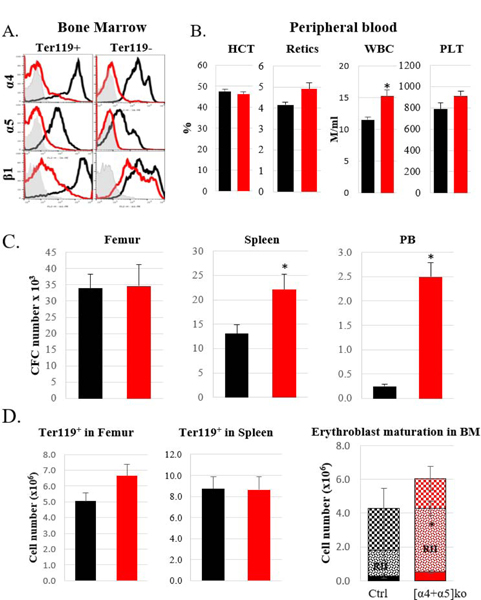
A. Expression of α4, α5, and β1 integrins in erythroblasts and non-erythroid nucleated cells in the bone marrow in control (black line) and ko (red line) mice. Representative samples are shown. Gray histogram represents an isotype control. B. Peripheral blood analysis: Hematocrit (HCT) and reticulocyte (retics) levels, white blood cell (WBC) and platelet (PLT) counts in control (n=5) and ko (n=8) mice. C. Progenitor levels (CFC) in the bone marrow (per femur), spleen and peripheral blood in control (n=10) and ko (n=10) mice. D. Erythroblast (nucleated Ter119+) numbers in BM (per femur) and spleen (left and middle panels) and maturation profile (RI, RII and RIII, see Suppl. Fig. 2) of erythroblasts in the BM (right panel) in control (n=8) and ko (n=7) mice. Control mice, black bars, ko mice, red bars. Asterisk, *, represents a significant difference over control, p<0.05
Since VLA4 (α4β1) and VLA5 (α5β1) are essential integrins in erythroid and non-erythroid cells alike, we also analyzed β1 integrin expression both in all nucleated cells and specifically in erythroid cells in control and [α4+α5]ko mice. Among all nucleated cells, expression of β1 integrin was seen in the majority of them, although at lower intensity (Suppl. Fig. 1). In contrast to total nucleated cells, in erythroblasts deletion of α4 and α5, the two major erythroid integrins, resulted in a corresponding decrease of β1 integrin levels (Fig. 2A). At steady state, significant increase in WBC numbers and circulating progenitors was detected in peripheral blood and consequently in the spleens of [α4+α5]ko mice (Fig. 2B, C). This finding likely reflects the dominant role of α4 integrin in progenitor cell retention within the BM, as was previously described by us and always seen when α4 integrin alone was deleted 4,5. No other abnormalities at steady state erythropoiesis were noted: hematocrit levels (Fig. 2B), the levels of BM progenitors (Fig. 2C), as well as the number of erythroblasts in the BM and their maturation profile (Fig. 2D) were similar in control and knockout mice. However, the normal erythroblast maturation sequence in BM was modestly distorted, as an increase in more immature cells (RII) compared to mature ones (RIII) was present, compatible with a left shift in erythroid maturation (Fig. 2D, right panel).
Stress erythropoiesis in the [α4+α5]ko mice was studied following PHZ-induced acute anemia. Assessment of integrin expression in PHZ-challenged mice, as well as erythroblast numbers and their maturation profile in both BM and spleen and HCT restoration post stress were evaluated.
In PHZ-challenged [α4+α5]ko mice, spleen size (not shown), cellularity and integrin expression did not significantly change from steady state, whereas in controls total spleen cellularity increased over 6 times compared to steady state (Fig. 3A,B). The inability of the spleen to support erythropoietic stress response was reflected in dramatic decrease in hematocrit levels in ablated mice which comprised only a half of control value (38.9±2.1% in control and 19.1±1.5% in ko mice, p<0.001) (Fig. 3C). Although accumulation of total progenitors and stress BFU-E in the spleen of [α4+α5]kos was delayed, by day 6 similar to controls levels were observed (Fig. 3D, left and middle panels). Nevertheless, despite the upregulation in progenitor levels by day 6, their maturation profile was grossly aberrant. The number of pro-erythroblasts was drastically (16-fold) decreased and led to progressively diminishing numbers of later erythroblasts in the spleens of ko mice (Fig. 3D, right panel). In contrast to the spleen however, in BM, the progenitor levels and erythroblast numbers were similar in ko and control mice (Fig. 3E). It needs to be pointed that although the total number of erythroblasts (RI+RII+RIII) in the BM of control and ko mice was similar, in the latter the maturation profile of integrin-deleted erythroblasts showed diminishing numbers of the more mature RIII population (Fig. 3E, right panel). At the same time, as expected, circulating progenitors in ko mice was almost 10-fold higher than in controls both, at day four and six following PHZ challenge (Fig. 3F).
Figure 3. Stress erythropoietic response is impaired in [α4+α5]ko mice.
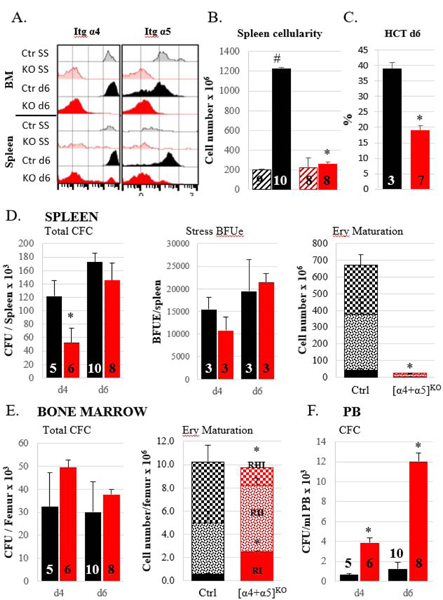
A. Integrin expression levels in BM and spleen in control (black histograms) and ko (red histograms) mice at steady state (SS, lighter shade) and at day 6 (d6, darker shade) post PHZ challenge. Representative samples are shown. B. Total nucleated cell number in spleen of control and ko mice at steady state (hatched bars) and at day 6 post PHZ (solid bars). C. Hematocrit level post PHZ d6. D. Splenic response to PHZ: total progenitor numbers at day 4 and day 6 post PHZ, left panel; stress BFUe at day4 and day 6 post PHZ, middle panel; numbers of erythroblasts at different maturation stages at day 6 post PHZ. E. Bone marrow response to PHZ: total progenitor numbers at day 4 and day 6 post PHZ, left panel; numbers of erythroblasts at different maturation stages at day 6 post PHZ. F. Circulating progenitor numbers at d4 and d6 post PHZ. Control mice, black bars; [α4+α5]ko mice, red bars. Asterisk, *, indicates the significant difference over control, p<0.05, the hash symbol, #, indicates the significant difference between d0 and d6, p<0.05. Number of mice per group is indicated inside the corresponding bar.
Collectively the data suggest that although erythroid progenitors can recover in the absence of both α4+α5 integrins, further erythroid expansion and terminal differentiation is greatly impaired, especially in spleen.
In their splenic responses to stress, our [α4+α5]ko mice with combined deletion of α4 and α5 integrins were similar to previously described Mx-Cre+[α4f/f+β1f/f] mice (designated as [α4+β1]ko; in these mice, surface α4 expression with alternate partners is not possible, in contrast to only β1 deletion4). This may not be surprising, as the latter mice also lack VLA4 and VLA5 in their erythroid cells. However, [α4+α5] integrin deficient cells responded better within BM environment than their counterparts deficient in all β1 integrins (Fig. 4A). Mechanistically we have also shown previously that mice lacking all β1 integrins failed to counteract the increased reactive oxygen species (ROS) levels in erythroid cells post PHZ challenge in both BM and spleen resulting in increased apoptosis and failure to accumulate mature erythroid cells4. By exploring ROS levels in [α4+α5]ko erythroblasts we observed their increased production mainly in the spleen (Fig. 4B). The functional sequelae of increased ROS i.e., increased apoptosis and/or proliferative impairment, were also assessed. Activated Caspase 3 (Fig. 4C) as well as a significant decrease in expression of anti-apoptotic Bcl-xL and significant increase in proapoptotic Noxa gene together with an impaired proliferative ability of [α4+α5]ko erythroblasts in the spleen were additional corroborating findings (Suppl. Fig. 3).
Figure 4. ROS production is increased in the spleens of [α4+α5]ko mice.
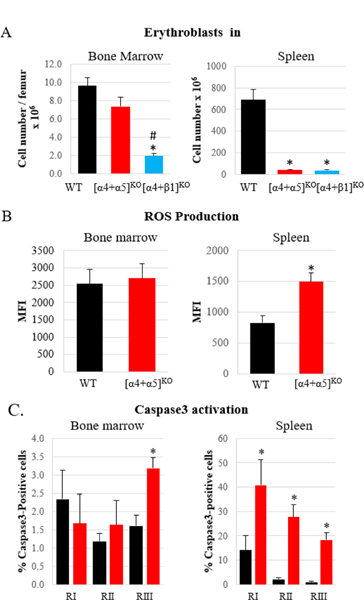
A. Comparison of BM and splenic responses to erythroid stress in [α4+α5]ko and [α4+β1]ko mice. Number of erythroblasts (nucleated Ter119+ cells) in BM and spleen in control (n=5), [α4+α5]ko (n=3) and [α4+β1]ko (n=6) mice was determined on day6 post PHZ challenge B. ROS production in early erythroblasts (RI & RII) in BM and spleen on day6 post PHZ challenge in control (n=6) and [α4+α5]ko (n=6) mice. C. Activated Caspase3 expression in erythroblasts of various stages of maturation in BM and spleen in control (n=8) and [α4+α5]ko (n=8) mice. Control mice, black bars; [α4+α5]ko mice, red bars; [α4+β1]ko mice, blue bars. Asterisk, *, indicates a significant difference over controls, p<0.05; hash symbol, #, represents a significant difference between ko mice, p<0.05.
ME support for stress erythropoiesis
To determine whether only erythroblast-intrinsic or additional ME factors (especially in spleen), contributed to the inability of [α4+α5]ko mice to respond to the PHZ challenge, we first compared responses to PHZ in wild type (WT) recipients reconstituted with either [α4+α5]ko, or [α4+β1]ko BM cells.
WT recipient mice reconstituted with donor ko cells of either type, were unable to mount a spleen response to PHZ, similarly to their primary ko counterparts (Fig. 5A). The customary interpretation of these outcomes is that an intrinsic defect in erythroid cells is at fault. However, when donor [α4+α5]ko or [α4+ β1]ko hematopoietic cells are used, after reconstitution the majority of recipient BM and spleen MFs are of donor origin and thus are deficient in their respective integrins (Fig 5B). These deficient MFs in transplanted animals did not expand post stress, similarly to the ko MFs in primary ablated mice (Fig. 5C). Therefore, in order to test whether integrin-deficient MFs, through their decreased number and/or function, contributed to the overall negative response of integrin-deficient erythroid cells, we intended to use a mouse model in which only erythroid cells and not MFs were integrin-deficient, namely EpoR-Cre α4f/f,α5f/f and EpoR-Cre β1f/f mice. However, our efforts to generate live progeny with efficient ablation of both α4 and α5 integrins were not successful. Timed pregnancy studies confirmed the embryonic (past e12.5) lethality in these. Fetal livers were developed only in partial ablation of integrin genes, but ineffective fetal erythropoiesis was confirmed by studying fetal liver erythroid cells. An unprecedented presence of definitive immature erythroblasts but not mature enucleated cells in circulation together with embryonic erythroblasts (Suppl. Fig. 4) was observed in these embryos. Such a peripheral blood picture was compatible with integrin deletion as being responsible for the release of definitive erythroblasts in circulation. We decided to study the adult progeny obtained with partial integrin deletion. At steady state in EpoRCre+β1f/f mice, as expected, all MFs expressed normal levels of β1 integrin, while a substantial proportion of erythroblasts was integrin-deficient (Fig. 6A). However, after PHZ challenge, primarily erythroblasts with no deletion of β1 integrins predominated in BM and especially in spleen (Fig. 6A,right). As a result, the overall response was comparable to controls. These results imply that integrin deficient erythroid cells, even in presence of normal MFs have a profound proliferative and/or survival disadvantage compared to normal erythroid cells.
Figure 5. Comparison of primary ablated and transplanted KO mice in response to PHZ.
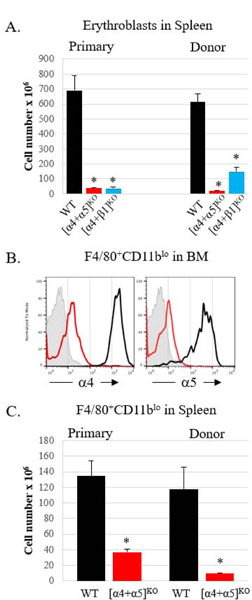
A. Non-transplanted (primary) mice and lethally irradiated WT recipients reconstituted with WT or KO BM cells were treated with PHZ and erythroblasts (nucleated Ter119+ cells) in the spleens were enumerated on day 6 post PHZ treatment. Primary mice: control, n=5, [α4+α5]ko, n=3; [α4+β1]ko, n=6; Transplanted mice: control, n=5, [α4+α5]ko, n=3, [α4+β1]ko, n=6. B. Integrin expression in BM macrophages in transplanted control (black line) and [α4+α5]ko (red line) mice on d6 post PHZ (one representative sample from each group is shown; isotype control is represented by a grey histogram). C. Enumeration of splenic macrophages (F4/80+CD11blo) in primary and transplanted mice on day 6 post PHZ. Primary mice: control, n=4, [α4+α5]ko, n=5, transplanted mice: control, n=5, [α4+α5]ko, n=3. For all panels: Asterisk * indicated the significant difference, p<0.05, between KO and control. Control mice, black bars, [α4+α5]ko, red bars, [α4+β1]ko, blue bars.
Figure 6. Presence of normal MFs does not preclude severe proliferative disadvantage of β1 integrin-deficient erythroblasts.
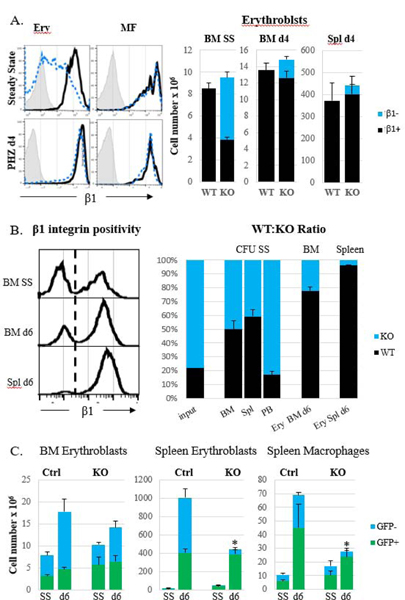
A. EpoR-Cre+β1f/f mice with partial β1 integrin ablation in erythroid cells before and after PHZ challenge. Expression of β1 integrin in KO erythroblasts and KO MFs in BM (left panel upper row) and in the spleen (left panel, bottom row) and erythroblast (nucleated Ter119+) numbers in BM and spleen (right panel) of control (n=12) and KO (n=6) mice are shown. B. Lethally irradiated WT recipients after reconstitution with a 20:80 mixture of WT : [α4+β1]ko BM cells were subjected to PHZ-induced stress. Expression of β1 integrin (left panel) and percentage of WT and β1 KO cells were determined at steady state (n=3) and at day 6 post PHZ challenge (n=3) in progenitors (CFU) and erythroblasts in BM and spleen (right panel). C. Recipient [α4+β1]ko mice received normal GFP+ BM cells following sub-lethal irradiation and one month later were subjected to the PHZ challenge. WT mice transplanted with GFP+ BM cells served as controls. Erythroblast and MF numbers were assessed before (controls, n=2, KO, n=4) and on day 6 (controls, n=4, KO, n=5) post stress. Control cells, black bars in A and B and green bars in C, KO cells, blue bars. Asterisk, *, represents a significant difference from control, p<0.05.
The above data in mice with partial deletion of integrins in erythroid cells were further solidified by experiments in which normal recipient mice were reconstituted with a mixture of normal and integrin deficient cells. Since β1-deficient cells have impaired homing ability to obtain a near 50:50 reconstitution, we used a ratio of 80:20 (β1-deficient : β1-sufficient) in the input cells for the BM transplant. After reconstitution, the ratio in WT : β1ko cells was around 50:50 when assessed in progenitors and in total BM and spleen cells (data not shown), while in circulating progenitors the input ratio was preserved (Fig. 6B). When mice were challenged with PHZ, the ratio for erythroid cells changed: the wild type cells after the challenge constituted up to 80% in the BM and 96% in the spleen.
An alternative model of co-existence of normal and integrin-deficient erythroblasts and MFs was one in which [α4+β1] integrin-deficient recipients after their partial (400 Rads) myeloablation received normal green fluorescent protein+ (GFP) cells (Fig. 6C showing the proportion of WT input cells before and after reconstitution. WT recipients receiving GFP+ BM cells served as controls.) After PHZ challenge, the total number of erythroblasts in the BM was not significantly different between control and ko recipient mice, although there was an increased contribution of normal cells (Fig. 6B). However, in the spleen only integrin-sufficient erythroid cells and MFs expanded with virtual obliteration of integrin deficient cells in ko recipients. Nevertheless, in these recipient mice, the total numbers within the spleen ME were subnormal and the spleen size was significantly smaller than control spleens (data not shown), suggesting a negative impact for β1ko spleen ME.
In order to specifically test whether other integrin-deficient ME cells besides MFs also play a role in the inability of primary ko mice to respond to erythroid stress, we performed reciprocal transplantation experiments in which normal hematopoietic cells reconstituted lethally irradiated [α4+α5] or [α4+β1] integrin-deficient mice. Whereas these mice were normal at homeostasis (data not shown), after PHZ challenge some unexpected results were obtained (Fig. 7). When integrin-deficient cells of either type were used as donor cells, splenic response to PHZ was profoundly impaired: spleens were small in size, erythroblasts did not expand in the spleens and HCT levels were low (Fig. 7A, B and C). A dramatic difference between the two types of ko mice was seen when they were used as recipients of the WT cells. While [α4+β1]ko recipients, similarly to their primary donor counterparts, showed defective stress erythropoiesis in the spleen, [α4+α5]ko recipients were able to mount an adequate response to PHZ. It needs to be pointed out that in both types of integrin-deficient recipients, normal numbers of erythroblasts were detected in the BM (Fig. 7D), which may explain good HCT levels in these ko recipients.
Figure 7. Two-way BM transplantations.
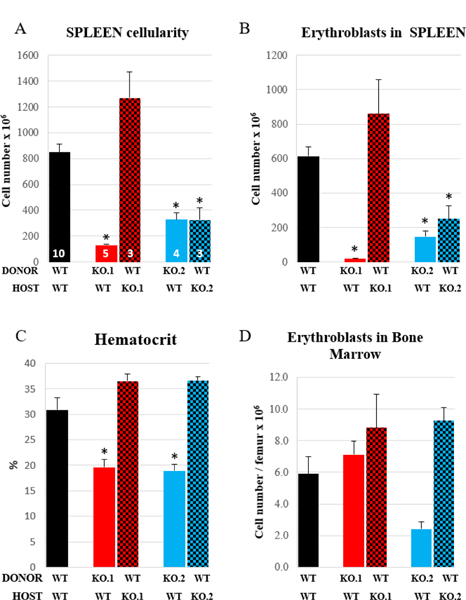
Control (black bars) or KO mice ([α4+α5]ko, red bars; [α4+β1]ko, blue bars) served as donors (solid bars) or recipients (checked bars) in transplantation experiments following complete myeloablation (1150 cGy). Reconstituted mice were subjected to PHZ challenge and spleen cellularity (A), and erythroblast numbers in spleen (B) and BM (D), as well as hematocrit levels (C) were assessed on day 6 post PHZ. Number of mice per group is indicated inside the correspondent bar in panel A. Asterisk, *, indicates a significant difference between KO and control mice, p<0.05).
Collectively we believe that differences in the functional behavior between [α4+α5]ko and [α4+β1]ko erythroid cells at homeostasis and during stress are dictated by differences in their ME cells. Endothelial cells, stromal cells, macrophages in [α4+β1]ko mice are deficient in other β1 heterodimers (i.e., α1β1, α2β1, α3β1, αvβ1)in addition to α4+α5 and these differences likely influence their functional support in stress erythropoiesis. This conclusion is strengthened by the fact that: a) at homeostasis the [α4+α5]ko mice have normal erythropoiesis (Fig. 2), whereas [α4+β1]ko, or [β1]ko mice have an uncompensated anemia4, b) the fact that there are transplantation differences when these different KO models are used as hosts (Fig 7); and c) when [β1]ko cells are transplanted in WT hosts, these animals do not have anemia at homeostasis (Suppl. Fig. 7), in contrast to untransplanted [β1]ko mice.
Transcriptomic profile of [α4+α5]integrin deficient Erythroid cells.
To explore transcriptomic differences between developing WT erythroid cells and those deficient in α4 and α5 integrins, we compared RNA sequence profiles of these cells at specific and highly comparable differentiation stages. In normal PHZ-treated mice the spleen shows many early forms at day 3.5 and by day 8 the great majority of erythroid cells are at late stages of maturation. By contrast the spleen of PHZ-treated [α4+α5]ko mice accumulates a small number of mostly at early stages with minimal further differentiation from days 3–8, (Fig. 8).
Figure 8. Inability to mount the response to PHZ in [α4+α5]ko mice.
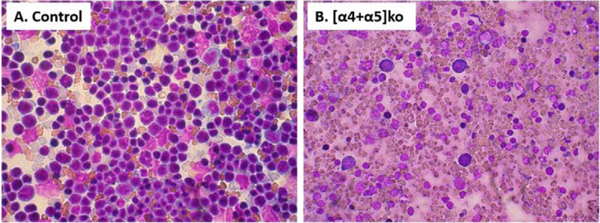
Cellular composition at d6 post PHZ of control (A) and KO (B) spleen. After the organ harvest, touch-prep of the spleen was stained with Wright-Giemsa stain and microphotographs were taken at X 40 magnification.
Therefore, by comparing splenic erythroblasts in control and ko mice at any specific day post PHZ we are bound to compare cells at different stages of maturation. As a host of regulatory genes upregulate or downregulate through erythroid differentiation, differences found could be easily attributed to differences in maturation stages. Thus we took extreme care to compare erythroblasts phenotypically and morphologically similar from both ko and control animals. From each mouse spleen we purified two populations of erythroblasts: early erythroblasts, Lin– CD71hi c-kit+Ter119lo and Lin–CD71hi c-kit–Ter119+ erythroblasts which represent the next step in differentiation sequence. In addition to their similar FACS profiles (Suppl. Fig. 5B) their morphological appearance was also comparable (Supp. Fig. 5A). These two populations were chosen since, as was previously stressed, most erythroid genes are activated or changed during this transitional stage13. Our transcriptomic analysis indicated that in ko erythroid cells, in contrast to control cells much fewer genes changed from one stage to the next (Fig. 9A). Specifically, despite the expected global gene downregulation seen in control cells, as described earlier14, the ko cells downregulated much less genes and at the same time they maintained a more primitive phenotype with higher expression of MEP genes and myeloid associated genes (Fig. 9B). That this outcome did not represent a mere delay in erythroid phenotype acquisition (i.e. displayed higher GATA2 and less Klf1), it was supported by the fact that the ko cells at both stages of differentiation displayed increased expression of ROS pathway-related genes (Fig. 9C, data not shown) and of several pro-apoptosis related genes at both stages of differentiation (Fig. 9D and data not shown).
Figure 9. Transcriptomic profile of WT and [α4+α5]ko erythroblasts.
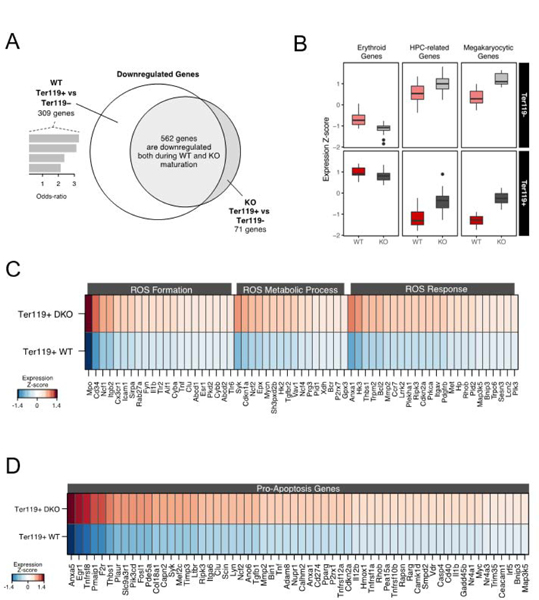
A. Venn diagram of the overlapping and exclusive downregulated genes between normal and KO CD71hiTer119+ erythroblasts (see Methods); B. Relative expression of genes related to erythroid differentiation, hematopoietic stem and progenitor cells and megakaryopoiesis; C. Differentially expressed genes related to ROS formation, metabolic processes and ROS general response; D. A set of differentially expressed genes related to the positive regulation of apoptosis.
All the above data provided a molecular conformation of the phenotype described earlier in primary and transplanted ko cells and suggested that ko erythroid cells are intrinsically unable to expediently assemble under stress conditions the complete erythroid differentiation profile required for optimal response.
DISCUSSION
Alpha5 integrin and Fibronectin in erythropoiesis
It was first recognized more than 30 years ago that interactions of erythroid cells with Fibronectin (Fn) in the hematopoietic tissues were important for the proliferation and differentiation of erythroid cells15. This interaction was thought to be mainly exercised by α5 integrin in erythroid cells having Fn as its exclusive ligand. Later on though, it was noted that a non-RGD-related binding of another integrin, α4, to the alternatively spliced CS-1 domain was also influencing erythropoiesis16. Subsequent studies also stressed the importance of α5 integrin in regulating proliferation8. An up-regulation of α5 integrin in cycling versus non-cycling progenitor cells allowed for their enhanced proliferation8. This view was also consistent with the loss of α5 in terminal differentiation17. However, several other data regarding α5 integrin, including progenitor homing10,18, its effect on programmed cell death6, its impact on erythroid stress response3, or its comparison with effects exerted by α4 integrin in erythroid cells9 have been controversial and difficult to reconcile. Although some of the discrepancies can be attributed to different experimental settings (in vitro versus in vivo), or have been the outcome of using reagents (i.e., antibodies) with unclear off target effects in vivo or in vitro, the overall picture regarding the influence of α5 integrin on erythropoiesis has been unsettling.
We believe that in our present studies, by comparing multiple mouse models, we have addressed some of the prior knowledge gaps and we have added some clarity on the intrinsic defects in [α4+α5]-deficient erythroid cells, their transcriptomic profile and their distinct responses to ME within the BM, as opposed to the one in the spleen. The functional consequences of erythroid cells being deficient in α5 integrin at early vs. late hematopoietic stages were also further refined. In contrast to previous studies emphasizing that the interaction of α5 integrin with Fn assumed a prominent role on proliferative expansion of erythroid cells in response to stress3, our present data suggest that the α5 integrin action on Fn can be fully compensated by α4 integrin, at least in erythroid cells. This view is consistent with a broad conclusion from the literature about α5 integrins in other cell types in which other integrins in the absence of α5β1 can substitute for Fn/matrix assembly partially or completely depending on the cell type11,19–21. However, in contrast to data on proliferative expansion of early erythroid precursor cells, which suffer when both α4 and α5 integrins are missing, for the BM erythroblast retention (in mice5 and humans22,23) and terminal maturation of erythroid cells only α4β1 integrin assumes a dominant role. A significant transient delay in erythroid stress response is seen when only α4 integrin is missing4,5, as well as in all other models where α4 is combined with deficiencies of other integrins4. Earlier in vitro data distinguishing the early Epo-dependent phase in erythropoiesis vs. the late α4-integrin-dependent but Epo-independent maturation phase24 are also concordant with our present conclusions.
Microenvironmental contribution to stress erythropoiesis
Macrophages:
Interactions of erythroid cells with their supportive ME involve both matrix-dependent interactions and as well as cell-cell interactions with different type of ME cells. Specifically, interactions of erythroid cells with macrophages and their enduring “love affair” has dominated the literature for over 40 years25. According to this view, necessary adhesive interactions are mediated through the presence of receptor/counter-receptor molecules present in these two cell types, and these are either homotypic (i.e., presence of Maea in both Ery-cells and MFs) or heterotypic (α4/VCAM-1 or ICAM-4/αv) and are deemed highly important for proliferation and erythroid differentiation, as it was emphasized in numerous prior reviews25–29 . Reductions in total erythroid cells engaged by MFs, due to either forced depletion in the number of available MFs30,31, or to functional defects32 were cited as a major factor influencing the responses to stress or steady state erythropoiesis. However, there were unexplained differences between BM and spleen responses30,33 and unexpectedly, when specific erythroblast/MF interactions were disrupted in ko animals34–36 appropriate responses were seen. For example, the use of clodronate for reduction of MF numbers had in addition other off target detrimental effects, obscuring the conclusions36. Our recently published data with VCAM-1 ko mice show that reduction in the number of MFs or their failure to appropriate expand post stress (decreased response or survival disadvantage?) do not diminish response of normal erythroid cells2,35. All the above data provided divergent and incongruous twists as to the importance or to the strength of contribution of these interactions to the overall response Therefore considering the prior data and those presented here we can suggest that ,at least in the context of α4 and α5 integrin expression by erythroid cells, it is primarily the functional status of erythroid cells with their inability to counteract the increased ROS consequences that sets the amplitude of the stress response and not the extrinsic influence of MFs. In addition, co-presence of normal macrophages and normal erythroid cells, through their putative elaboration of positive signals37,38 did not mitigate against the demise of [α4+α5]ko erythroid cells.
Other ME cells:
Apart from MFs, the cellular identities of ME cells that influence stress erythropoiesis is currently a work in progress. The observation that stromal cells from mouse spleen with the in vitro properties of endothelial cells are able to selectively support erythropoiesis was first published about 30 years ago39,40. Several molecules necessary for expanding erythropoiesis post stress have been subsequently identified and major players include SCF/c-kit, and BMP4/Hedge Hog produced by ME cells41–43. Exaggerated spleen responses were relied mainly on heightened sensitivity of erythroid cells to SCF41, although others concluded that such a response was mainly present in BM42. More recent studies with further refined techniques and unique mouse models have, with resurgent interest, emphasized that stress erythropoiesis is dependent on SCF (and CXCL12) synthesized by VE-cadherin+ endothelial cells and PDGFβ+ stromal cells in the spleen, whereas in BM, LepR+ perivascular cells were the main sources of SCF44 Thus the cells secreting the same factors express different markers in BM vs. spleen44. Specific SCF deletion in peri-sinusoidal (using LepR-cre) but not peri-arteriolar niche cells (using NG2-cre) in BM also corroborated the fact that peri-sinusoidal cells are the main source of SCF45. Yet arterial endothelial cells46 or dendritic cells47, or adipocytes48 were also emphasized as sources of SCF.
But what were the stimuli responsible for the stromal cell-including endothelial cell-responses? Earlier studies have shown that SCF expression of vascular endothelial cells is upregulated under inflammatory conditions by IL-1β or TNFα49,50 and Glucocorticoids could modulate that effect. Of interest upon TNFα- stimulation HUVECs also upregulated β1 integrin expression51 connecting the ability to produce SCF to the activation of β1 integrin.
During PHZ treatment (as a model of stress erythropoiesis) excessive hemolysis overwhelms Haptoglobin-Hemoglobin clearing system and the cell free Hb releases its heme. As free heme is an agonist of TLR4, it binds TLR4 in endothelial cells, which to defend themselves from ROS and combat the continuing inflammatory insult need to increase HO-1 and their integrin signaling (through β1,FAK,p38/MAPK)52. Therefore, both the inflammatory stimulation and its control in endothelial cells is dependent on integrin function.
Considering the above concepts placing β1 signaling at the interface of SCF induction by inflammatory stimuli during PHZ treatment, our present experiments in which both normal erythroid cells and normal MFs failed to respond to stress within a host spleen ME deficient in several or all β1 integrins may be mechanistically intriguing.
Previous data suggested that the developing endothelium is exquisitely sensitive to β1 integrin dosage, but in the adult animal, vessels of distinct caliber seem to employ alternative molecules. Thus, β1 integrin inactivation through VE-cadherin-cre documented roles in endo- cell polarity and lumen formation of midsize arteries, but not veins or capillaries or lymphatics despite the fact that these also express β1 integrin53–55. Further unresolved issues that complicate the interpretation of integrin data in endothelial or other ME cells are: the different types of endothelial and perivascular cells that are present among different regions even in a single tissue56; the penetrance of genetic models used may be tissue dependent44; β1 signaling with specific stimuli may be dependent on the presence of different β1 heterodimers and other cooperating proteins and the signaling pathways regulating these proteins54.
Although the precise level of deletion of all β1 integrins in endothelial, perivascular, or other stromal cells in spleen is not clear, our data do suggest that in the cumulative presence of β1-deficient ME cells, likely through dysregulation of FAK-signals and their downstream effectors, does not provide a supportive environment for steady state and stress erythropoiesis. Our preliminary evidence that CD31+/CD45–/Ter119– β1-negative endothelial cells in spleen were not as competent in expression of mSCF as the control cells (Suppl. Fig. 6) adds to the argument of insufficient presence of positive signals needed for stress response. However, absence of only α4+α5 integrins in ME cells has a likely permissive role, in contrast to the dominant one by additional β1-dependent heterodimers directing a putative differential signaling impacting their function.
BM vs. spleen
Several publications have pointed out discrete differences in stress erythropoiesis responses between BM and the spleen4,33,39,41,42,44,57–62.
Whether presence or absence of specific ME lineage cells (i.e., osteoblasts, MSCs etc.), or differences in matrix composition (i.e., an array of different laminins in BM vs. spleen), as well as phenotypic and/or functional differences among cells of the same lineage in the two tissues are responsible for unequal responses is unclear. For example, constitutive activation of Akt in endothelium induced stress erythropoiesis in the spleen but not the BM and this was reproduced in transplantation experiments using Akt activated mice as hosts63. Also, it is possible that specific regulatory networks differ between BM vs. spleen-derived erythroblasts. ERK1–/– mice develop stress erythropoiesis only in spleen and the data were reproduced upon transplantation of ERK1–/– BM cells into WT recipients64,65. Also Lyl–/–mice develop stress erythropoiesis only in the spleen after PHZ treatment and this is attributed to differential expression of Lyl-1 in BM vs. spleen during differentiation: increase in BM but decrease in spleen66.
All the above illustrative examples highlight the fact that there are multiple pathways that regulate erythropoiesis under stress and these may be distinctly operative between BM and spleen. In our experiments both the normal erythroid cells, within the ko BM-ME, or the [α4+α5]-deficient erythroid cells within the normal BM ME were responding to stress signals in contrast to spleen-ME. Thus, our data together with the previously stated ones emphasize the fact that the BM environment has a broader than spleen functional diversity and adaptation to stress being capable of engaging both normal and mutant erythroid cells and rendering different outcomes. However, how different cell intrinsic signals are connected to extrinsic signals from ME has not been elucidated thus far in any specific setting. Also, the cellular sources of factors elaborated by ME cells may be different for homeostasis compared to stress conditions. Future studies should address the specific functional behavior of ME cell types that are β1 deficient (i.e., endos, other stromal cells), individually or collectively, responsible for the overall strength of erythroid stress response.
Finally, given that differences in the functional transcriptomic or epigenetic profiles exist between human and murine erythroid cells67,68, whether our conclusions drawn from studying the stress response of murine erythroid cells have any counter representation on the functional behavior of human erythroid cells lacking similar sets of integrins remains to be explored.
Supplementary Material
Highlights.
α4 integrin has a dominant influence on terminal erythroid maturation.
α5 integrin has a redundant role on expansion of erythoid cells post stress, but is dispensable for their terminal maturation.
Presence of both α4 and α5 integrins in erythroid cells empowers their responses to oxidative insults.
A previously unappreciated link was revealed between β1 integrin-dependent signals in microenvironmental cells mediating positive responses by erythroid cells.
Acknowledgements
We are indebted to Dr. Peter Besmer for providing his anti-SCF antibody
Research supported by NIH Grant DK094702 to T.P.
Footnotes
Publisher's Disclaimer: This is a PDF file of an unedited manuscript that has been accepted for publication. As a service to our customers we are providing this early version of the manuscript. The manuscript will undergo copyediting, typesetting, and review of the resulting proof before it is published in its final form. Please note that during the production process errors may be discovered which could affect the content, and all legal disclaimers that apply to the journal pertain.
REFERENCES
- 1.Scott LM, Priestley GV, Papayannopoulou T. Deletion of alpha4 integrins from adult hematopoietic cells reveals roles in homeostasis, regeneration, and homing. Mol Cell Biol. 2003;23(24):9349–9360. [DOI] [PMC free article] [PubMed] [Google Scholar]
- 2.Ulyanova T, Scott LM, Priestley GV, et al. VCAM-1 expression in adult hematopoietic and nonhematopoietic cells is controlled by tissue-inductive signals and reflects their developmental origin. Blood. 2005;106(1):86–94. [DOI] [PMC free article] [PubMed] [Google Scholar]
- 3.Ulyanova T, Jiang Y, Padilla S, Nakamoto B, Papayannopoulou T. Combinatorial and distinct roles of alpha(5) and alpha(4) integrins in stress erythropoiesis in mice. Blood. 2011;117(3):975–985. [DOI] [PMC free article] [PubMed] [Google Scholar]
- 4.Ulyanova T, Jiang Y, Padilla SM, Papayannopoulou T. Erythroid cells generated in the absence of specific beta1-integrin heterodimers accumulate reactive oxygen species at homeostasis and are unable to mount effective antioxidant defenses. Haematologica. 2013;98(11):1769–1777. [DOI] [PMC free article] [PubMed] [Google Scholar]
- 5.Ulyanova T, Padilla SM, Papayannopoulou T. Stage-specific functional roles of integrins in murine erythropoiesis. Exp Hematol. 2014;42(5):404–409 e404. [DOI] [PMC free article] [PubMed] [Google Scholar]
- 6.Sugahara H, Kanakura Y, Furitsu T, et al. Induction of programmed cell death in human hematopoietic cell lines by fibronectin via its interaction with very late antigen 5. J Exp Med. 1994;179(6):1757–1766. [DOI] [PMC free article] [PubMed] [Google Scholar]
- 7.Oostendorp RA, Spitzer E, Reisbach G, Dormer P. Antibodies to the beta 1-integrin chain, CD44, or ICAM-3 stimulate adhesion of blast colony-forming cells and may inhibit their growth. Exp Hematol. 1997;25(4):345–349. [PubMed] [Google Scholar]
- 8.Giet O, Huygen S, Beguin Y, Gothot A. Cell cycle activation of hematopoietic progenitor cells increases very late antigen-5-mediated adhesion to fibronectin. Exp Hematol. 2001;29(4):515–524. [DOI] [PubMed] [Google Scholar]
- 9.Kapur R, Cooper R, Zhang L, Williams DA. Cross-talk between alpha(4)beta(1)/alpha(5)beta(1) and c-Kit results in opposing effect on growth and survival of hematopoietic cells via the activation of focal adhesion kinase, mitogen-activated protein kinase, and Akt signaling pathways. Blood. 2001;97(7):1975–1981. [DOI] [PubMed] [Google Scholar]
- 10.Wierenga PK, Weersing E, Dontje B, de Haan G, van Os R. Differential role for very late antigen-5 in mobilization and homing of hematopoietic stem cells. Bone Marrow Transplant. 2006;38(12):789–797. [DOI] [PubMed] [Google Scholar]
- 11.van der Flier A, Badu-Nkansah K, Whittaker CA, et al. Endothelial alpha5 and alphav integrins cooperate in remodeling of the vasculature during development. Development. 2010;137(14):2439–2449. [DOI] [PMC free article] [PubMed] [Google Scholar]
- 12.Heinrich AC, Pelanda R, Klingmuller U. A mouse model for visualization and conditional mutations in the erythroid lineage. Blood. 2004;104(3):659–666. [DOI] [PubMed] [Google Scholar]
- 13.Ulirsch JC, Lacy JN, An X, Mohandas N, Mikkelsen TS, Sankaran VG. Altered chromatin occupancy of master regulators underlies evolutionary divergence in the transcriptional landscape of erythroid differentiation. PLoS Genet. 2014;10(12):e1004890. [DOI] [PMC free article] [PubMed] [Google Scholar]
- 14.Shyu YC, Lee TL, Chen X, et al. Tight regulation of a timed nuclear import wave of EKLF by PKCtheta and FOE during Pro-E to Baso-E transition. Dev Cell. 2014;28(4):409–422. [DOI] [PubMed] [Google Scholar]
- 15.Patel VP, Lodish HF. A fibronectin matrix is required for differentiation of murine erythroleukemia cells into reticulocytes. J Cell Biol. 1987;105(6 Pt 2):3105–3118. [DOI] [PMC free article] [PubMed] [Google Scholar]
- 16.Verfaillie CM, McCarthy JB, McGlave PB. Differentiation of primitive human multipotent hematopoietic progenitors into single lineage clonogenic progenitors is accompanied by alterations in their interaction with fibronectin. J Exp Med. 1991;174(3):693–703. [DOI] [PMC free article] [PubMed] [Google Scholar]
- 17.Vuillet-Gaugler MH, Breton-Gorius J, Vainchenker W, et al. Loss of attachment to fibronectin with terminal human erythroid differentiation. Blood. 1990;75(4):865–873. [PubMed] [Google Scholar]
- 18.Craddock CF, Nakamoto B, Elices M, Papayannopoulou T. The role of CS1 moiety of fibronectin in VLA mediated haemopoietic progenitor trafficking. Br J Haematol. 1997;97(1):15–21. [DOI] [PubMed] [Google Scholar]
- 19.Bauer JS, Schreiner CL, Giancotti FG, Ruoslahti E, Juliano RL. Motility of fibronectin receptor-deficient cells on fibronectin and vitronectin: collaborative interactions among integrins. J Cell Biol. 1992;116(2):477–487. [DOI] [PMC free article] [PubMed] [Google Scholar]
- 20.Danen EH, Sonneveld P, Brakebusch C, Fassler R, Sonnenberg A. The fibronectin-binding integrins alpha5beta1 and alphavbeta3 differentially modulate RhoA-GTP loading, organization of cell matrix adhesions, and fibronectin fibrillogenesis. J Cell Biol. 2002;159(6):1071–1086. [DOI] [PMC free article] [PubMed] [Google Scholar]
- 21.Huveneers S, Truong H, Fassler R, Sonnenberg A, Danen EH. Binding of soluble fibronectin to integrin alpha5 beta1 - link to focal adhesion redistribution and contractile shape. J Cell Sci. 2008;121(Pt 15):2452–2462. [DOI] [PubMed] [Google Scholar]
- 22.Robier C, Amouzadeh-Ghadikolai O, Bregant C, et al. The anti-VLA-4 antibody natalizumab induces erythroblastaemia in the majority of the treated patients with multiple sclerosis. Mult Scler. 2014;20(9):1269–1272. [DOI] [PubMed] [Google Scholar]
- 23.La Gioia S, Seghezzi M, Barcella V, et al. Erythroblastaemia in natalizumab-treated patients with multiple sclerosis. Mult Scler Relat Disord. 2016;8:141–144. [DOI] [PubMed] [Google Scholar]
- 24.Eshghi S, Vogelezang MG, Hynes RO, Griffith LG, Lodish HF. Alpha4beta1 integrin and erythropoietin mediate temporally distinct steps in erythropoiesis: integrins in red cell development. J Cell Biol. 2007;177(5):871–880. [DOI] [PMC free article] [PubMed] [Google Scholar]
- 25.Bessis M [Erythroblastic island, functional unity of bone marrow]. Rev Hematol. 1958;13(1):8–11. [PubMed] [Google Scholar]
- 26.Chasis JA, Mohandas N. Erythroblastic islands: niches for erythropoiesis. Blood. 2008;112(3):470–478. [DOI] [PMC free article] [PubMed] [Google Scholar]
- 27.Manwani D, Bieker JJ. The erythroblastic island. Curr Top Dev Biol. 2008;82:23–53. 28. [DOI] [PMC free article] [PubMed] [Google Scholar]
- 28.de Back DZ, Kostova EB, van Kraaij M, van den Berg TK, van Bruggen R. Of macrophages and red blood cells; a complex love story. Front Physiol. 2014;5:9. [DOI] [PMC free article] [PubMed] [Google Scholar]
- 29.McGrath KE. Red cell island dances: switching hands. Blood. 2014;123(25):3847–3848. [DOI] [PubMed] [Google Scholar]
- 30.Chow A, Huggins M, Ahmed J, et al. CD169(+) macrophages provide a niche promoting erythropoiesis under homeostasis and stress. Nat Med. 2013;19(4):429–436. [DOI] [PMC free article] [PubMed] [Google Scholar]
- 31.Ramos P, Casu C, Gardenghi S, et al. Macrophages support pathological erythropoiesis in polycythemia vera and beta-thalassemia. Nat Med. 2013;19(4):437–445. [DOI] [PMC free article] [PubMed] [Google Scholar]
- 32.Fraser ST, Midwinter RG, Coupland LA, et al. Heme oxygenase-1 deficiency alters erythroblastic island formation, steady-state erythropoiesis and red blood cell lifespan in mice. Haematologica. 2015;100(5):601–610. [DOI] [PMC free article] [PubMed] [Google Scholar]
- 33.Wei Q, Boulais PE, Zhang D, Pinho S, Tanaka M, Frenette PS. Maea expressed by macrophages, but not erythroblasts, maintains postnatal murine bone marrow erythroblastic islands. Blood. 2019;133(11):1222–1232. [DOI] [PMC free article] [PubMed] [Google Scholar]
- 34.Goossens D, Trinh-Trang-Tan MM, Debbia M, et al. Generation and characterisation of Rhd and Rhag null mice. Br J Haematol. 2010;148(1):161–172. [DOI] [PubMed] [Google Scholar]
- 35.Ulyanova T, Phelps SR, Papayannopoulou T. The macrophage contribution to stress erythropoiesis: when less is enough. Blood. 2016;128(13):1756–1765. [DOI] [PMC free article] [PubMed] [Google Scholar]
- 36.Yuan H, Gao S, Chen H, et al. Primitive macrophages are dispensable for HSPC mobilization and definitive hematopoiesis. Blood. 2019;134(9):782–784. [DOI] [PubMed] [Google Scholar]
- 37.Tordjman R, Delaire S, Plouet J, et al. Erythroblasts are a source of angiogenic factors. Blood. 2001;97(7):1968–1974. [DOI] [PubMed] [Google Scholar]
- 38.Angelillo-Scherrer A, Burnier L, Lambrechts D, et al. Role of Gas6 in erythropoiesis and anemia in mice. J Clin Invest. 2008;118(2):583–596. [DOI] [PMC free article] [PubMed] [Google Scholar]
- 39.Yanai N, Matsuya Y, Obinata M. Spleen stromal cell lines selectively support erythroid colony formation. Blood. 1989;74(7):2391–2397. [PubMed] [Google Scholar]
- 40.Yanai N, Satoh T, Obinata M. Endothelial cells create a hematopoietic inductive microenvironment preferential to erythropoiesis in the mouse spleen. Cell Struct Funct. 1991;16(1):87–93. [DOI] [PubMed] [Google Scholar]
- 41.Broudy VC, Lin NL, Priestley GV, Nocka K, Wolf NS. Interaction of stem cell factor and its receptor c-kit mediates lodgment and acute expansion of hematopoietic cells in the murine spleen. Blood. 1996;88(1):75–81. [PubMed] [Google Scholar]
- 42.Perry JM, Harandi OF, Porayette P, Hegde S, Kannan AK, Paulson RF. Maintenance of the BMP4-dependent stress erythropoiesis pathway in the murine spleen requires hedgehog signaling. Blood. 2009;113(4):911–918. [DOI] [PMC free article] [PubMed] [Google Scholar]
- 43.Harandi OF, Hedge S, Wu DC, McKeone D, Paulson RF. Murine erythroid short-term radioprotection requires a BMP4-dependent, self-renewing population of stress erythroid progenitors. J Clin Invest. 2010;120(12):4507–4519. [DOI] [PMC free article] [PubMed] [Google Scholar]
- 44.Inra CN, Zhou BO, Acar M, et al. A perisinusoidal niche for extramedullary haematopoiesis in the spleen. Nature. 2015;527(7579):466–471. [DOI] [PMC free article] [PubMed] [Google Scholar]
- 45.Asada N, Kunisaki Y, Pierce H, et al. Differential cytokine contributions of perivascular haematopoietic stem cell niches. Nat Cell Biol. 2017;19(3):214–223. [DOI] [PMC free article] [PubMed] [Google Scholar]
- 46.Xu C, Gao X, Wei Q, et al. Stem cell factor is selectively secreted by arterial endothelial cells in bone marrow. Nat Commun. 2018;9(1):2449. [DOI] [PMC free article] [PubMed] [Google Scholar]
- 47.Kim TS, Hanak M, Trampont PC, Braciale TJ. Stress-associated erythropoiesis initiation is regulated by type 1 conventional dendritic cells. J Clin Invest. 2015;125(10):3965–3980. [DOI] [PMC free article] [PubMed] [Google Scholar]
- 48.Zhou BO, Yu H, Yue R, et al. Bone marrow adipocytes promote the regeneration of stem cells and haematopoiesis by secreting SCF. Nat Cell Biol. 2017;19(8):891–903. [DOI] [PMC free article] [PubMed] [Google Scholar]
- 49.Da Silva CA, Heilbock C, Kassel O, Frossard N. Transcription of stem cell factor (SCF) is potentiated by glucocorticoids and interleukin-1beta through concerted regulation of a GRE-like and an NF-kappaB response element. FASEB J. 2003;17(15):2334–2336. [DOI] [PubMed] [Google Scholar]
- 50.Da Silva CA, Kassel O, Lebouquin R, Lacroix EJ, Frossard N. Paradoxical early glucocorticoid induction of stem cell factor (SCF) expression in inflammatory conditions. Br J Pharmacol. 2004;141(1):75–84. [DOI] [PMC free article] [PubMed] [Google Scholar]
- 51.Sun WY, Pitson SM, Bonder CS. Tumor necrosis factor-induced neutrophil adhesion occurs via sphingosine kinase-1-dependent activation of endothelial {alpha}5{beta}1 integrin. Am J Pathol. 2010;177(1):436–446. [DOI] [PMC free article] [PubMed] [Google Scholar]
- 52.Nash GB. Fahraeus Medal Award Lecture 2013. Cellular hemorheology: the importance of getting small cells through small gaps. Biorheology. 2013;50(5–6):223–239. [DOI] [PubMed] [Google Scholar]
- 53.Bloch W, Forsberg E, Lentini S, et al. Beta 1 integrin is essential for teratoma growth and angiogenesis. J Cell Biol. 1997;139(1):265–278. [DOI] [PMC free article] [PubMed] [Google Scholar]
- 54.Brakebusch C, Fassler R. beta 1 integrin function in vivo: adhesion, migration and more. Cancer Metastasis Rev. 2005;24(3):403–411. [DOI] [PubMed] [Google Scholar]
- 55.Zovein AC, Luque A, Turlo KA, et al. Beta1 integrin establishes endothelial cell polarity and arteriolar lumen formation via a Par3-dependent mechanism. Dev Cell. 2010;18(1):39–51. [DOI] [PMC free article] [PubMed] [Google Scholar]
- 56.Mendez-Ferrer S Molecular interactome between HCSs and their niches. Blood. 2019;134:1197–1198. [DOI] [PubMed] [Google Scholar]
- 57.Walkley CR, Shea JM, Sims NA, Purton LE, Orkin SH. Rb regulates interactions between hematopoietic stem cells and their bone marrow microenvironment. Cell. 2007;129(6):1081–1095. [DOI] [PMC free article] [PubMed] [Google Scholar]
- 58.Tada T, Inoue N, Widayati DT, Fukuta K. Role of MAdCAM-1 and its ligand on the homing of transplanted hematopoietic cells in irradiated mice. Exp Anim. 2008;57(4):347–356. [DOI] [PubMed] [Google Scholar]
- 59.Agosti V, Karur V, Sathyanarayana P, Besmer P, Wojchowski DM. A KIT juxtamembrane PY567 -directed pathway provides nonredundant signals for erythroid progenitor cell development and stress erythropoiesis. Exp Hematol. 2009;37(2):159–171. [DOI] [PMC free article] [PubMed] [Google Scholar]
- 60.Migliaccio AR, Martelli F, Verrucci M, et al. Gata1 expression driven by the alternative HS2 enhancer in the spleen rescues the hematopoietic failure induced by the hypomorphic Gata1low mutation. Blood. 2009;114(10):2107–2120. [DOI] [PMC free article] [PubMed] [Google Scholar]
- 61.Lai JC, Ponti S, Pan D, et al. The DEAH-box helicase RHAU is an essential gene and critical for mouse hematopoiesis. Blood. 2012;119(18):4291–4300. [DOI] [PubMed] [Google Scholar]
- 62.Vignjevic Petrinovic S, Budec M, Markovic D, et al. Macrophage migration inhibitory factor is an endogenous regulator of stress-induced extramedullary erythropoiesis. Histochem Cell Biol. 2016;146(3):311–324. [DOI] [PubMed] [Google Scholar]
- 63.O’Donnell RK, Goldstein WE, Perruzzi C, Benjamin LE, Aird WC. Overexpression of MyrAkt1 in endothelial cells leads to erythropoietin- and BMP4-independent splenic erythropoiesis in mice. PLoS One. 2013;8(1):e55095. [DOI] [PMC free article] [PubMed] [Google Scholar]
- 64.Guihard S, Clay D, Cocault L, et al. The MAPK ERK1 is a negative regulator of the adult steady-state splenic erythropoiesis. Blood. 2010;115(18):3686–3694. [DOI] [PubMed] [Google Scholar]
- 65.Nagata Y, Todokoro K. Requirement of activation of JNK and p38 for environmental stress-induced erythroid differentiation and apoptosis and of inhibition of ERK for apoptosis. Blood. 1999;94(3):853–863. [PubMed] [Google Scholar]
- 66.Capron C, Lacout C, Lecluse Y, et al. LYL-1 deficiency induces a stress erythropoiesis. Exp Hematol. 2011;39(6):629–642. [DOI] [PubMed] [Google Scholar]
- 67.Pishesha N, Thiru P, Shi J, Eng JC, Sankaran VG, Lodish HF. Transcriptional divergence and conservation of human and mouse erythropoiesis. Proc Natl Acad Sci U S A. 2014;111(11):4103–4108. [DOI] [PMC free article] [PubMed] [Google Scholar]
- 68.An X, Schulz VP, Li J, et al. Global transcriptome analyses of human and murine terminal erythroid differentiation. Blood. 2014;123(22):3466–3477. [DOI] [PMC free article] [PubMed] [Google Scholar]
Associated Data
This section collects any data citations, data availability statements, or supplementary materials included in this article.