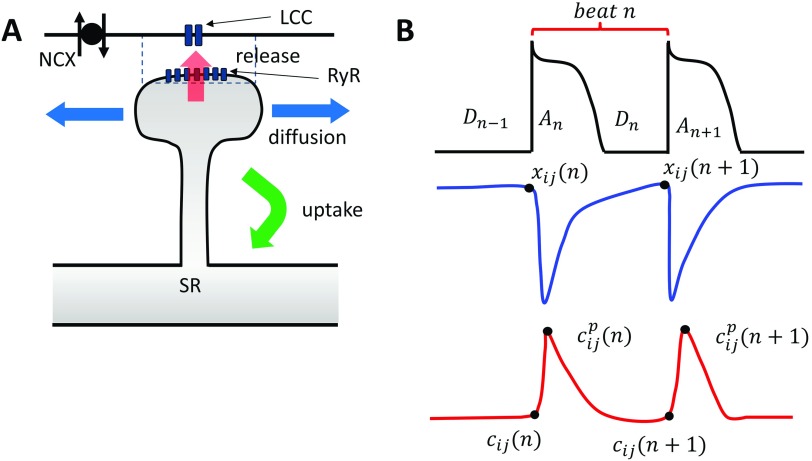
FIG. 1.
(a) The architecture of Ca signaling in cardiac myocytes. Each dyadic junction contains LCC channels in close proximity to an RyR cluster. Calcium is released into the dyadic junction (dashed rectangle) due to Ca sparks that are initiated by the LCC openings. The released Ca then diffuses into the cell and is pumped back into the SR via uptake pumps. NCX denotes the sodium-calcium exchanger that couples the Ca released to the voltage across the membrane. (b) Illustration of the mapping variables used to describe the beat-to-beat dynamics of voltage and Ca at a single dyad. Top trace shows that the voltage waveform which is characterized by the APD at beat n is denoted as , which depends on the previous diastolic interval . Blue trace denotes the SR load at the beginning and at the end of beat n. Red trace denotes the total Ca in the cytosol at the beginning of beat , at the peak , and at the beginning of the next beat .

