Abstract
HIV-1 infection is associated with heightened inflammation and excess risk of cardiovascular disease, cancer, and other complications. These pathologies persist despite antiretroviral therapy (ART). In two independent cohorts, we found that innate lymphoid cells (ILCs) were depleted in the blood and gut of people with HIV-1, even with effective ART. ILC depletion was associated with neutrophil infiltration of the gut lamina propria, type 1 interferon activation, increased microbial translocation, and natural killer (NK) cell skewing towards an inflammatory state with chromatin structure and phenotype typical of WNT transcription factor TCF7-dependent memory T cells. Cytokines that are elevated during acute HIV-1 infection reproduced the ILC and NK cell abnormalities ex vivo. These results demonstrate that inflammatory cytokines associated with HIV-1 infection irreversibly disrupt ILCs. This results in loss of gut epithelial integrity, microbial translocation, and memory NK cells with heightened inflammatory potential, and explains the chronic inflammation in people with HIV-1.
HIV-1 infection is lifelong and no treatments yet available reliably eliminate the virus from infected people. Depletion of CD4+ T cells by HIV-1 eventually results in systemic immune failure in untreated individuals1. Effective antiretroviral therapy (ART) suppresses HIV-1 replication to undetectable levels and prevents CD4+ T cell loss and progression to AIDS. However, infected individuals on treatment have chronic inflammation with increased rates of cardiovascular, liver, kidney and neurological diseases1. These pathologies have been attributed in part to permanent disruption of cellular networks that maintain the integrity of the intestinal epithelium and limit the intestinal microbiome1,2.
Innate lymphoid cells (ILCs) are T cell counterparts that lack clonotypic antigen receptors or other lineage-defining cell surface markers. ILCs carry out many biological functions that include host defense against pathogens and homeostatic maintenance in inflamed tissues3. Among the many subsets of ILCs are Natural Killer (NK) cells, that are capable of lysing tumor cells and virus-infected cells. ILCs are divided into three main subtypes based on key transcription factors and cytokines that they produce. ILC1s and NK cells both express the transcription factor TBX21 and secrete interferon-γ (IFN-γ). ILC2s express the prostaglandin D2 receptor CRTH2, require the transcription factor GATA3 for their development, and produce the cytokines IL-4, IL-5, IL-9, IL-13, and Amphiregulin. ILC3s express the transcription factor RORγt and produce IL-17 and IL-22.
Blood ILCs are irreversibly depleted by HIV-1 if antiretroviral therapy is not started within a few weeks of infection4. SIV infection of macaques decreases homeostatic ILC3s in the intestine5. The contribution of ILC deficiency to HIV-1-associated chronic inflammation remains unclear since abnormalities in homeostatic ILCs from human tissues such as the lamina propria have not been reported.
NK cells rapidly respond to virus infected cells or tumors, independent of antigen-specific recognition. NK cells eliminate infected cells via antibody-dependent cell cytotoxicity6. The clinical significance of NK cells for control of HIV-1 is supported by the influence of HLA haplotype and NK cell KIRs7. Studies in mice, rhesus macaques, and humans have shown that the response of NK cells is enhanced by prior encounter with inflammatory cytokines, haptens, vaccination, or by certain viruses8. How closely these memory-like NK cells share transcriptional and chromatin features with memory T cells, and whether HIV-1 infection affects this unique NK population, is not known.
Here, to better understand the etiology of the ongoing inflammation that is often observed with HIV-1 infection, despite effective suppression of viremia by ART, a detailed examination of the effect of HIV-1 on innate lymphoid cells (ILCs) and NK cells was performed.
Results
HIV-1 infection decreases ILCs in the blood and in the colon lamina propria
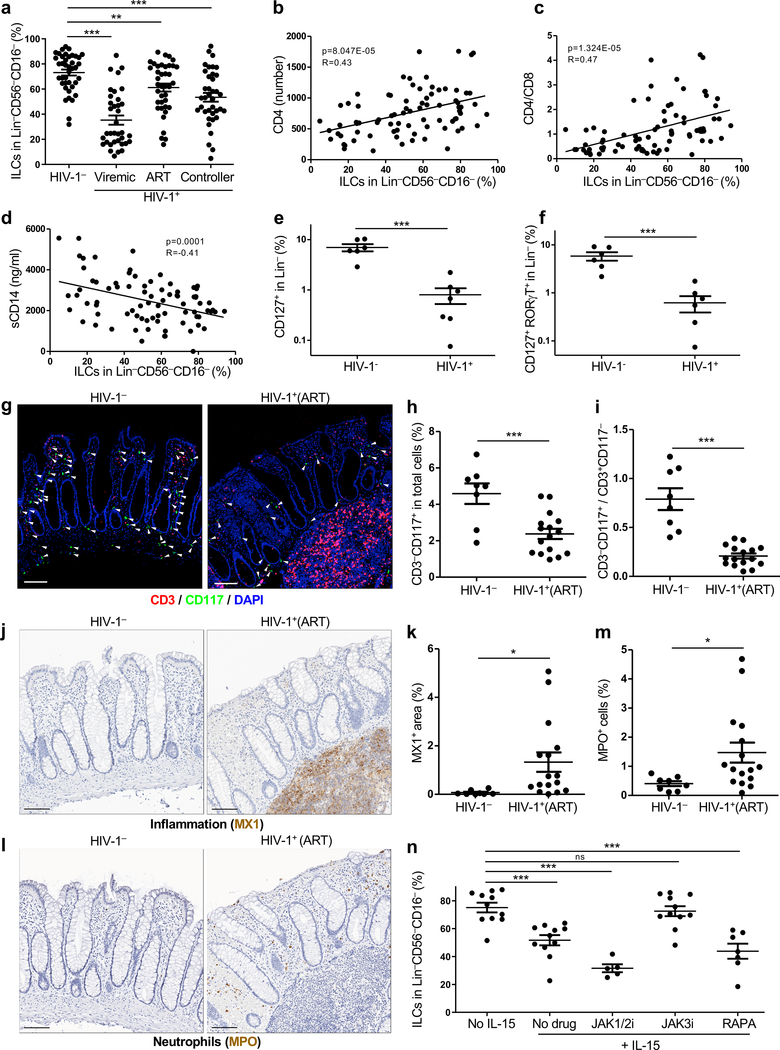
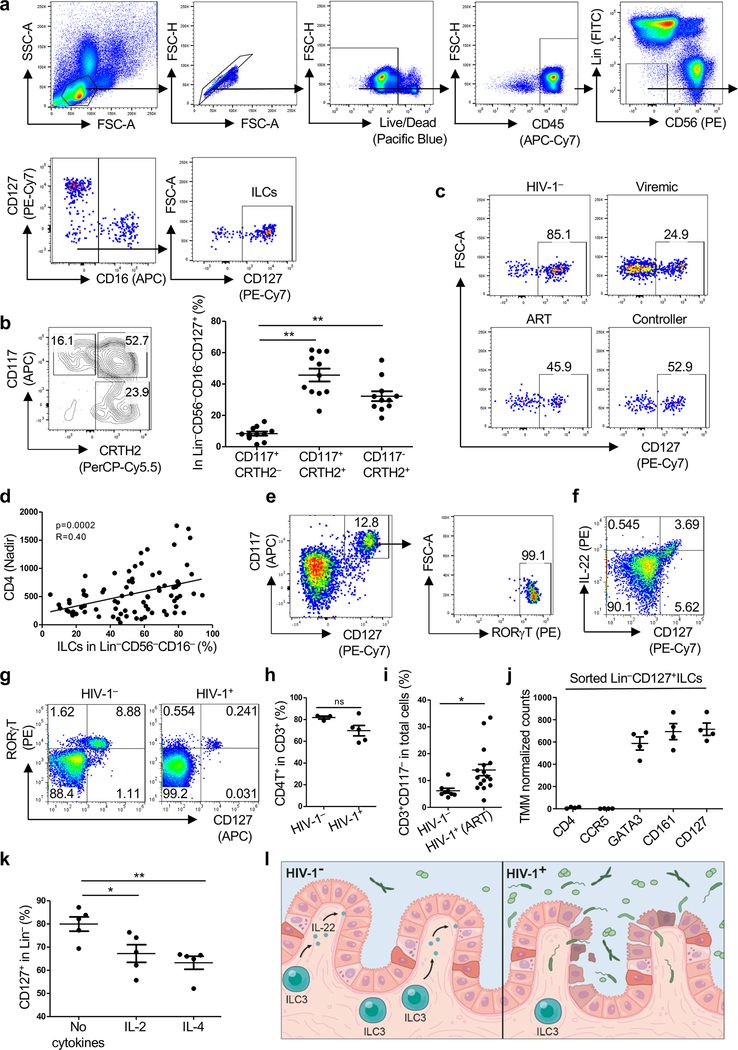
To identify ILCs from among human peripheral blood mononuclear cells (PBMCs), sixteen cell surface proteins were used to exclude T cells, B cells, NK cells, and other cells from defined lineages within the lymphoid gate (Extended Data Fig. 1a), and ILCs were defined as Lin−CD127+ cells3,4. As previously described9,10, the majority of human blood ILCs were CRTH2+ and/or CD117+ (Extended Data Fig. 1b). Blood ILCs from HIV-1− people were then compared with those from HIV-1+ people who were either HIV-1 viremic, ART-suppressed, or spontaneous controllers of viremia who were not on ART (cohort described in Supplementary Table 1). As compared with HIV-1− people, ILCs were significantly decreased in all groups with HIV-1 infection (Fig. 1a and Extended Data Fig. 1c). The percentage of ILCs correlated with the number of CD4+ T cells, the CD4+ T cell nadir, and the ratio of CD4+/CD8+ T cells (Fig. 1b,c and Extended Data Fig. 1d). In contrast, ILC percentage was inversely correlated with plasma sCD14 (Fig. 1d), a protein released by monocytes in response to lipopolysaccharide (LPS) that independently predicts clinical outcome of HIV-1 infection1. These results indicate that, despite repressed viral replication in HIV-1+ people on ART, or in people who spontaneously control viremia, there is ongoing inflammation and persistent decrease in blood ILCs.
Fig. 1 |. HIV-1 infection decreases ILCs in blood and colon lamina propria.
a, Percent ILCs (Lin−CD56−CD16−CD127+ PBMCs; Extended Data Fig. 1a) from 40 HIV-1−, 36 HIV-1+ viremic, 39 HIV-1+ on ART, and 38 HIV-1+ spontaneous controllers (Supplementary Table 1). b-d, ILCs as in a, correlation with CD4s (b), CD4/CD8 ratio (c), and plasma sCD14 (d). Correlation coefficient (R) by Pearson, zero slope p value determined by the F-test (n=80). e,f, Percent Lin−CD127+ILCs (e) and Lin−CD127+RORγT+ILC3s (f), among colon lamina propria lymphoid cells from 6 HIV-1− and 7 HIV-1+ on ART with undetectable viremia (Supplementary Table 2). g, CD3−CD117+ ILC3s in rectosigmoid tissue from HIV-1− or HIV-1+ individuals on ART (Supplementary Table 1). White arrowheads, ILCs. Scale bar = 100 μm. h,i, As in g, percent ILC3s (h) and CD3−CD117+/CD3+CD117− (i) from 8 HIV-1− and 16 HIV-1+ on ART. j, MX1+ cells as in g. k, As in j, percent MX1+ as in h. l, MPO+ cells as in g. m, As in l, percent MPO+ cells as in h. n, CD127+ among Lin−CD56−CD16− PBMCs (HIV-1−), 16 hrs IL-15 with ruxolitinib (JAK1/2i, n=5), CP-690550 (JAK3i, n=11), rapamycin (RAPA, n=7), or no IL-15 (n=11). Data are mean ± s.e.m., a, e, f, h, i, k, m two-tailed unpaired t-test; n, two-tailed paired t-test. ns, not significant, *p<0.05, **p<0.01, ***p<0.001. g, j, l, three independent blocks for each donor with similar results.
Chronic systemic inflammation in HIV-1+ people has been associated with inappropriate translocation of bacterial products from the intestinal lumen1,2. Given the reduced number of ILCs in blood from HIV-1+ individuals, and the fact that lamina propria ILCs contribute to the maintenance of gut epithelial integrity3, the effect of HIV-1 infection on colon lamina propria ILCs was examined next. In HIV-1− controls, the majority of Lin−CD127+ colon ILCs were CD117+RORγT+ILC3s and capable of producing IL-22 in response to stimulation (Extended Data Fig. 1e,f). In HIV-1+ individuals on effective anti-HIV-1 therapy (participants described in Supplementary Table 2), colon lamina propria ILC3s were reduced in frequency (Fig. 1e,f and Extended Data Fig. 1g), despite undetectable viremia and no significant reduction in lamina propria CD4+ T cells (Extended Data Fig. 1h and Supplementary Table 2).
ILC3s in the gut of HIV-1+ individuals on ART were then assessed by immunohistochemistry. Compared with HIV-1− individuals, ILC3s were significantly decreased in rectosigmoid tissue from HIV-1+ individuals on ART, a reduction that was even more pronounced when ILC3s are normalized to total CD3+ T cells (Fig. 1g–i, Extended Data Fig. 1i and Supplementary Table 1). In samples from HIV-1+ people on ART, CD3+ T cells were observed within large inflammatory infiltrates that originated in the submucosa and extended through the muscularis mucosae to the lamina propria, at times reaching the epithelium (Fig. 1g); this was rarely observed in HIV-1− individuals. Moreover, cells that were positive for the type 1 interferon inducible protein MX1, or for the neutrophil marker myeloperoxidase (MPO), were increased in the gut of the HIV-1+ individuals on ART, consistent with ongoing pathogenic inflammation in the gastrointestinal tract despite anti-HIV-1 therapy (Fig. 1j–m and Supplementary Table 1).
ILCs do not express CD4 or CCR5, they do not bear these proteins on their surface, and they cannot be infected ex vivo by HIV-1 (Extended Data Fig. 1j)4. Reduction in ILCs is therefore unlikely to result from direct infection of these cells by HIV-1. To determine whether the decrease in CD127+ILCs associated with HIV-1 infection might be a consequence of systemic elevation in cytokines, inflammatory metabolites, or leakage of microbes across the intestinal epithelium1,2, the effect on Lin−CD127+PBMCs of exposure to these factors in vitro was assessed. No significant decrease in CD127 was observed after exposure to any of 4 cytokines (IL-6, IL-8, IL-10, or TNF), 3 chemokines (MCP-1, IP-10, or BCA-1), 4 Toll-like receptor (TLR) agonists (R848, poly I:C, Pam3CSK4, and LPS), or L-kynurinine (data not shown). However, as reported for T lymphocytes11, common γ-chain cytokines that are systemically elevated during HIV-1 infection1, including IL-2, IL-4, and IL-15, decreased the frequency of CD127+ cells (Fig. 1n and Extended Data Fig. 1k). A JAK3 inhibitor, CP-690550, prevented CD127 downregulation by IL-15 (Fig. 1n), consistent with a requirement for cytokine signaling via JAK312. Neither the JAK1/2-inhibitor ruxolitinib nor the mTOR-inhibitor rapamycin prevented CD127 downregulation (Fig. 1n). These results suggest that JAK3 signaling, in response to systemic elevation of common γ-chain cytokines, decreases ILCs in HIV-1 infection. This would deprive intestinal epithelium of homeostatic ILC3s, disrupt the integrity of the colon epithelium, and explain ongoing inflammation associated with HIV-1 infection (Extended Data Fig. 1).
HIV-1 infection increases the proportion of CD94+NK cells
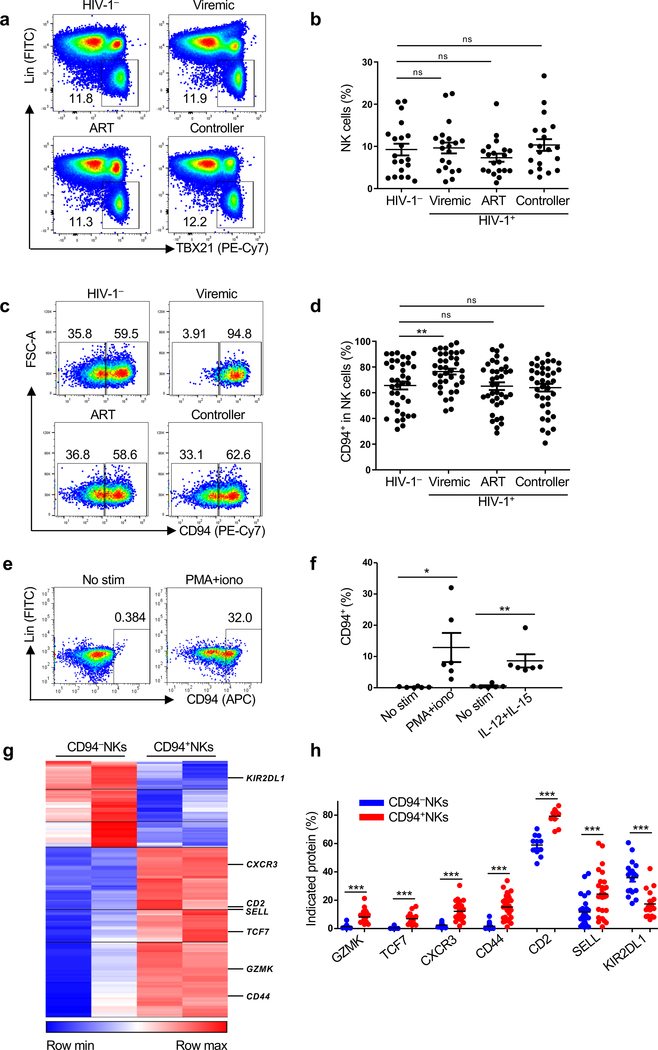
Total NK cells (Lin−TBX21+ PBMCs), including CD56+NK cells and the CD56−NK cells that have been reported to increase with HIV-1 infection13, were assessed from HIV-1− and HIV-1+ people who were either HIV-1 viremic, ART-suppressed, or spontaneous controllers of viremia who were not on ART (Supplementary Table 1). No significant difference in the percentage of total NK cells was observed among any of the HIV-1+ groups (Fig. 2a,b).
Fig. 2 |. HIV-1 infection increases the proportion of CD94+ NK cells.
a, Lin−TBX21+ NK cells from HIV-1−, HIV-1+ viremic, HIV-1+ ART suppressed, and HIV-1+ spontaneous controllers (cohort description in Supplementary Table 1). b, Percent NK cells as in a (n=20 for each group). c, CD94 on NK cells (Lin−CD56+) in PBMCs from HIV-1−, HIV-1+ viremic, HIV-1+ ART suppressed, and HIV-1+ spontaneous controllers (Supplementary Table 1). d, As in c, percent of CD94+NK cells among NK cells from HIV-1− (n=37), HIV-1+ viremic (n=38), HIV-1+ on ART (n=38), and HIV-1+ spontaneous controllers (n=38). e, Percent CD94+ cells after 16 hrs PMA/ionomycin stimulation of Lin−CD56+CD94−NK cells sorted from HIV-1− PBMCs. f, As in e, percent CD94+NK cells after 16 hrs stimulation with PMA/ionomycin or IL-12 and IL-15 (n=6). g, Heatmap of differentially expressed genes by RNA-Seq, sorted Lin−CD56+CD94− versus Lin−CD56+CD94+NK cells, from PBMCs of two HIV-1− donors (log2 fold change >1, p<0.05 determined by DESeq2). h, Percent indicated proteins encoded by differentially expressed genes in Lin−CD56+CD94− and Lin−CD56+CD94+ NK cells from HIV-1− PBMCs, as in g, GZMK (n=21), TCF7 (n=15), CXCR3 (n=27), CD44 (n=26), CD2 (n=11), SELL (n=27), KIR2DL1 (n=18). Data are mean ± s.e.m. b, d, two-tailed unpaired t-test; f, h, two-tailed paired t-test. ns, not significant, *p<0.05, **p<0.01, ***p<0.001.
CD94 is found on NK cell subsets with antiviral activity14 and associated with NK cell memory8. CD94+NK cells were significantly increased in PBMCs from HIV-1+ people who are not on ART (Fig. 2c,d and Supplementary Table 1). However, HIV-1+ people on ART, or people who spontaneously control viremia, had CD94 levels like HIV-1− individuals, indicating that ongoing viral replication, or inflammation associated with HIV-1 replication, contribute to the increase in CD94+NK cells (Fig. 2c,d).
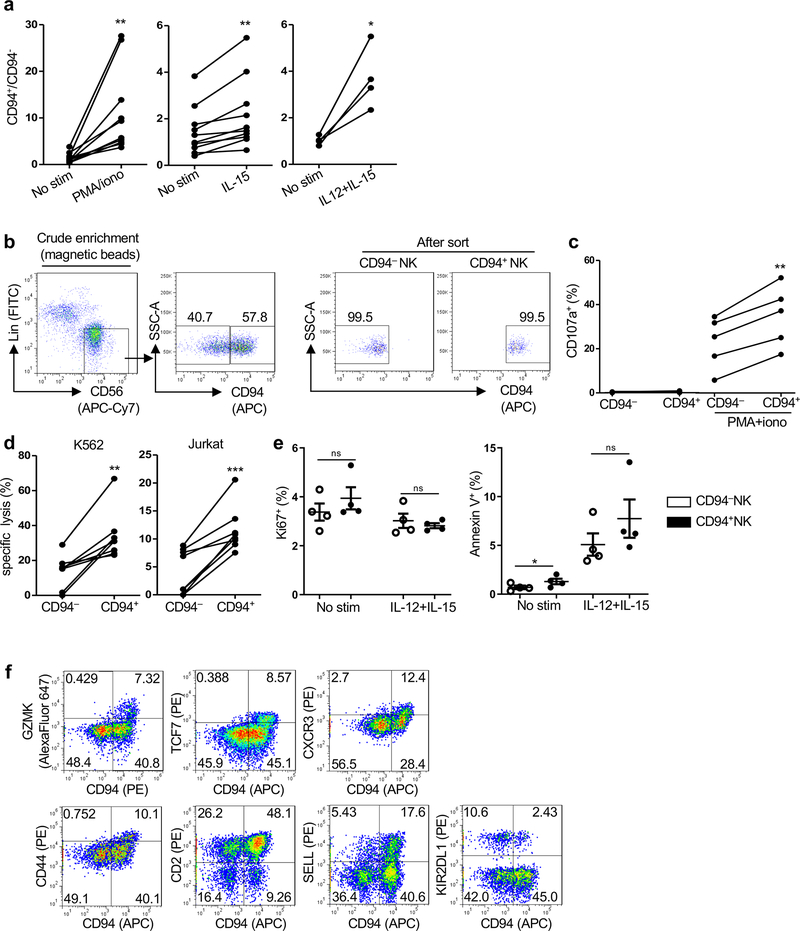
Stimulation of PBMCs from anonymous HIV-1− blood donors, with either PMA and ionomycin, or IL-15 that is upregulated in HIV-1 infection, or with IL-15 plus IL-12, increased the ratio of CD94+ to CD94−NK cells, similar to that observed in the blood of HIV-1+ people (Extended Data Fig. 2a). When CD94−NK cells were sorted (Lin−CD56+CD94−PBMCs in Extended Data Fig. 2b), CD94 levels increased in response to stimulation with PMA and ionomycin, or IL-12 and IL-15 (Fig. 2e,f). When stimulated with PMA and ionomycin, CD94+NK cells showed higher degranulation activity (Extended Data Fig. 2c). In the absence of stimulation, sorted CD94+NK cells had greater cytolytic activity than did CD94−NK cells (Extended Data Fig. 2d). Levels of Ki-67 and Annexin V were comparable on the CD94− and CD94+NK cells after stimulation, suggesting that the perturbed ratio of these cells in vivo did not result from intrinsic differences in rates of proliferation or apoptosis (Extended Data Fig. 2e).
TCF7 expression tracks with pseudotime trajectory from CD94−CD56dimNK cells to CD94+CD56hiNK cells
To better understand the molecular basis for the increase in CD94+NK cells associated with HIV-1 infection, transcriptional profiles were obtained using sorted CD94− and CD94+ NK cells from HIV-1− anonymous blood donors (Lin−CD56+CD94− and Lin−CD56+CD94+ PBMCs as in Extended Data Fig. 2b). RNA-Seq revealed 210 genes that are differentially expressed in the two NK cell populations (Fig. 2g and Supplementary Table 3). Proteins encoded by differentially expressed genes that the literature indicates are important for NK cell function are highlighted in the heatmap (Fig. 2g) and were confirmed by flow cytometry (Fig. 2h and Extended Data Fig. 2f): CD94+NK cells expressed higher levels of GZMK, TCF7, CXCR3, CD44, CD2 and SELL, the biological functions of which include NK cell survival15, activation16,17, and memory18,19. In contrast, gene expression and surface protein levels of KIR2DL1, an HLA-Cw4 ligand that inhibits NK cell cytotoxicity20, were increased on CD94−NK cells (Fig. 2h and Extended Data Fig. 2f).
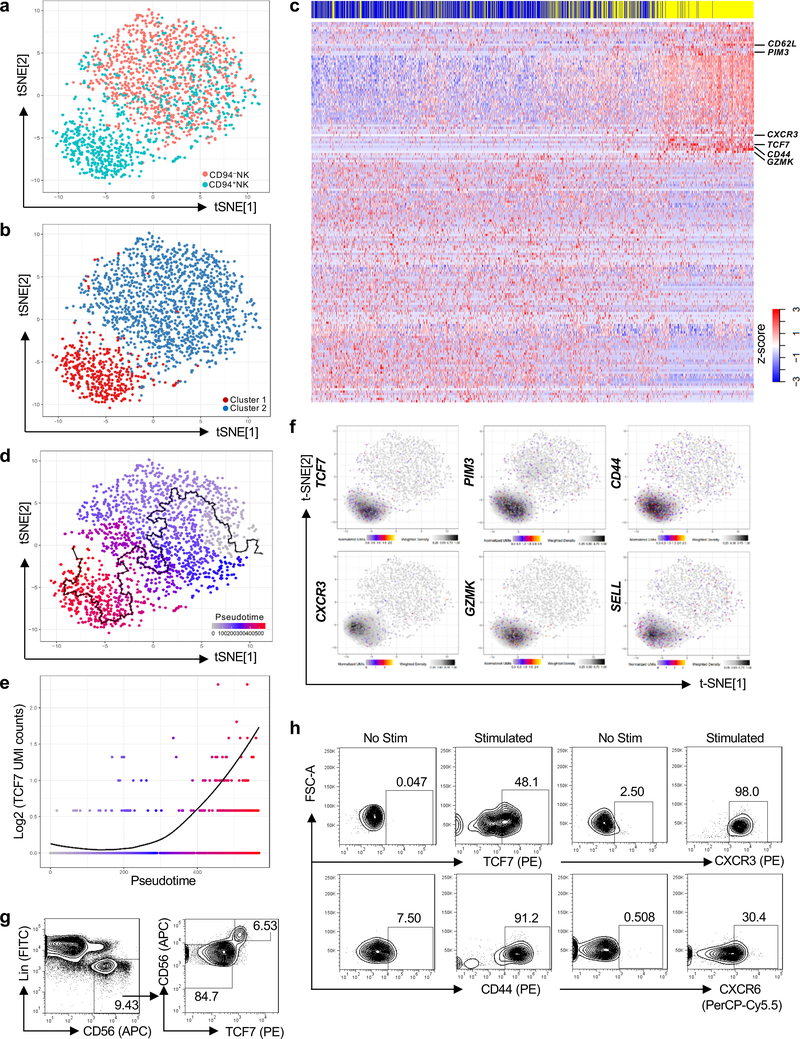
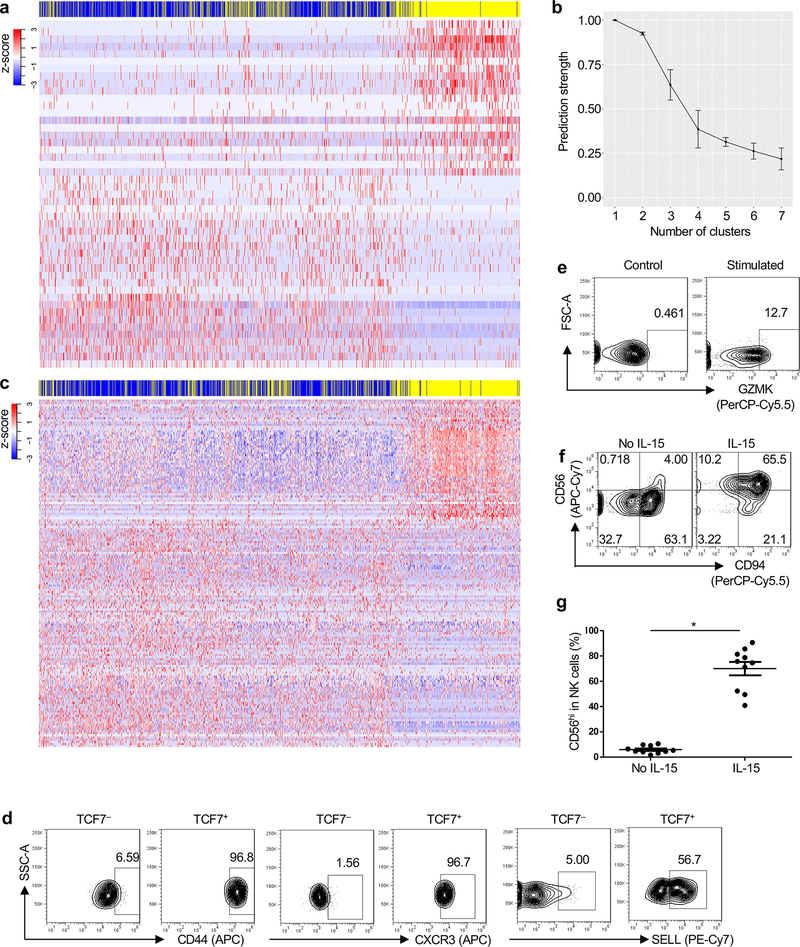
Transcriptomes across the spectrum from CD94−NK to CD94+NK cells sorted from HIV-1− PBMCs were then captured by single-cell RNA-Seq (scRNA-Seq) (Fig. 3a, Extended Data Fig. 3a and Supplementary Table 4)21. Based on the analysis of the 3,277 single cell transcriptomes, CD94−NK cells formed a homogeneous population (Fig. 3a, pink dots in upper right). CD94+NK cells formed two populations, one of which overlapped with CD94−NK cells (Fig. 3a, aqua dots, upper right). Unbiased clustering of total Lin−CD56+ PBMCs, irrespective of whether a cell was CD94+, also showed two distinct cell populations (Fig. 3b). The validity of clustering cells into two groups was confirmed by calculating prediction strength as a function of cluster number22 (Extended Data Fig. 3b). Cluster 1 was relatively homogeneous, consisting of 396 CD94+NK cells and only 13 CD94−NK cells (Fig.3b, red dots lower left). Cluster 2 contained 371 CD94+NK cells and 973 CD94−NK cells (Fig. 3b, blue dots, upper right). A heatmap based on all differentially expressed genes between the two clusters showed a shift in the pattern of gene expression along the continuum of CD94 expression (see blue and yellow bars at the top of Fig. 3c and Supplementary Table 5).
Fig. 3 |. TCF7 expression correlates with pseudotime trajectory from CD94−NK cells to CD94+NK Cells.
a, Two-dimensional tSNE plot of single cell RNA-Seq of 986 Lin−CD56+CD94−NK cells (pink) and 767 Lin−CD56+CD94+NK cells (aqua), sorted from HIV-1− blood. Data are representative of 2 donors. b, Spectral clustering of single cell transcriptomes from all cells in a, independent of CD94, k-nearest neighbor, search=2. c, Heatmap of 1,729 CD94−NK cells (blue) and 1,548 CD94+NK cells (yellow), sorted from 2 HIV-1− anonymous blood donors, using all differentially expressed genes from the spectral cluster analysis. d, Minimum spanning tree based on the transcriptome of individual cells from a, showing pseudotime trajectory (black line). e, TCF7 expression along the pseudotime trajectory. f, Expression and density of the indicated genes within t-SNE plots. g, Flow cytometry for CD56 and TCF7 on Lin− PBMCs. h, Sorted CD94−NK cells were untreated (No Stim) or treated with IL-15 (5 ng/ml) for 5 days, and IL-12 (50 ng/ml) and IL-15 (50 ng/ml) for 16 hrs (Stimulated). TCF7, CD44, CXCR3, and CXCR6 were detected by flow cytometry. TCF7, representative of 8 donors; CD44, CXCR3, and CXCR6, representative of 4 HIV-1− donors. All data were generated using blood from HIV-1− donors.
To determine whether heterogeneity in the individual CD94+NK cell transcriptomes reflected different stages in the CD94− to CD94+NK cell transition, a minimum spanning tree based on individual cell transcriptomes was constructed using Monocle23 (Fig. 3d). A heatmap utilizing the pseudotime ordering of single cells, based on the minimum spanning tree (Extended Data Fig. 3c), mimicked the heatmap ordered by hierarchical clustering (Fig. 3c), validating the ordering of cells along the transcriptional timeline assigned by the minimum spanning tree.
Genes with potential to regulate the transition from CD94−NK to CD94+NK cells were identified by differential expression analysis based on the pseudotemporal ordering of cells from the minimum spanning tree. Candidate genes included TCF7 (Fig. 3e,f, false discovery rate p < 7 × 10−103), a transcription factor activated by WNT-signaling that is important for early T cell, NK cell and ILC development, T cell memory establishment and maintenance24–26, PIM3, a serine-threonine kinase that blocks apoptosis and promotes self-renewal27, CD44, a gene important for T cell survival and establishment of memory cells28, CXCR3 and GZMK, genes highly expressed in memory CD8+ T cells 29, and SELL, a marker for NK cells with potential to proliferate and differentiate into effectors upon secondary stimulation19 (Fig. 3f). When examined by flow cytometry, TCF7+NK cells from HIV-1− blood donors were exclusively CD56hi, a marker for NK cells with high capacity for cytokine production and proliferation30. CD44, SELL, and CXCR3 were also enriched in the TCF7+NK cells (Fig. 3g and Extended Data Fig. 3d).
When total PBMCs or sorted CD94−NK cells from HIV-1− blood donors were treated with IL-15, or with IL-12 + IL15, CD94 was upregulated within 16 hrs (Fig. 2f and Extended Data Fig. 2a). After 5 days of IL-15 treatment, TCF7, CXCR3, CD44, GZMK and CD56 were upregulated (Fig. 3h and Extended Data Fig. 3e–g). CXCR6, a gene required for memory NK cell generation in response to haptens and viruses31 was also upregulated (Fig. 3h). These experiments in which cells are stimulated directly ex vivo substantiate the pseudotime analysis of the scRNA-Seq data, demonstrate that CD94+CD56hiNK cells are generated from CD94−CD56dimNK cells in response to inflammatory cytokines, and suggest that the expanded CD94+NK cell population in blood from HIV-1+ people results from elevated inflammatory cytokines.
Distinct chromatin landscape of CD94+CD56hiNK cells
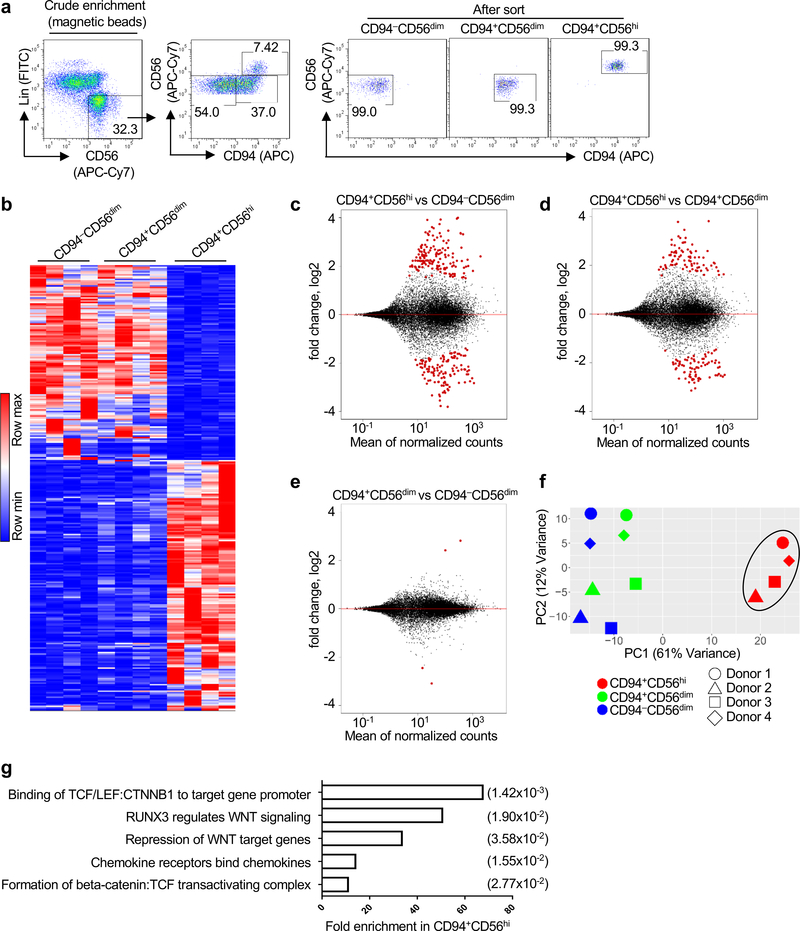
To further investigate the TCF7+CD56hi subset of CD94+NK cells identified above (Fig. 3b,f,g), CD94−CD56dim, CD94+CD56dim, and CD94+CD56hiNK cells were sorted from HIV-1− blood donors (Fig. 4a) and subjected to RNA-Seq. The transcriptional profile of CD94+CD56hiNK cells was distinct from that of either CD94−CD56dim or CD94+CD56dim cells (Fig. 4b), with 275 and 162 differentially expressed genes, respectively (Fig. 4c,d and Supplementary Table 6). In contrast, only 4 genes distinguished CD94+CD56dim from CD94−CD56dimNK cells (Fig. 4e and Supplementary Table 6). Principal component analysis (PCA) revealed the CD94+CD56hiNK cell transcriptome to be a cluster distinct from the transcriptomes of the other NK cell subsets (Fig. 4f), and reactome pathway analysis showed it to be enriched for WNT signaling and TCF7 (Fig. 4g).
Fig. 4 |. TCF and WNT signaling pathway enrichment in CD94+CD56hiNK cells.
a, Sorting strategy for CD94−CD56dim, CD94+CD56dim, and CD94+CD56hi NK cell subsets.
b, Heatmap of differentially expressed genes by RNA-Seq (fold change of normalized counts, log2 >1, p<0.05 determined by DESeq2) for the indicated NK cell subsets sorted from four HIV-1− blood donors. c-e, Pairwise comparison of the indicated NK cell subsets based on differentially expressed genes. f, PCA based on RNA-Seq data from the indicated NK cell subsets. g, Reactome pathway analysis based on 152 differentially expressed genes in CD94+CD56hi NK cells. GENEONTOLOGY produces p value from Fisher’s exact test, followed by BH false discovery rate (in parentheses). All data were generated using blood from HIV-1− donors.
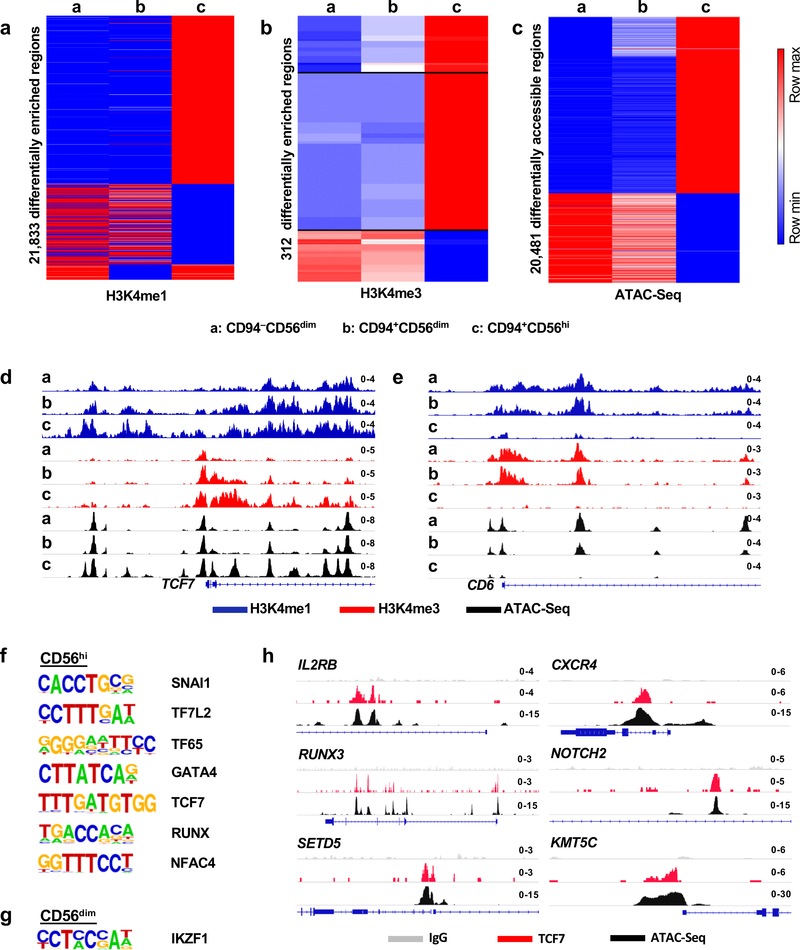
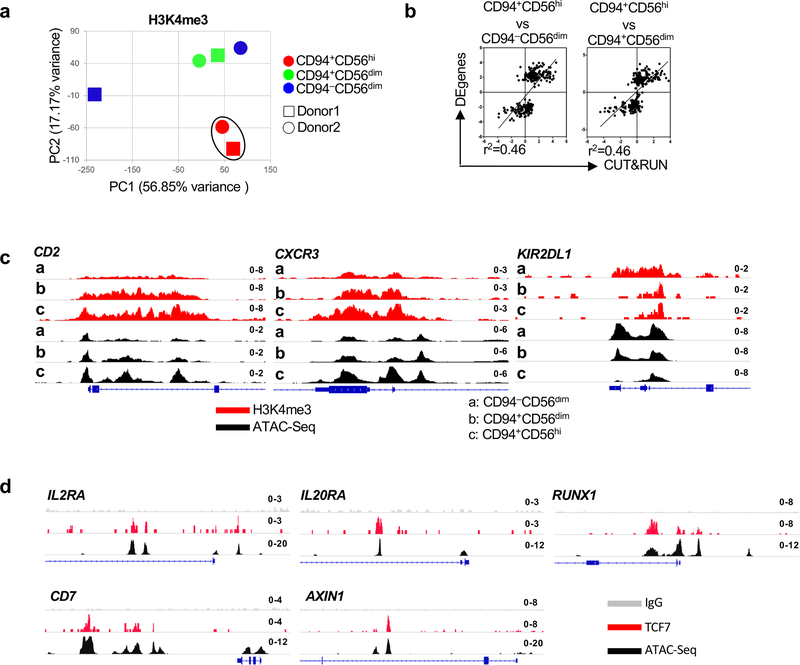
In addition to having a unique transcriptional profile, CD94+CD56hiNK cells had histone marks associated with transcriptional activation and accessible chromatin in chromosomal locations distinct from those in the other two NK cell subsets (Fig. 5a–c and Extended Data Figs. 4a,b). The chromatin landscape for representative genes, including TCF7, a gene uniquely expressed in the CD94+CD56hiNK subset, and for CD6, a gene only expressed in CD56dim NK cells, are shown (Fig. 5d,e and Extended Data Fig. 4c). De novo motif analysis showed enrichment for TCF7, RUNX, NK-кB, and four other DNA binding motifs within the accessible chromatin regions that were unique to CD94+CD56hiNK cells (Fig. 5f). In contrast, the IKZF1 binding motif was enriched within both CD56dimNK cell subsets (Fig. 5g). TCF7 binding peaks mapped to 255 CD94+CD56hiNK cell ATAC-Seq peaks located within genes encoding cytokine receptors IL2RA, IL2RB, and IL20RA, transcription factors RUNX1, RUNX3, and NOTCH2, chromatin modifiers SETD5 and KMT5C, and the WNT signaling regulator AXIN1 (Fig. 5h and Extended Data Fig. 4d). These transcriptional and epigenetic profiles indicate that, among NK cells, CD94+CD56hiNK cells constitute a developmentally discrete subset, and that TCF7 is critical for the establishment of this population.
Fig. 5 |. Distinct chromatin landscape in CD94+CD56hi NK cells.
a-c, Heatmap showing differential enrichment (>2 fold change of normalized counts) for H3K4me1 (a) and H3K4me3 (b) by CUT&RUN, or accessible chromatin by ATAC-Seq (c), in sorted CD94−CD56dim, CD94+CD56dim, and CD94+CD56hi NK cell subsets. Data is representative of two HIV-1− blood donors. d,e, H3K4me1, H3K4me3, and ATAC-Seq signal on TCF7 (d) and CD6 (e), in the indicated NK cell subsets. f,g, De novo analysis of transcription factor binding motifs enriched in open chromatin from CD56hi NK cells (f), or CD56dim NK cells (g), using HOMER. h, ATAC-Seq and TCF7 CUT&RUN signal at the indicated loci from the three NK cell subsets. All data were generated using blood from HIV-1− anonymous donors.
CD94+CD56hiNK cells are bona-fide memory lymphocytes
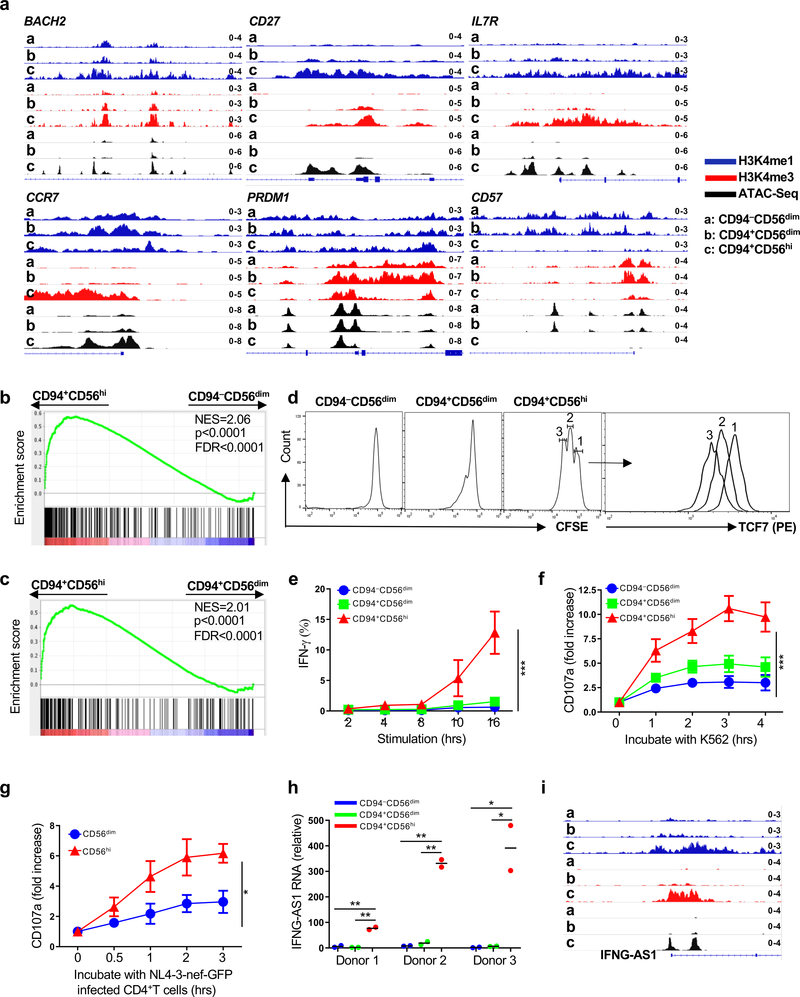
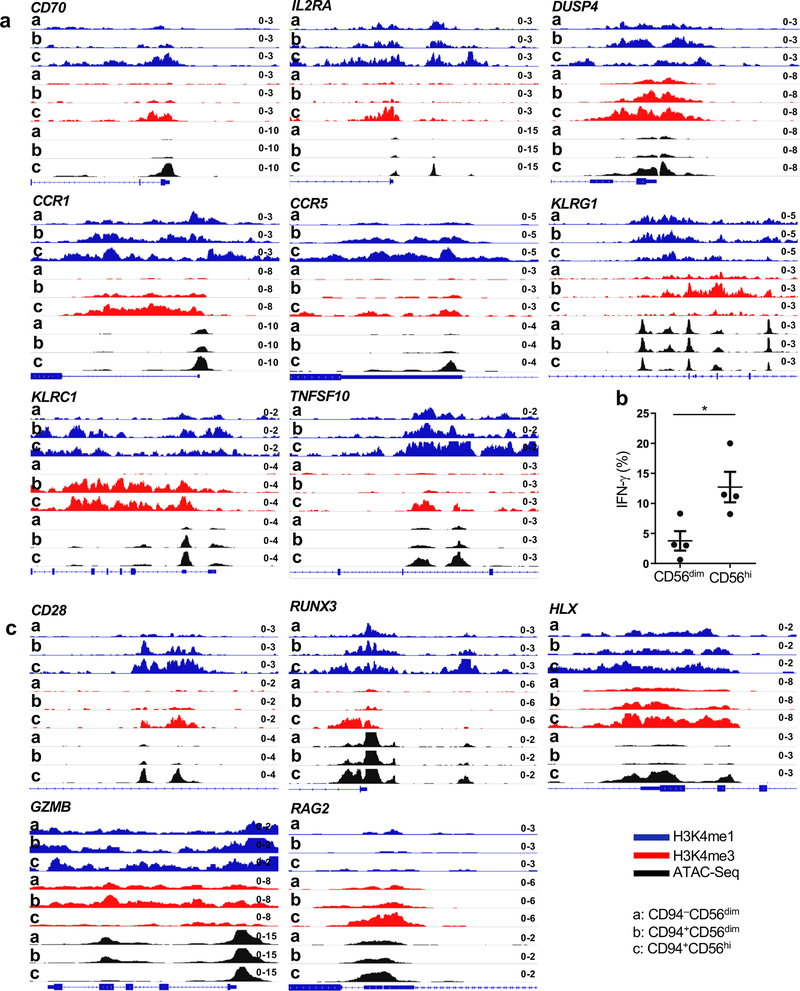
CD94+CD56hi NK cells were enriched for transcripts associated with lymphocyte memory (Fig. 3f, Fig. 4b–d and Supplementary Table 6), including TCF7, CD44, SELL, CD70, IL7R, CCR1, CCR5, CCR7, BACH2, and DUSP425,28,29,32. Chromatin accessibility and the density of H3K4me1 and H3K4me3 at these loci demonstrated that these genes were specifically remodeled for heightened expression in the CD94+CD56hiNK cell subset (Fig. 5d, Fig. 6a, and Extended Data Fig. 5a). In contrast, chromatin features at genes typical of effector lymphocytes, including PRDM1, CD57, and KLRG133–35, indicated increased expression in CD56dimNK cell subsets (Fig. 6a and Extended Data Fig. 5a). Consistent with the discrete developmental stages revealed by the analysis of chromatin, pairwise comparison of the three NK cell subsets showed that only CD94+CD56hiNK cells were enriched for transcripts that distinguish CD8+ memory T cells (GSE9650; Fig. 6b,c and Supplementary Table 7,8)36.
Fig. 6 |. Chromatin, transcriptome, and phenotype define CD94+CD56hi NK cells as memory cells.
a, CUT&RUN and ATAC-Seq showing memory gene-associated loci in sorted CD94−CD56dim, CD94+CD56dim, and CD94+CD56hi NK cells. b,c, Gene set enrichment analysis comparing memory CD8+ T cell expression signature (GSE9650) with sorted CD94+CD56hi and CD94−CD56dim NK cells (b), or with sorted CD94+CD56hi and CD94+CD56dim NK cells (c). p value and FDR determined using GSEAPreranked module from GenePattern with 1000 permutations. d, Sorted NK cells labelled with CFSE and cultured 5 days in IL-15 (5 ng/ml). CFSE and TCF7 detected by flow cytometry. e, Percent IFN-γ+ cells by flow cytometry after stimulation of sorted NK cell populations with IL-12 and IL-15 (n=4). f, Fold increase of surface CD107a on bead-enriched NK cells after incubation with K562 cells (n=4). g, bead-enriched NK cells incubated with IL-15 (5ng/ml) for 5 days, then with NL4-3-nef-GFP infected CD4+ T cells. Fold increase of surface CD107a on indicated NK populations, as in f (0h, n=5; 0.5h, 1h, 2h, n=3; 3h, n=5). h, IFNG-AS1 expression relative to GAPDH by RT-qPCR for the indicated NK cell populations sorted from 3 donors. Each population contains 2 technical replicates. i, IFNG-AS1 chromatin analysis as in a. Data are mean ± s.e.m. e-g, two-way ANOVA; h, two-tailed unpaired t-test. *p<0.05, **p<0.01, ***p<0.001. All data were generated using blood from HIV-1− anonymous donors.
As expected for memory T lymphocytes, stimulation of CD94+CD56hiNK cells revealed a higher capacity for cytokine-induced proliferation, IFN-γ production, and degranulation in response to either K562 or HIV-1-infected CD4+ T cells, than was observed with the CD56dimNK cell subsets (Fig. 6d–g and Extended Data Fig. 5b). TCF7 was downregulated on sorted CD94+CD56hi NK cells that had undergone multiple rounds of replication in response to stimulation (Fig. 6d), as reported for the transition to effector cell phenotype that follows stimulation of memory CD8+ T cells24,37. IFNG-AS1, a long noncoding RNA required for epigenetic activation of IFN-γ production38,39 was expressed from 30 to 200 times higher in CD94+CD56hi NK cells than in the CD56dim NK cell subsets (Fig. 6h). The chromatin structure at the IFNG-AS1 locus, as well as at other genes contributing to IFN-γ induction, including CD28, RUNX3, HLX, GZMB, and RAG2 (Fig. 6i and Extended Data Fig. 5c)40,41, indicates that robust IFN-γ production by CD94+CD56hi NK cells in response to stimulation is a developmental adaptation characteristic of memory lymphocytes.
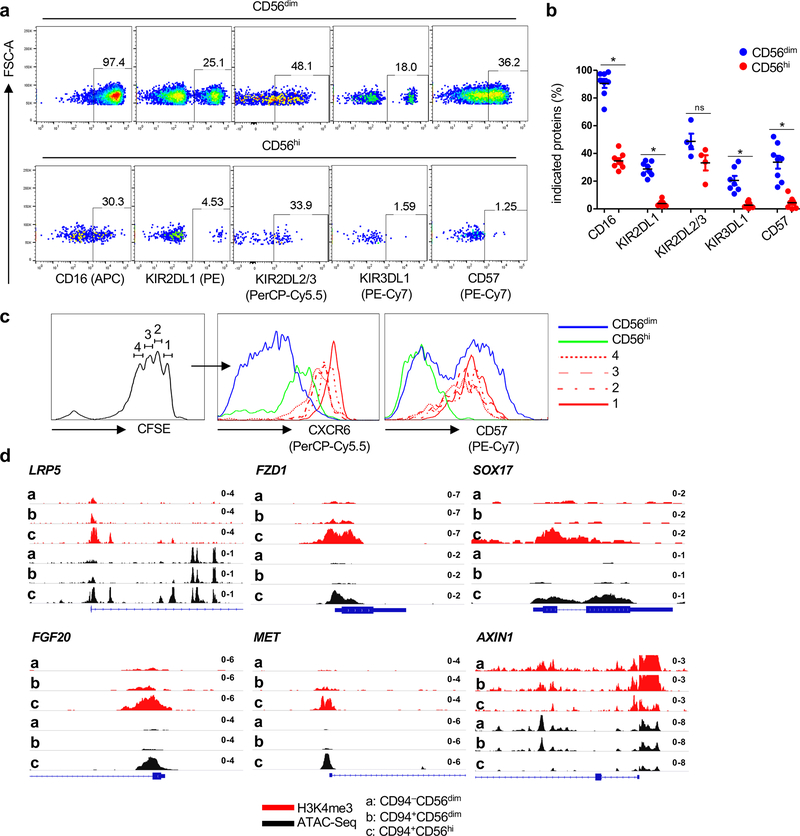
By flow cytometry, CD94+CD56hiNK cells have higher levels of the memory NK cell marker CXCR631, but lower levels of CD16, the effector and senescence marker CD57, and the inhibitory receptors KIR2DL1, KIR3DL142 (Extended Data Fig. 6a–c). The central memory character of CD56hiNK cells is also suggested by the fact that these cells proliferate and upregulate CD57 in response to inflammatory cytokines (Extended Data Fig. 6c). These results demonstrate that, as well as exhibiting typical memory features at the chromatin and transcriptional level, CD94+CD56hiNK cells functionally mimic memory T cells.
WNT signaling and TCF7 are required for establishment of NK cell memory
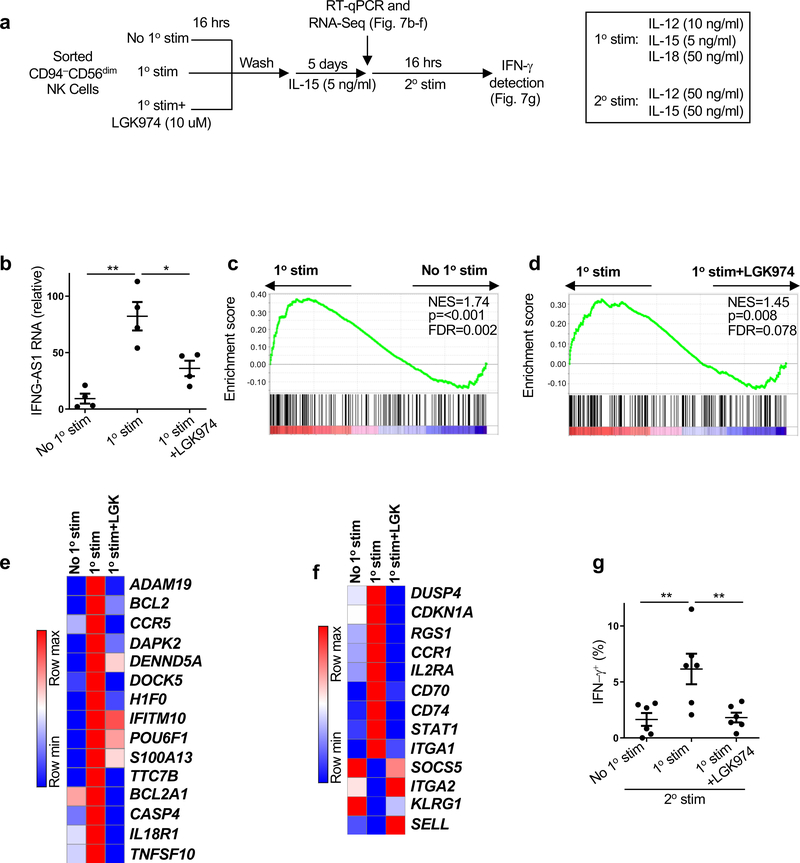
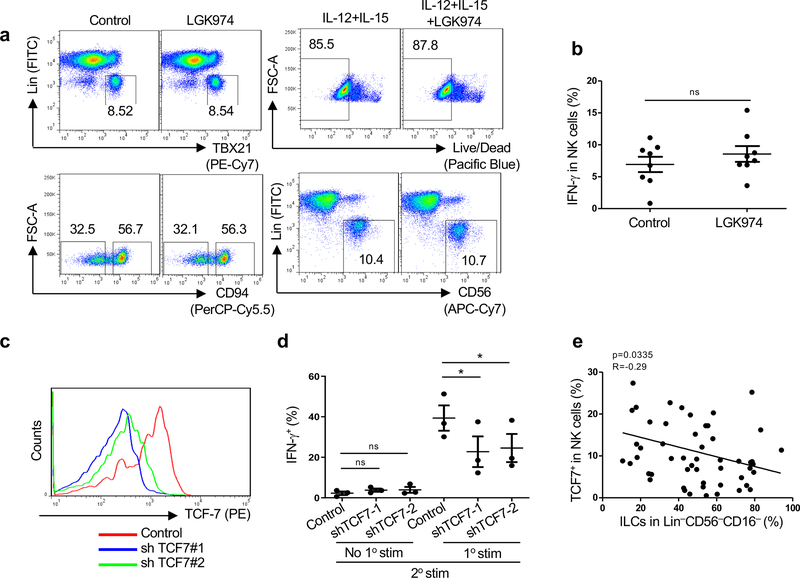
The requirement for WNT signaling and TCF7 for establishment of CD94+CD56hi NK memory cells was examined next (Fig. 3e–h, Fig. 4g, Fig. 5d,f,h, Extended Data Fig. 4d and Extended Data Fig. 6d). First, the effect of pharmacologic inhibition of WNT signaling on the generation of memory cells from sorted CD94−CD56dimNK cells was assessed using established methods (Fig. 7a)43,44. In response to primary stimulation with IL-12, IL-15, and IL-18 for 16 hrs, followed by 5 days rest in low dose IL-15 alone, CD94−CD56dimNK cells upregulated IFNG-AS1 (Fig. 7b) and acquired a global transcriptional profile characteristic of CD8+ memory T cells (as determined by comparison with GSE9650; Fig. 7c–e and Supplementary Table 9,10)36. Upregulated genes not identified in the GSE9650 data, but that other datasets indicate are typical of memory lymphocytes, included DUSP4, CDKN1A, RGS1, CCR1, IL2RA, CD70, CD74, STAT1 and ITGA1 (Fig. 7f)8,29,36,45–47. Downregulated genes characteristic of naive or effector lymphocytes included SELL, ITGA2, and KLRG1 (Fig. 7f). All of these effects on stimulated CD94−CD56dimNK cells were prevented if the WNT signaling inhibitor LGK974 was present in the culture (Fig. 7b–f). No toxicity was detected with LGK974 for up to eight days in culture, with or without stimulation, and the drug had no effect on CD94 levels in the absence of stimulation (Extended Data Fig. 7a) or on IFN-γ production in response to primary stimulation (Extended Data Fig. 7b). Importantly, the heightened IFN-γ production in response to secondary stimulation was inhibited by LGK974 or by knockdown of TCF7 (Fig. 7g and Extended Data Fig. 7c,d). These results demonstrate that WNT and TCF7 signaling are required for establishment of memory after primary stimulation of CD94−CD56dimNK cells.
Fig. 7 |. WNT inhibition blocks cytokine induced NK memory response.
a, Experimental scheme for generation of memory NK cells ex vivo from sorted CD94−CD56dimNK cells. b, IFNG-AS1 expression relative to GAPDH by RT-qPCR using RNA extracted from sorted CD94−CD56dim NK cells just prior to secondary stimulation, after primary stimulation, and resting in low dose IL-15 (n=4). c,d, Gene set enrichment analysis (GSEA) comparing CD8+ memory T cell expression signature (GSE9650) by RNA-Seq from sorted CD94−CD56dim NK cells using RNA harvested as in b. p value and FDR determined using GSEAPreranked module from GenePattern with 1000 permutations. e, Heatmap of memory related genes by RNA-Seq that were also found in GSEA list (Supplementary Table 9,10). Fold change of normalized counts Log2>0.5, n=2. f, Heatmap of genes by RNA-Seq that distinguish memory from effector or naive cells reported by literature but that were not identified in GSEA list. Fold change of normalized counts Log2>0.5, n=2. g, Percent IFN-γ+ from sorted CD94−CD56dimNK cells after secondary stimulation. Data are mean ± s.e.m.; two-tailed paired t-test; *p<0.05, **p<0.01. All samples used were from HIV-1− anonymous blood donors.
Expansion of TCF7+NK cells in HIV-1 infection
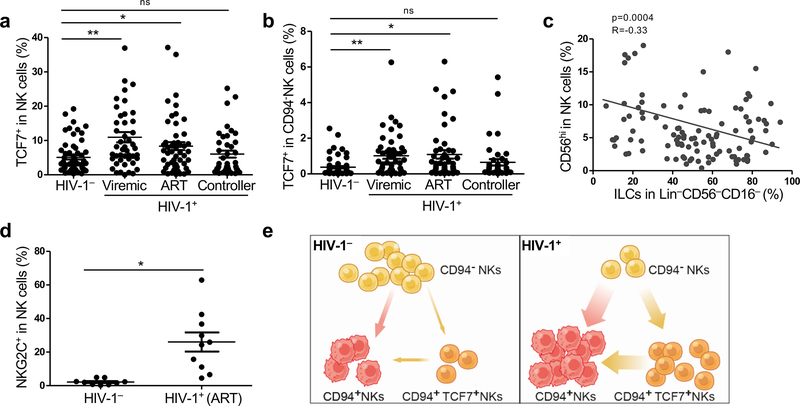
Finally, the effect of HIV-1 on the percentage of TCF7+NK cells in blood was assessed. As compared with HIV-1− individuals, TCF7+NK cells were significantly upregulated in HIV-1 viremic and ART suppressed individuals, but not in spontaneous controllers (Fig. 8a and Supplementary Table 1,2). These results indicate that TCF7+NK cells may be increased due to the inflammation that persists despite suppression of viremia by ART, and that these cells may themselves contribute to the ongoing inflammation under these conditions. In contrast to HIV-1− people, in whom TCF7 was almost exclusively expressed in CD94+CD56hiNK cells (Fig. 3f,g), HIV-1+ individuals with uncontrolled viremia or under ART also had increased TCF7 levels on CD94−CD56dim NK cells (Fig. 8b and Supplementary Table 1,2). The percentage of either CD56hiNK cells or of TCF7+NK cells correlated inversely with the percentage of blood ILCs, indicating that HIV-1-associated inflammation had opposite effects on NK cells and ILCs (Fig. 8c, Extended Data Fig. 7e and Supplementary Table 1). A similar increase with HIV-1 infection was observed for another memory NK marker, NKG2C (Fig. 8d and Supplementary Table 2). Analogous to the expansion of memory T cells associated with the chronic inflammation that accompanies HIV-1 infection1, CD94+NK cells and CD94+TCF7+ memory NK cells are both likely to have expanded from CD94−NK cells in response to the elevated systemic cytokines that accompany HIV-1 infection (Fig. 8e).
Fig. 8 |. Expansion of TCF7+NK cells during HIV-1 infection.
a, Percent TCF7+NK cells among Lin−CD56+ PBMCs in HIV-1− (n=60), HIV-1+ viremic (n=46), HIV-1+ on ART (n=50), and HIV-1+ spontaneous controllers (n=40). Cohort characteristics described in Supplementary Table 1,2. b, Percent TCF7+NK cells from Lin−CD56+CD94−NK subsets of HIV-1− (n=61), HIV-1+ viremic (n=49), HIV-1+ on ART (n=57), and HIV-1+ spontaneous controllers (n=40) (Supplementary Table 1,2) c, Correlation of ILCs with CD56hiNK cells. Samples are detected from HIV-1+ viremic individuals, ART suppressed HIV-1+ individuals (ART), and HIV-1+ individuals who spontaneously control viremia without ART (Supplementary Table 1) (n=113). The correlation coefficient (R) was determined by Pearson, p value for the slope being zero was determined by the F-test. d, Percent NKG2C on Lin−CD56+ PBMCs from HIV-1− (n=9) and HIV-1+ (n=10, under ART) individuals (Supplementary Table 2). e, Model for effect of HIV-1 infection on NK cell subsets. Data are mean ± s.e.m.; a, b and d, two-tailed unpaired t-test. ns, not significant, *p<0.01, **p<0.001.
Discussion
ART suppresses HIV-1 viremia, preserves CD4+ T cells, and prevents progression to AIDS. Nonetheless, non-AIDS inflammatory pathology has been observed in such individuals1. This inflammation has been attributed to disruption of the intestinal epithelium2, the integrity of which is maintained by homeostatic cytokines produced by lamina propria CD4+TH17 cells and ILC3s. Experiments here, with tissues from HIV-1+ people on ART with undetectable viremia, demonstrate reduced ILC3s, neutrophil infiltration, and MX1+ cells in the intestine, and elevated plasma sCD14. Given that blood ILCs are disrupted soon after HIV-1 infection4, it is likely that colon lamina propria ILCs are also depleted during acute HIV-1 infection, with attendant loss of epithelial barrier function, and chronic inflammation despite pharmacologic suppression of viremia.
ILCs do not express CD4 or CCR5, the essential HIV-1 entry receptors, and infection of ILCs ex vivo is undetectable with either CCR5-tropic or CXCR4-tropic HIV-14. It is therefore more likely that ILCs are eliminated by stimulation with the common γ-chain cytokines associated with acute HIV-1 infection1, rather than by direct HIV-1 infection. In contrast to the CD4+ T cell recovery often observed with ART, ILC reduction appears permanent, perhaps due to ablation of a dedicated ILC precursor. Alternatively, ILC depletion might be an ongoing response to inflammation that could be interrupted with JAK3 inhibitors like the one used here to protect ILCs from cytokine stimulation ex vivo.
CD94+NKG2C+NK cells were increased in HIV-1-infected people, but the total percentage of NK cells among PBMCs was not altered by HIV-1, demonstrating that CD94+NK cells increase at the expense of CD94−NK cells. Pseudotime analysis of single cell transcriptomes mapped a TCF7-dependent trajectory from CD94−NK cells to CD94+NK cells and stimulation of CD94−NK cells ex vivo gave rise to a homogeneous population of CD94+TCF7+NK cells, indicating that the increase in CD94+NK cells is in response to HIV-1 associated inflammation. The inverse correlation between TCF7+CD56hiNK cells and ILCs indicates that the expansion of TCF7+CD56hiNK cells in HIV-1+ individuals may occur secondary to the inflammation that results from loss of gut-resident, homeostatic ILC3s.
The CD94+TCF7+CD56hiNK cells expanded with HIV-1 infection satisfy criteria for bona-fide memory cells, including increased rates of proliferation and production of cytokines, though, unlike memory NK cells in HCMV infection they did not bear markers typical of senescence or effector function, such as CD57, PRDM1, and KLRG18. Instead, global assessment of transcription, chromatin marks, and chromatin accessibility, and the magnitude and kinetics of cytokine production, and of degranulation in response to stimulation with K562 cells or HIV-1-infected CD4+ T cells, showed that, these CD94+TCF7+CD56hi NK cells resemble memory T cells, save the lack of clonotypic antigen receptors.
TCF7 is required for establishment and maintenance of memory T cells25. In a similar fashion, TCF7 was demonstrated here to be required for establishment and maintenance of memory NK cells. TCF7 may act as a transcription factor in the WNT signaling pathway or as a histone deacetylase48. The fact that the TCF7 knockdown and the WNT-inhibitor had similar phenotypes, indicate that, by acting as a transcription factor in the WNT signaling pathway, TCF7 is an essential regulator of a memory state in NK cells.
The NKG2C+CD94+CD56hiTCF7+NK cells that are increased with HIV-1 infection may provide necessary antiviral protection. People who inherit a deletion in the gene encoding NKG2C are at greater risk of HIV-1 infection, and have higher pretreatment viral loads and faster disease progression49. Specific KIR and HLA genotype combinations influence rates of HIV-1 acquisition and disease progression, perhaps due to KIR-mediated NK cell licencing or recognition of HIV-1-derived peptides by non-clonotypic receptors. Interestingly, high percentage of CD56hiNK cells has been associated with nearly undetectable viral load50, suggesting that TCF7+NKG2C+CD94+CD56hiNK cells can control HIV-1. Better understanding of these memory NK cells is hoped to lead to new approaches for preventing and controlling HIV-1 and other infections.
Methods
Clinical samples
Blood, plasma samples, and PFA-fixed and paraffin-embedded rectosigmoid tissues blocks, were from the University of California San Francisco SCOPE Cohort. Individuals in the SCOPE Cohort included HIV-1−, HIV-1+ viremic, HIV-1+ on ART, and HIV-1+ controllers, the clinical characteristics of which are provided in Supplementary Table 1. Blood and colon samples were also from the Translational Medicine Core of the University of Massachusetts Center for AIDS Research Cohort. Clinical characteristics of these individuals are described in Supplementary Table 2. The clinical cohort used for each specific experiment is indicated in the Results and in the Figure Legends.
All human blood and colon samples were collected from participants who had provided written informed consent for protocols that included study of cellular immunity in HIV-1 infection, in accordance with procedures approved by the University of Massachusetts Medical School (UMMS) and the University of California, San Francisco (UCSF) Institutional Review Boards. Routine screening colonoscopy was scheduled as medically indicated at UMMS. HIV-1− control individuals undergoing colonoscopy the same day were matched for gender and age. In pilot experiments, multiple biopsies of different segments of the bowel were taken in two individuals and no significant differences in ILC populations along the length of the bowel were found. Subsequent sampling was therefore from the more easily accessible descending colon only. All study participants were consented the day of the procedure. All blood and colon samples collected at UMMS were included in the data analysis. All blood and plasma samples from UCSF were tested blindly with the code broken after analysis and no samples were excluded from the analysis. For PFA-fixed and paraffin-embedded rectosigmoid tissues blocks from UCSF, all samples were tested blindly with the code broken after analysis, and samples with small tissue size or high variability in tissue autofluorescence were excluded prior to breaking the code.
Human mononuclear cell isolation
Human peripheral blood was diluted with an equal volume of RPMI-1640 (Gibco), overlaid on Histopaque (Sigma), and centrifuged at 500 × g for 30 minutes at room temperature. Mononuclear cells were washed 3 times with MACS buffer (0.5% BSA and 2 mM EDTA in PBS) and either used immediately or frozen in FBS containing 10% DMSO.
Lineage antibodies
Antibodies against CD3, CD4, TCRαβ, TCRγδ, CD19, CD20, CD22, CD34, FcεRIα, CD11c, CD303, CD123, CD1a, and CD14 were used to exclude lineage positive cells for NK cell detection. To detect ILCs, antibodies against CD56 and CD16 were added to the above lineage panel to exclude NK cells.
Human intestinal lamina propria lymphoid cell (LPL) preparation
Human intestinal biopsies were incubated with PBS containing 5 mM EDTA, 150 μg/ml DTT, and 0.1% β-mercaptoethanol on a shaker for 15 min at 37°C to remove epithelial cells. The remaining tissue containing the LPLs was washed with complete RPMI-1640 (10% FBS, 1:100 GlutaMAX, and 1:1000 β-mercaptoethanol), then digested with RPMI-1640 containing 125 μg/ml Liberase (Roche) and 200 μg/ml DNase I (Sigma) for 30 min on a shaker at 37°C. LPLs were filtered through a 70 μm cell strainer and washed with RPMI-1640.
Immunohistochemistry and fluorescence microscopy
Formaldehyde-fixed, paraffin-embedded (FFPE), rectosigmoid tissue sections (5 mm thick) from human clinical specimens were placed on Fisher-Plus microscope slides, deparaffinized in xylene, rehydrated through graded ethanol, and subjected to heat-induced epitope retrieval (HIER) with citrate pH 6.0 (GBI Labs, B05C-100B), cooled, washed in double distilled H2O, and stained. For myeloperoxidase (MPO) detection, staining was performed at a 1:1000 dilution (Dako, A0398) and detection was performed with an anti-rabbit polymer HRP-conjugated system (GBI Labs, D13-110) and developed with DAB (Vector; SK4105) for 5 minutes at room temperature. For MX1 detection (EMD Millipore, MABF938), staining was performed as for MPO detection except that HIER was performed with 0.1% citraconic anhydride (containing 0.05% Tween-20) and detection was performed with an anti-mouse polymer HRP-conjugated system (GBI Labs, D37-110). Slides were counterstained with CAT hematoxylin (Biocare Medical, CATHE-GL), coverslipped using Permount (Fisher Scientific, SP15-100), and scanned at 20x magnification on an Aperio AT2 (Leica Biosystems).
For immunofluorescence, CD3−CD117+ phenotype was used for ILC3 detection. Staining was performed with a 1:200 dilution overnight (Sigma-Aldrich, HPA004471) and detection was performed with an anti-rabbit polymer HRP-conjugated system (GBI Labs, D13-110) and developed with Alexa Fluor 647-conjugated tyramide (Invitrogen, B40958) at a 1:1,000 dilution for 10 minutes at room temperature. Antibody stripping was performed following detection of CD117 by heating slides in citrate pH 6 HIER buffer for 10 minutes at 95–100°C. Slides were cooled for 20 min, washed in double distilled H2O, and stained for CD3 (Biocare, ACI 3152 C), at a 1:100 dilution for one hour at room temperature, followed by an Alexa Fluor 755-conjugated donkey anti-mouse secondary antibody (Invitrogen, SA5-10171) at a 1:500 dilution for 30 minutes at room temperature. Nuclei were counterstained with DAPI (4’,6-diamidino-2-phenylindole, Roche. 10 236 276 001), at 1:10,000 dilution for 10 minutes and slides were coverslipped with Prolong Gold (Thermo Fisher, P36930). Whole-slide images were obtained at 20x magnification on a AxioScan Z.1 slide scanner (Zeiss). Each tissue block had 3–6 biopsies and was stained with 2 sections/tissue block/experiment. The staining was performed independently three times with similar results.
Quantitative image analysis
Images were analyzed using the HALO 2.3 platform (Indica Labs) in a blinded fashion. All tissues were annotated to limit analysis to the mucosa (i.e. epithelium, lamina propria), including lymphoid aggregates and putative colonic patches originating within the submucosa that breached the muscularis mucosa and penetrated into the lamina propria. The submucosa and tunica muscularis were excluded from analysis. For neutrophil quantification, the percentage of MPO positive cells was determined relative to the total cell population using the Cytonuclear v1.6 module. MX1 was quantified as the percent positive staining relative to the total tissue area using the Area Quantification v2.0.0 analysis module. For ILC3 quantification, the number of CD117+CD3−, CD117−CD3+, and total cells was determined using the FISH v1.1 analysis module. All analyses were reviewed manually to ensure accuracy.
Human NK cell enrichment
NK cells were negatively enriched by excluding T cells, B cells, stem cells, dendritic cells, monocytes, granulocytes, and erythroid cells with the human NK isolation kit (MACS, 130-092-657) according to manufacturer’s instructions.
Flow cytometry
Live and dead cells were discriminated using the Live and Dead violet viability kit (Invitrogen, L-34963). For cell surface molecule detection, the cells were resuspended in antibody-containing MACS buffer for 30–60 min at 4°C in the dark. To detect cytokine production, cells were stimulated with the indicated cytokines for 16 hrs (except for time course experiment in Fig. 6e), or with PMA and ionomycin (eBioscience, 00-4970-03) for 3–6 hrs. In both cases, protein transport inhibitor (eBioscience, 00-4980-03) was present during the stimulation. For intracellular staining of transcription factors or cytokines, cells were fixed and permeabilized using Foxp3 staining buffer kit (eBioscience, 00-5523-00) and target intracellular molecules were stained as for surface staining.
NK cell sorting
PBMCs were stained with a panel of lineage markers. The Lin− population was sorted based on cell surface CD56 and CD94, as indicated in the legend to Extended Data Fig. 2b and Fig. 4a using a BD FACSAria IIu.
Degranulation assay
For the response to PMA/ionomycin, PBMCs were seeded in 24 well plates at 2 × 10⁶ cells/well in RPMI-1640 with anti-CD107a antibody (Biolegend, 328630) at 1:200 dilution. Then, cells were stimulated with PMA/ionomycin (Invitrogen, 00-4970-03, 1:500) for 5 hrs and surface CD107a on NK cells (Lin−CD56+) was detected by flow cytometry.
For the response to K562 cells, NK cells were enriched from PBMCs with magnetic beads (BD, 557987) and incubated in V bottom 96 well plates with K562 cells (NK vs K562, 2:1) for the indicated time, and surface CD107a on NK cells was detected.
For the response to HIV-1-infected CD4+ T cells, CD4+ PBMCs were enriched from an anonymous, HIV-1− blood donor with magnetic beads (MACS, 130-045-101) and stimulated for 2 days with anti-CD3 and anti-CD28 antibodies (STEMCELL, 10991) in the presence of IL-2 (50 units/ml). Then cells were challenged for 3 days with a stock of replication competent HIV-1-Nef/GFP produced by transfection of HEK-293 cells with pNL4-3 in which intact nef is fused to GFP coding sequence. As previously described51, the productively-infected T cells were enriched with magnetic beads (MACS, 130-045-101) based on the fact that gene products from the HIV-1 provirus downregulate CD4. NK cells were enriched from autologous PBMCs with magnetic beads (BD, 557987), cultured for 5 days in IL-15 (5 ng/ml), and then incubated for the indicated time in V bottom 96 well plates with the HIV-1-infected CD4+ T cells (NK vs HIV-1+ T cells, 2:1). Surface CD107a on NK cells was then detected by flow cytometry.
Killing assay
K562 or Jurkat cells were washed and resuspended at 106 cell/ml in PBS. Calcein-AM52 (Molecular Probes) was added at 10 μM and the cells were labelled at 37°C in 5% CO2 for 30 min. After washing with PBS for 2 times, the labelled cells were resuspended in complete RPMI-1640 and aliquoted in a V bottom 96 well plate (5,000 cells in 100 μl). The sorted NK cells were resuspended in complete RPMI-1640 and the concentration was adjusted at 15 fold of target cells (7.5×10⁴ cells) in 50μl. The effector and target cells were mixed and centrifuged at 50 × g for 0.5 min and were incubated at 37°C in 5% CO2 for 6 hrs. Cells were pelleted and 100 μl supernatant was transferred to a 96-well solid black microplate. The fluorescence released by labelled target cells were detected using BioTek Synergy 2 plate reader (excitation filter: 485/20 nm; band-pass filter: 528/20 nm). Specific lysis was determined as: [(test fluorescence release - spontaneous fluorescence release) / (maximum fluorescence release - spontaneous fluorescence release)] × 100.
Plasma sCD14
The concentration of sCD14 in the plasma was detected using an ELISA according to the manufacturer’s instructions (R&D, DC140).
Lentivirus production and TCF7 knockdown
TCF7-specific pGIPZ shRNAs (Dharmacon) were subcloned into a modified pAGM plasmid and this was used to transfect HEK293 cells to generate VSV G pseudotyped lentivirus, as described53. Lin−CD56+ NK cells were subjected to 3 rounds of transduction before 1o stimulation.
Cytokine induced NK cell memory assay
PBMCs or sorted CD94−NK cells were pre-stimulated with IL-15 (5 ng/ml, Peprotech, 200-15) + IL-12 (10 ng/ml, Peprotech, 200-12) + IL-18 (50 ng/ml, InvivoGen, rcyec-hil18) for 16 hrs, or cells were incubated with IL-15 alone (5 ng/ml) to maintain cell survival (no pre-stimulation, control). Cytokines were washed out and the cells were rested by incubation in IL-15 (5 ng/ml) alone for 5 days. Cells were then re-stimulated with IL-12 (50 ng/ml) + IL-15 (50 ng/ml) for 16 hrs. IFN-γ production was detected by intracellular staining with anti-IFN-γ antibody using a Foxp3 staining buffer kit (eBioscience, 00-5523-00). As compared with cells that had not been pre-stimulated, the increase in IFN-γ production in pre-stimulated cells was used as a readout for pre-stimulation induced memory, as previously described54.
Library preparation for bulk RNA-Seq
The bulk RNA sequencing library was prepared using CEL-Seq255. RNA of sorted cells was extracted using TRIzol reagent. 10 ng RNA was used for first strand cDNA synthesis using barcoded primers containing unique molecular identifier (UMI) sequences. Specifically, for CD94−NK cell and CD94+NK cell 2 population RNA-Seq from 2 donors, the RNA of CD94−NK cells was reverse transcribed with 5’-GCC GGT AAT ACG ACT CAC TAT AGG GAG TTC TAC AGT CCG ACG ATC NNN NNN AGA CTC TTT TTT TTT TTT TTT TTT TTT TTT V-3’ and 5’-GCC GGT AAT ACG ACT CAC TAT AGG GAG TTC TAC AGT CCG ACG ATC NNN NNN CAG ATC TTT TTT TTT TTT TTT TTT TTT TTT V-3’. The RNA of CD94+NK cells was reverse transcribed with 5’-GCC GGT AAT ACG ACT CAC TAT AGG GAG TTC TAC AGT CCG ACG ATC NNN NNN CAT GAG TTT TTT TTT TTT TTT TTT TTT TTT V-3’ and 5’-GCC GGT AAT ACG ACT CAC TAT AGG GAG TTC TAC AGT CCG ACG ATC NNN NNN TCA CAG TTT TTT TTT TTT TTT TTT TTT TTT V-3’. The second strand was synthesized using NEBNext Second Strand Synthesis Module (NEB). The pooled dsDNA was purified with AMPure XP beads (Beckman Coulter, A63880) and subjected to in vitro transcription (IVT) using HiScribe T7 High Yield RNA Synthesis Kit (NEB), then treated with ExoSAP-IT (Affymetrix 78200). IVT RNA was fragmented using RNA fragmentation reagents (Ambion) and underwent a 2nd reverse transcription step using random hexamer RT primer-5’-GCC TTG GCA CCC GAG AAT TCC ANN NNN N-3’ to incorporate the second adapter. The final library was amplified with indexed primers: RP1-5’-AAT GAT ACG GCG ACC ACC GAG ATC TAC ACG TTC AGA GTT CTA CAG TCC GA-3’ and RPI1-5’-CAA GCA GAA GAC GGC ATA CGA GAT CGT GAT GTG ACT GGA GTT CCT TGG CAC CCG AGA ATT CCA-3’ and the purified library was quantified with 4200 TapeStation (Agilent Technologies) and paired-end sequenced on a Nextseq 500 V2 (Illumina) using 15 cycles Read 1, 6 cycles Index 1, and 71 cycles Read 2.
RNA-Seq on CD94−CD56dim, CD94+CD56dim and CD94+CD56hi NK cells from 4 donors was performed as above. Specifically, the RNA of CD94−CD56dim NK cells was reverse transcribed with 5’-GCC GGT AAT ACG ACT CAC TAT AGG GAG TTC TAC AGT CCG ACG ATC NNN NNN AGA CTC TTT TTT TTT TTT TTT TTT TTT TTT V-3’; 5’-GCC GGT AAT ACG ACT CAC TAT AGG GAG TTC TAC AGT CCG ACG ATC NNN NNN TCA CAG TTT TTT TTT TTT TTT TTT TTT TTT V-3’; 5’-GCC GGT AAT ACG ACT CAC TAT AGG GAG TTC TAC AGT CCG ACG ATC NNN NNN ACC ATG TTT TTT TTT TTT TTT TTT TTT TTT V-3’; and 5’-GCC GGT AAT ACG ACT CAC TAT AGG GAG TTC TAC AGT CCG ACG ATC NNN NNN CTG TGA TTT TTT TTT TTT TTT TTT TTT TTT V-3’. CD94+CD56dim cells were reverse transcribed with 5’-GCC GGT AAT ACG ACT CAC TAT AGG GAG TTC TAC AGT CCG ACG ATC NNN NNN CAT GAG TTT TTT TTT TTT TTT TTT TTT TTT V-3’; 5’-GCC GGT AAT ACG ACT CAC TAT AGG GAG TTC TAC AGT CCG ACG ATC NNN NNN GTC TAG TTT TTT TTT TTT TTT TTT TTT TTT V-3’; 5’-GCC GGT AAT ACG ACT CAC TAT AGG GAG TTC TAC AGT CCG ACG ATC NNN NNN ACT CGA TTT TTT TTT TTT TTT TTT TTT TTT V-3’ and 5’-GCC GGT AAT ACG ACT CAC TAT AGG GAG TTC TAC AGT CCG ACG ATC NNN NNN TGC AGA TTT TTT TTT TTT TTT TTT TTT TTT V-3’. CD94+CD56hi NK cells were reverse transcribed with 5’-GCC GGT AAT ACG ACT CAC TAT AGG GAG TTC TAC AGT CCG ACG ATC NNN NNN CAG ATC TTT TTT TTT TTT TTT TTT TTT TTT V-3’; 5’-GCC GGT AAT ACG ACT CAC TAT AGG GAG TTC TAC AGT CCG ACG ATC NNN NNN GTT GCA TTT TTT TTT TTT TTT TTT TTT TTT V-3’; 5’-GCC GGT AAT ACG ACT CAC TAT AGG GAG TTC TAC AGT CCG ACG ATC NNN NNN ACG TAC TTT TTT TTT TTT TTT TTT TTT TTT V-3’ and 5’-GCC GGT AAT ACG ACT CAC TAT AGG GAG TTC TAC AGT CCG ACG ATC NNN NNN CAA CCA TTT TTT TTT TTT TTT TTT TTT TTT V-3’.
For sequencing of CD94−CD56dim NK cells in the cytokine-induced NK cell memory model, RNA collected after no 1o stimulation, after 1o stimulation, and after 1o stimulation in the presence of LGK974, was reverse transcribed with 5’- GCC GGT AAT ACG ACT CAC TAT AGG GAG TTC TAC AGT CCG ACG ATC NNN NNN GTC TAG TTT TTT TTT TTT TTT TTT TTT TTT V-3’, 5’-GCC GGT AAT ACG ACT CAC TAT AGG GAG TTC TAC AGT CCG ACG ATC NNN NNN GTT GCA TTT TTT TTT TTT TTT TTT TTT TTT V-3’ and 5’-GCC GGT AAT ACG ACT CAC TAT AGG GAG TTC TAC AGT CCG ACG ATC NNN NNN ACC ATG TTT TTT TTT TTT TTT TTT TTT TTT V-3’ respectively, The final library was amplified with indexed primers: RP1-5’-AAT GAT ACG GCG ACC ACC GAG ATC TAC ACG TTC AGA GTT CTA CAG TCC GA-3’ and RPI1 (for donor 1) −5’-CAA GCA GAA GAC GGC ATA CGA GAT CGT GAT GTG ACT GGA GTT CCT TGG CAC CCG AGA ATT CCA-3’ or RPI2 (for donor 2)-5’-CAA GCA GAA GAC GGC ATA CGA GAT ACA TCG GTG ACT GGA GTT CCT TGG CAC CCG AGA ATT CCA-3’.
Library preparation for single cell RNA-Seq
The single cell sequencing library was prepared using InDrop barcoding21. Individual, pre-sorted cells were captured in droplets containing lysis buffer, reverse transcription reagents, and hydrogel microspheres carrying primers for barcoding, each captured cell using a custom-built InDrop microfluidics system, as described21. After cDNA for each cell was synthesized in individual droplets with unique barcodes, the droplet emulsion was broken and cDNA from all cells was pooled. A single cell cDNA library was prepared using essentially CEL-Seq2 55 as described above for bulk RNA-Seq, with the following changes. PE2-N6-5’-TCG GCA TTC CTG CTG AAC CGC TCT TCC GAT CTN NNN NN-3’ was used in the 2nd reverse transcription reaction. CD94−NK cells libraries were linearly amplified with Indexed primers PE1-6: 5’-CAA GCA GAA GAC GGC ATA CGA GAT ATT GGC CTC TTT CCC TAC ACG A-3’ or PE1-17: 5’-CAA GCA GAA GAC GGC ATA CGA GAT CTC TAC CTC TTT CCC TAC ACG A-3’ and PE2: 5’-AAT GAT ACG GCG ACC ACC GAG ATC TAC ACG GTC TCG GCA TTC CTG CTG AAC-3’. Libraries from CD94+NK cells were amplified with index 1 primers PE1-12: 5’-CAA GCA GAA GAC GGC ATA CGA GAT TAC AAG CTC TTT CCC TAC ACG A-3’ or PE1-18: 5’-CAA GCA GAA GAC GGC ATA CGA GAT GCG GAC CTC TTT CCC TAC ACG A-3’, and PE2 (above). Libraries were sequenced 38 cycles Read 1, 6 cycles Index 1, 48 cycles Read 2 using Illumina Nextseq 500 V2 with custom sequencing primers added to the cartridge: R1 5’-GGC ATT CCT GCT GAA CCG CTC TTC CGA TCT-3’ Idx: 5’-AGA TCG GAA GAG CGT CGT GTA GGG AAA GAG-3’ R2 5’- CTC TTT CCC TAC ACG ACG CTC TTC CGA TCT-3’.
CUT&RUN
Sorted CD94−CD56dim, CD94+CD56dim, and CD94+CD56hi NK cells were processed as described56–58. Cells were lysed in nuclear extraction buffer (20 mM HEPES-KOH, pH 7.9; 10 mM KCL; 0.5 mM spermidine; 0.1% Triton X-100; 20% glycerol). Nuclei were precipitated by centrifugation and then resuspended and bound to Bio-Mag Plus Concanavalin A coated beads (Polysciences, 86057), and incubated for 5 mins in blocking buffer (20 mM HEPES, pH 7.5; 150 mM NaCl; 0.5 mM spermidine; 0.1% BSA; 2 mM EDTA). Then nuclei were incubated overnight at 4°C with the following antibodies at 1:100 dilution: rabbit anti-human IgG (Control, abcam, ab2410), rabbit anti-H3K4me1 (diagnode, c15410194), rabbit anti-H3K27ac (diagnode, c15410196), rabbit anti-H3K4me3 (diagnode, c15410003), rabbit anti-TCF7 (cell signaling technology, 2203S), or rabbit anti-H3K27me3 (diagnode, c15410195). Protein A-micrococcal nuclease fusion protein, a gift from Thomas Fazzio, was added at 600 ug/ml for 1 hr at 4oC. CaCl2 was added to a final concentration 2 mM to activate the micrococcal nuclease, and 2X stop buffer (200 mM NaCl; 20 mM EDTA; 4 mM EGTA; 50 ug/ml RNase A; 40 ug/ml glycogen) was added 30 min later. Supernatant containing the released chromatin was subjected to pheno-chloroform-isoamyl extraction and DNA was precipitated with ethanol. The sequencing library was constructed according to the NEBNext Ultra II DNA library Prep kit for Illumina-based sequencing (NEB, 7645L), using NEBNext Multiplex Oligos (NEB, E6609S). For donor 1, primers D1-D6 were used to amplify each antibody-enriched DNA preparation from CD94−CD56dimNK cells according to the antibody order mentioned above. Accordingly, primers D7-D12 were used for sorted CD94+CD56dimNK cells, and primers E1-E6 were used for sorted CD94+CD56hiNK cells. For donor 2, primers E7-E12 were used for sorted CD94−CD56dimNK cells, primers F1-F6 were used for sorted CD94+CD56dim NK cells, and primers F7-F12 were used for sorted CD94+CD56hiNK cells. Libraries were paired-end sequenced on a Nextseq 500 V2 (Illumina) using 45 cycles Read 1, 8 cycles Index 1, and 32 cycles Read 2.
ATAC-Seq
CD94−CD56dim, CD94+CD56dim and CD94+CD56hi NK cells were sorted from HIV-1− PBMCs and processed as described59,60. Nuclei were precipitated after cells were suspended in lysis buffer (10 mM Tris·Cl, pH 7.4; 10 mM NaCl; 3 mM MgCl2, 0.1% NP-40). 2.5 ul of Tn5 transposase (Nextera DNA Library Prep Kit, Illumina, FC-121-1030) was added per 50 ul reaction, for 30 min at 37oC. Released DNA fragments were purified using the Promega PCR product purification kit (A9282) and used to generate libraries. Barcode primers used for CD94−CD56dim, CD94+CD56dim and CD94+CD56hi NK cells from the donor 1 library construction were: 5’-CAA GCA GAA GAC GGC ATA CGA GAT TCG CCT TAG TCT CGT GGG CTC GGA GAT GT-3’, 5’-CAA GCA GAA GAC GGC ATA CGA GAT CTA GTA CGG TCT CGT GGG CTC GGA GAT GT-3’ and 5’-CAA GCA GAA GAC GGC ATA CGA GAT TTC TGC CTG TCT CGT GGG CTC GGA GAT GT-3’ respectively. Barcode primers used for CD94−CD56dim, CD94+CD56dim and CD94+CD56hi NK cells from donor 2 library construction were: 5’-CAA GCA GAA GAC GGC ATA CGA GAT GCT CAG GAG TCT CGT GGG CTC GGA GAT GT-3’, 5’-CAA GCA GAA GAC GGC ATA CGA GAT AGG AGT CCG TCT CGT GGG CTC GGA GAT GT-3’ and 5’-CAA GCA GAA GAC GGC ATA CGA GAT CAT GCC TAG TCT CGT GGG CTC GGA GAT GT-3’ respectively. The common primer sequence was: 5’-AAT GAT CGG CGA CCA CCG ATA TCT ACA CTC GTC GGC AGC GTC AGA TGTG-3’. Libraries were paired-end sequenced on a Nextseq 500 V2 (Illumina) using 42 cycles Read 1, 8 cycles Index 1, and 42 cycles Read 2. Libraries were paired-end sequenced on a Nextseq 500 V2 (Illumina) using 42 cycles Read 1, 8 cycles Index 1, and 42 cycles Read 2.
Bulk RNA-Seq Processing and Analysis
The pooled sets of RNA-Seq reads were separated by CEL-Seq barcodes and mapped to the HG19 genome using Tophat61 (version 2.0.14, default parameters). Aligned reads were quantified by ESAT62 using a transcript annotation file containing all RefSeq genes filtered to select only ‘NM’ transcripts and extending the transcripts up to 1,000 bases past the end of the annotated 3’ end (-wExt 1000, -task score3p), discarding multimapped reads (-multimap ignore). The most varied genes were analyzed using DEBrowser, differential expression analysis was performed using DESeq263, and MA plots were created using values from lfcShrink within DESeq2. Any gene differentially expressed in these 3 tests in Fig. 4b was shown. For principal component analysis (PCA), data was transformed using rlog within DEseq2 and prcomp was used to calculate the PCs.
Single cell RNA-Seq processing and analysis
Reads were mapped to the HG19 genome using Tophat61 (version 2.0.14, default parameters). To assign each read to a given cell and collapse duplicate reads into single UMIs, alignments were processed by ESAT62 using its single-cell analysis module (-scPrep) with the same transcript annotation file used for the bulk RNA-Seq analysis, extending the transcripts up to 1,000 bases past the annotated 3’ end (-wExt 1000, -task score3p), discarding multimapped reads (-multimap ignore), and requiring a single observation of a UMI for a transcript to be counted (-umiMin 1).
The final output of ESAT is a table where rows are genes, cells are columns, and values represent the number of UMIs detected in each cell. The dataset was loaded into R and, if not part of base R, the packages used are noted. First, data was normalized using the TMM method from EdgeR (Robinson and Oshlack, 2010). On this matrix, PCA was run in order to determine the number of dimensions that contribute variance to the data and to select genes that were highly variable in the dataset. ICA was run using the fastICA64 algorithm to reduce the data to the number of dimensions that contained variance. To determine the optimum number of cell clusters in the dataset the methods of (Tibshirani and Walther, 2005) were utilized. This analysis showed 2 clusters gives the highest predictive strength, and that further subdividing of the cells into additional clusters severely lowered the score. Spectral clustering was then run with n of 2 centers and the symmetrical method on the cell’s ICA components using the kknn package65. Differential expression analysis was used to determine the genes that were most significantly different between the two clusters66. For visualization, the cells were then reduced to 2 dimensions using the Rtsne package, which took the ICA components as input67. Lastly, the minimum spanning tree (MST) was constructed on the tSNE plot utilizing Monocle23. For pseudotime analysis, Monocle’s built-in differential expression tools were utilized. For visualization purposes, tSNE mapped cells were color coded by the expression of given genes; a weighted density map was created that takes into account both the number of cells in a region as well as their expression values. Heatmaps were generated using the list of genes that were found to be significantly differentially expressed in both the spectral clustering clusters and with the pseudotime analysis. Rows of the heatmap were grouped by similarity (heatmap.2), and columns were ordered based on the ordering provided by the pseudotime analysis.
CUT&RUN and ATAC-Seq data analysis
Data processing made using in-house tool called dolphin (https://dolphin.umassmed.edu/). For CUT&RUN, paired-end reads were removed where the average quality scores in window size 10 are less then 15 and trimmed where leading and trailing bases with quality scores less than 15 using trimmomatic version 0.32. Reads that were longer than 25 bases after trimming were kept for further analysis. The reads were then aligned to human reference genome hg19 using Bowtie2 with options --un-conc to filter out reads that align un-concordantly. Duplicated reads were filtered out using Picard’s MarkDuplicates version 0.32. Peaks were then called using MACS2 (Zhang et al., 2008). Alignment files were also converted to tdf format using IGVtools count function version 2.3.31 using -w 5 parameter. For ATAC-Seq, first, paired-end reads were filtered which have bed qualities using trimmomatic version 0.32, and then aligned with Bowtie2, version 2.2.3 to a reference genome hg19. The duplicate alignments were then removed using Picard’s MarkDuplicates version 0.32. To be able to accurately call the peaks. each aligned read was first trimmed to the 9-bases at the 5’ end, the region where the Tn5 transposase cuts the DNA in the performed ATAC-Seq experiment. To smooth the peaks the start site of the trimmed read extended 10-bases up and down stream. Peaks were called using these adjusted aligned reads with MACS268. For visualization, the adjusted aligned reads were converted to tdf files using IGVTools, version 2.3.3169 (IGVtools count –w5). For motif analysis, motifs enriched in accessible regions within the enhancers and promoters of indicated NK subset was found by using findMotifsGenome from HOMER2 package using the accessible regions within the enhancers and promoters of the other two NK subsets as background. The de-novo motifs found were matched against the HOCOMOCCO11 motif database.
Gene set enrichment analysis
The RNK file including gene name and log2 fold change, comparing CD94+CD56hi vs CD94−CD56dim and CD94+CD56hi vs CD94+CD56dim, were used as input for GenePattern (https://genepattern.broadinstitute.org/gp/pages/index.jsf). The gene set database selected was C7 (immunologic signatures) and the number of permutations was set to 5000.
Statistical analysis
Statistical analysis was performed with GraphPad Prism software using paired or unpaired two-tailed student’s t-test as indicated in the figure legends. p<0.05 was considered as significant. Variance was estimated by calculating the mean ± s.e.m. in each group. Variances among groups of samples were compared using the F-test function in GraphPad.
Life sciences reporting summary
Further information on research design is available in the Nature Research Reporting Summary linked to this article.
Data availability
The data that support the findings of this study are available within the manuscript and its supplementary information files, and are available from the corresponding author upon request. Source data for Figures 2–7 are provided with the paper. Bulk and single-cell RNA-Seq, CUT&RUN, and ATAC-Seq datasets can be found under SuperSeries GSE122326 at https://www.ncbi.nlm.nih.gov/geo/query/acc.cgi?acc=GSE97727.
GSE97727: CD94− and CD94+ NK cell bulk and single cell RNA-Seq.
GSE122324: CD94−CD56dim, CD94+CD56dim, and CD94+CD56hi NK cells RNA-Seq.
GSE122325: CD94−CD56dim NK cells, 1o stim and 5 day culture RNA-Seq.
GSE122548: CD94−CD56dim, CD94+CD56dim, and CD94+CD56hi NK cells ATAC-Seq.
GSE122549: CD94−CD56dim, CD94+CD56dim, and CD94+CD56hi NK cells CUT&RUN.
Extended Data
Extended Data Fig. 1.
Extended Data Fig. 2.
Extended Data Fig. 3.
Extended Data Fig. 4.
Extended Data Fig. 5.
Extended Data Fig. 6.
Extended Data Fig. 7.
Supplementary Material
Acknowledgements
We thank the study participants who generously provided blood and colon biopsy samples, as well as their caretakers, Drs. J. Daly, S. Cheeseman, and M. Wessolossky of the University of Massachusetts Medical School (UMMS). C. Mannarino, A. Foley, M. McManus (UMMS), and M. Krone (UCSF) provided IRB regulatory assistance, sample preparation, and record keeping. K. Luzuriaga (UMMS) supported the patient sample database and repository. A. Ratner, S. Boswell, and A. Klein (Harvard Medical School) contributed technical assistance and barcoded hydrogel beads. T. Fazzio and T. Wu provided technical support and protein A-MNase for CUT&RUN. D. Artis, L. Berg, M. Colonna, J. Huh, J. Kang, R. Rutishauser, and S. Swain offered invaluable advice. This research was supported by NIH U01HG007910 (to M.G. and J.L.), R37AI147868 (to J.L.), R01AI111809 (to J.L.), DP1DA034990 (to J.L.), R21AI119885 (to M.G.), R01DK105837 (to M.G.), P51OD01192 (to the Oregon National Primate Research Center; J.D.E), the Division of Intramural Research/NIAID/NIH (J.M.B.), and the Translational Medicine Core of the University of Massachusetts Center for AIDS Research (P30AI042845). The UCSF-based SCOPE cohort was supported by the UCSF/Gladstone Institute of Virology & Immunology CFAR (P30 AI027763) and the CFAR Network of Integrated Systems (R24 AI067039). Additional support was provided by the Delaney AIDS Research Enterprise (DARE; AI096109, AI127966).
Footnotes
Declaration of interests
The authors declare no competing financial interests.
References
- 1.Deeks SG, Tracy R & Douek DC Systemic effects of inflammation on health during chronic HIV infection. Immunity 39, 633–645 (2013). [DOI] [PMC free article] [PubMed] [Google Scholar]
- 2.Brenchley JM et al. Microbial translocation is a cause of systemic immune activation in chronic HIV infection. Nat. Med 12, 1365–1371 (2006). [DOI] [PubMed] [Google Scholar]
- 3.Vivier E et al. Innate Lymphoid Cells: 10 Years On. Cell 174, 1054–1066 (2018). [DOI] [PubMed] [Google Scholar]
- 4.Kløverpris HN et al. Innate Lymphoid Cells Are Depleted Irreversibly during Acute HIV-1 Infection in the Absence of Viral Suppression. Immunity 44, 391–405 (2016). [DOI] [PMC free article] [PubMed] [Google Scholar]
- 5.Mudd JC et al. Hallmarks of primate lentiviral immunodeficiency infection recapitulate loss of innate lymphoid cells. Nat. Commun 9, 3967 (2018). [DOI] [PMC free article] [PubMed] [Google Scholar]
- 6.Bruel T et al. Elimination of HIV-1-infected cells by broadly neutralizing antibodies. Nat. Commun 7, 10844 (2016). [DOI] [PMC free article] [PubMed] [Google Scholar]
- 7.Alter G et al. HIV-1 adaptation to NK-cell-mediated immune pressure. Nature 476, 96–100 (2011). [DOI] [PMC free article] [PubMed] [Google Scholar]
- 8.Cerwenka A & Lanier LL Natural killer cell memory in infection, inflammation and cancer. Nat. Rev. Immunol 16, 112–123 (2016). [DOI] [PubMed] [Google Scholar]
- 9.Lim AI et al. Systemic Human ILC Precursors Provide a Substrate for Tissue ILC Differentiation. Cell 168, 1086–1100.e10 (2017). [DOI] [PubMed] [Google Scholar]
- 10.Colonna M Innate Lymphoid Cells: Diversity, Plasticity, and Unique Functions in Immunity. Immunity 48, 1104–1117 (2018). [DOI] [PMC free article] [PubMed] [Google Scholar]
- 11.Mazzucchelli R & Durum SK Interleukin-7 receptor expression: intelligent design. Nat. Rev. Immunol 7, 144–154 (2007). [DOI] [PubMed] [Google Scholar]
- 12.Leonard WJ & O’Shea JJ Jaks and STATs: biological implications. Annu. Rev. Immunol 16, 293–322 (1998). [DOI] [PubMed] [Google Scholar]
- 13.Mavilio D et al. Characterization of CD56–/CD16+ natural killer (NK) cells: A highly dysfunctional NK subset expanded in HIV-infected viremic individuals. Proc. Natl. Acad. Sci. U. S. A 102, 2886–2891 (2005). [DOI] [PMC free article] [PubMed] [Google Scholar]
- 14.Fang M et al. CD94 is essential for NK cell-mediated resistance to a lethal viral disease. Immunity 34, 579–589 (2011). [DOI] [PMC free article] [PubMed] [Google Scholar]
- 15.Jeevan-Raj B et al. The Transcription Factor Tcf1 Contributes to Normal NK Cell Development and Function by Limiting the Expression of Granzymes. Cell Rep. 20, 613–626 (2017). [DOI] [PubMed] [Google Scholar]
- 16.Wendel M, Galani IE, Suri-Payer E & Cerwenka A Natural killer cell accumulation in tumors is dependent on IFN-gamma and CXCR3 ligands. Cancer Res. 68, 8437–8445 (2008). [DOI] [PubMed] [Google Scholar]
- 17.Sconocchia G, Titus JA & Segal DM Signaling pathways regulating CD44-dependent cytolysis in natural killer cells. Blood 90, 716–725 (1997). [PubMed] [Google Scholar]
- 18.Liu LL et al. Critical Role of CD2 Co-stimulation in Adaptive Natural Killer Cell Responses Revealed in NKG2C-Deficient Humans. Cell Rep. 15, 1088–1099 (2016). [DOI] [PMC free article] [PubMed] [Google Scholar]
- 19.Juelke K et al. CD62L expression identifies a unique subset of polyfunctional CD56dim NK cells. Blood 116, 1299–1307 (2010). [DOI] [PubMed] [Google Scholar]
- 20.Gazit R et al. Expression of KIR2DL1 on the entire NK cell population: a possible novel immunodeficiency syndrome. Blood 103, 1965–1966 (2004). [DOI] [PubMed] [Google Scholar]
- 21.Klein AM et al. Droplet barcoding for single-cell transcriptomics applied to embryonic stem cells. Cell 161, 1187–1201 (2015). [DOI] [PMC free article] [PubMed] [Google Scholar]
- 22.Tibshirani R & Walther G Cluster Validation by Prediction Strength. J. Comput. Graph. Stat 14, 511–528 (2005). [Google Scholar]
- 23.Trapnell C et al. The dynamics and regulators of cell fate decisions are revealed by pseudotemporal ordering of single cells. Nat. Biotechnol 32, 381–386 (2014). [DOI] [PMC free article] [PubMed] [Google Scholar]
- 24.Utzschneider DT et al. T Cell Factor 1-Expressing Memory-like CD8(+) T Cells Sustain the Immune Response to Chronic Viral Infections. Immunity 45, 415–427 (2016). [DOI] [PubMed] [Google Scholar]
- 25.Jeannet G et al. Essential role of the Wnt pathway effector Tcf-1 for the establishment of functional CD8 T cell memory. Proc. Natl. Acad. Sci. U. S. A 107, 9777–9782 (2010). [DOI] [PMC free article] [PubMed] [Google Scholar]
- 26.Yang Q et al. TCF-1 upregulation identifies early innate lymphoid progenitors in the bone marrow. Nat. Immunol 16, 1044–1050 (2015). [DOI] [PMC free article] [PubMed] [Google Scholar]
- 27.Aksoy I et al. Self-Renewal of Murine Embryonic Stem Cells Is Supported by the Serine/Threonine Kinases Pim-1 and Pim-3. Stem Cells 25, 2996–3004 (2007). [DOI] [PubMed] [Google Scholar]
- 28.Baaten BJG et al. CD44 regulates survival and memory development in Th1 cells. Immunity 32, 104–115 (2010). [DOI] [PMC free article] [PubMed] [Google Scholar]
- 29.Weng N-P, Araki Y & Subedi K The molecular basis of the memory T cell response: differential gene expression and its epigenetic regulation. Nat. Rev. Immunol 12, 306–315 (2012). [DOI] [PMC free article] [PubMed] [Google Scholar]
- 30.Moretta L Dissecting CD56dim human NK cells. Blood vol. 116 3689–3691 (2010). [DOI] [PubMed] [Google Scholar]
- 31.Paust S et al. Critical role for the chemokine receptor CXCR6 in NK cell-mediated antigen-specific memory of haptens and viruses. Nat. Immunol 11, 1127–1135 (2010). [DOI] [PMC free article] [PubMed] [Google Scholar]
- 32.Roychoudhuri R et al. BACH2 regulates CD8(+) T cell differentiation by controlling access of AP-1 factors to enhancers. Nat. Immunol 17, 851–860 (2016). [DOI] [PMC free article] [PubMed] [Google Scholar]
- 33.Shin HM et al. Epigenetic Modifications Induced by Blimp-1 Regulate CD8+ T Cell Memory Progression during Acute Virus Infection. Immunity 39, 661–675 (2013). [DOI] [PMC free article] [PubMed] [Google Scholar]
- 34.Kamimura Y & Lanier LL Homeostatic control of memory cell progenitors in the natural killer cell lineage. Cell Rep. 10, 280–291 (2015). [DOI] [PMC free article] [PubMed] [Google Scholar]
- 35.Brenchley JM et al. Expression of CD57 defines replicative senescence and antigen-induced apoptotic death of CD8+ T cells. Blood 101, 2711–2720 (2003). [DOI] [PubMed] [Google Scholar]
- 36.Wherry EJ et al. Molecular signature of CD8+ T cell exhaustion during chronic viral infection. Immunity 27, 670–684 (2007). [DOI] [PubMed] [Google Scholar]
- 37.Lin W-HW et al. CD8+ T Lymphocyte Self-Renewal during Effector Cell Determination. Cell Rep. 17, 1773–1782 (2016). [DOI] [PMC free article] [PubMed] [Google Scholar]
- 38.Vigneau S, Rohrlich P-S, Brahic M & Bureau J-F Tmevpg1, a candidate gene for the control of Theiler’s virus persistence, could be implicated in the regulation of gamma interferon. J. Virol 77, 5632–5638 (2003). [DOI] [PMC free article] [PubMed] [Google Scholar]
- 39.Gomez JA et al. The NeST long ncRNA controls microbial susceptibility and epigenetic activation of the interferon-γ locus. Cell 152, 743–754 (2013). [DOI] [PMC free article] [PubMed] [Google Scholar]
- 40.Walker W, Aste-Amezaga M, Kastelein RA, Trinchieri G & Hunter CA IL-18 and CD28 use distinct molecular mechanisms to enhance NK cell production of IL-12-induced IFN-gamma. J. Immunol 162, 5894–5901 (1999). [PubMed] [Google Scholar]
- 41.Schoenborn JR & Wilson CB Regulation of Interferon‐γ During Innate and Adaptive Immune Responses in Advances in Immunology vol. 96 41–101 (Academic Press, 2007). [DOI] [PubMed] [Google Scholar]
- 42.Björkström NK et al. Expression patterns of NKG2A, KIR, and CD57 define a process of CD56dim NK-cell differentiation uncoupled from NK-cell education. Blood 116, 3853–3864 (2010). [DOI] [PubMed] [Google Scholar]
- 43.Romee R et al. Cytokine activation induces human memory-like NK cells. Blood 120, 4751–4760 (2012). [DOI] [PMC free article] [PubMed] [Google Scholar]
- 44.Cooper MA et al. Cytokine-induced memory-like natural killer cells. Proc. Natl. Acad. Sci. U. S. A 106, 1915–1919 (2009). [DOI] [PMC free article] [PubMed] [Google Scholar]
- 45.Henning AN, Roychoudhuri R & Restifo NP Epigenetic control of CD8+ T cell differentiation. Nat. Rev. Immunol 18, 340–356 (2018). [DOI] [PMC free article] [PubMed] [Google Scholar]
- 46.Hu G & Chen J A genome-wide regulatory network identifies key transcription factors for memory CD8+ T-cell development. Nat. Commun 4, 2830 (2013). [DOI] [PMC free article] [PubMed] [Google Scholar]
- 47.O’Sullivan TE, Sun JC & Lanier LL Natural Killer Cell Memory. Immunity 43, 634–645 (2015). [DOI] [PMC free article] [PubMed] [Google Scholar]
- 48.Xing S et al. Tcf1 and Lef1 transcription factors establish CD8(+) T cell identity through intrinsic HDAC activity. Nat. Immunol 17, 695–703 (2016). [DOI] [PMC free article] [PubMed] [Google Scholar]
- 49.Thomas R et al. NKG2C deletion is a risk factor of HIV infection. AIDS Res. Hum. Retroviruses 28, 844–851 (2012). [DOI] [PMC free article] [PubMed] [Google Scholar]
- 50.Fregni G et al. High number of CD56(bright) NK-cells and persistently low CD4+ T-cells in a hemophiliac HIV/HCV co-infected patient without opportunistic infections. Virol. J 10, 33 (2013). [DOI] [PMC free article] [PubMed] [Google Scholar]
References for Methods
- 51.Davis ZB et al. A Conserved HIV-1-Derived Peptide Presented by HLA-E Renders Infected T-cells Highly Susceptible to Attack by NKG2A/CD94-Bearing Natural Killer Cells. PLoS Pathog. 12, e1005421 (2016). [DOI] [PMC free article] [PubMed] [Google Scholar]
- 52.Neri S, Mariani E, Meneghetti A, Cattini L & Facchini A Calcein-acetyoxymethyl cytotoxicity assay: standardization of a method allowing additional analyses on recovered effector cells and supernatants. Clin. Diagn. Lab. Immunol 8, 1131–1135 (2001). [DOI] [PMC free article] [PubMed] [Google Scholar]
- 53.Pertel T et al. TRIM5 is an innate immune sensor for the retrovirus capsid lattice. Nature 472, 361–365 (2011). [DOI] [PMC free article] [PubMed] [Google Scholar]
- 54.Poli A et al. CD56bright natural killer (NK) cells: an important NK cell subset. Immunology 126, 458–465 (2009). [DOI] [PMC free article] [PubMed] [Google Scholar]
- 55.Hashimshony T et al. CEL-Seq2: sensitive highly-multiplexed single-cell RNA-Seq. Genome Biol. 17, 77 (2016). [DOI] [PMC free article] [PubMed] [Google Scholar]
- 56.Skene PJ & Henikoff S An efficient targeted nuclease strategy for high-resolution mapping of DNA binding sites. Elife 6, (2017). [DOI] [PMC free article] [PubMed] [Google Scholar]
- 57.Hainer SJ, Boskovic A, Rando OJ & Fazzio TG Profiling of pluripotency factors in individual stem cells and early embryos. bioRxiv (2018). [DOI] [PMC free article] [PubMed] [Google Scholar]
- 58.Skene PJ, Henikoff JG & Henikoff S Targeted in situ genome-wide profiling with high efficiency for low cell numbers. Nat. Protoc 13, 1006–1019 (2018). [DOI] [PubMed] [Google Scholar]
- 59.Buenrostro JD, Wu B, Chang HY & Greenleaf WJ ATAC-seq: A Method for Assaying Chromatin Accessibility Genome-Wide. Curr. Protoc. Mol. Biol 109, 21.29.1–9 (2015). [DOI] [PMC free article] [PubMed] [Google Scholar]
- 60.Buenrostro JD, Giresi PG, Zaba LC, Chang HY & Greenleaf WJ Transposition of native chromatin for fast and sensitive epigenomic profiling of open chromatin, DNA-binding proteins and nucleosome position. Nat. Methods 10, 1213–1218 (2013). [DOI] [PMC free article] [PubMed] [Google Scholar]
- 61.Kim D et al. TopHat2: accurate alignment of transcriptomes in the presence of insertions, deletions and gene fusions. Genome Biol. 14, R36 (2013). [DOI] [PMC free article] [PubMed] [Google Scholar]
- 62.Derr A et al. End Sequence Analysis Toolkit (ESAT) expands the extractable information from single-cell RNA-seq data. Genome Res. 26, 1397–1410 (2016). [DOI] [PMC free article] [PubMed] [Google Scholar]
- 63.Love M, Anders S & Huber W Differential analysis of count data--the DESeq2 package. Genome Biol. 15, 550 (2014). [DOI] [PMC free article] [PubMed] [Google Scholar]
- 64.Hyvärinen A & Oja E Independent component analysis: algorithms and applications. Neural Netw. 13, 411–430 (2000). [DOI] [PubMed] [Google Scholar]
- 65.Hechenbichler K & Schliep K Weighted k-Nearest-Neighbor Techniques and Ordinal Classification. 399, (2004). [Google Scholar]
- 66.Robinson MD, McCarthy DJ & Smyth GK edgeR: a Bioconductor package for differential expression analysis of digital gene expression data. Bioinformatics 26, 139–140 (2010). [DOI] [PMC free article] [PubMed] [Google Scholar]
- 67.Van Der Maaten L Accelerating t-SNE using tree-based algorithms. J. Mach. Learn. Res 15, 3221–3245 (2014). [Google Scholar]
- 68.Zhang Y et al. Model-based analysis of ChIP-Seq (MACS). Genome Biol. 9, R137 (2008). [DOI] [PMC free article] [PubMed] [Google Scholar]
- 69.Robinson JT et al. Integrative genomics viewer. Nat. Biotechnol 29, 24–26 (2011). [DOI] [PMC free article] [PubMed] [Google Scholar]
Associated Data
This section collects any data citations, data availability statements, or supplementary materials included in this article.
Supplementary Materials
Data Availability Statement
The data that support the findings of this study are available within the manuscript and its supplementary information files, and are available from the corresponding author upon request. Source data for Figures 2–7 are provided with the paper. Bulk and single-cell RNA-Seq, CUT&RUN, and ATAC-Seq datasets can be found under SuperSeries GSE122326 at https://www.ncbi.nlm.nih.gov/geo/query/acc.cgi?acc=GSE97727.
GSE97727: CD94− and CD94+ NK cell bulk and single cell RNA-Seq.
GSE122324: CD94−CD56dim, CD94+CD56dim, and CD94+CD56hi NK cells RNA-Seq.
GSE122325: CD94−CD56dim NK cells, 1o stim and 5 day culture RNA-Seq.
GSE122548: CD94−CD56dim, CD94+CD56dim, and CD94+CD56hi NK cells ATAC-Seq.
GSE122549: CD94−CD56dim, CD94+CD56dim, and CD94+CD56hi NK cells CUT&RUN.


