Fig. 2.
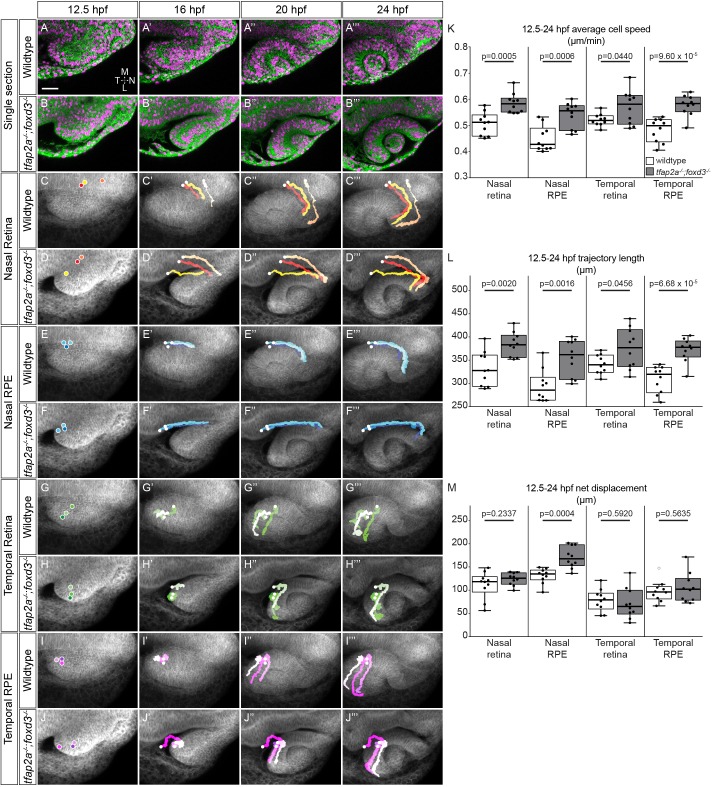
Optic cup cell movements are disrupted in tfap2a;foxd3 mutants. (A-J‴) Time-lapse imaging (12.5-24 hpf) of optic cup morphogenesis of wild-type and tfap2a;foxd3 mutant embryos. (A-B‴) Dorsal view, single confocal sections from wild-type (A-A‴) and tfap2a;foxd3 mutant (B-B‴) 4D datasets. EGFP-CAAX (green) labels cell membranes; H2A.F/Z-mCherry (magenta) labels nuclei. (C-J‴) Average projections of EGFP-CAAX channel (gray) with indicated nuclear trajectories overlaid. Trajectories were generated by accumulating nuclear selections over time. (K-M) Average 3D cell speed (K), total 3D trajectory length (L) and 3D net displacement (M) of cells contributing to each region at 24 hpf. n=10 cells from each region (two embryos/genotype, five cells each). P-values were calculated using Welch's t-test. Scale bar: 50 µm. L, lateral; M, medial; N, nasal; T, temporal.

