

Abstract
[18F]Flortaucipir is a PET tau tracer used to visualize tau binding in Alzheimer’s disease (AD) in vivo. The present study evaluated the performance of several methods to obtain parametric images of [18F]flortaucipir. One hundred and thirty minutes dynamic PET scans were performed in 10 AD patients and 10 controls. Parametric images were generated using different linearization and basis function approaches. Regional binding potential (BPND) and volume of distribution (VT) values obtained from the parametric images were compared with corresponding values derived using the reversible two-tissue compartment model (2T4k_VB). Performance of SUVr parametric images was assessed by comparing values with distribution volume ratio (DVR) and SRTM-derived BPND estimates obtained using non-linear regression (NLR). Spectral analysis (SA) (r2 = 0.92; slope = 0.99) derived VT correlated well with NLR-derived VT. RPM (r2 = 0.95; slope = 0.98) derived BPND correlated well with NLR-derived DVR. Although SUVr80–100 min correlated well with NLR-derived DVR (r2 = 0.91; slope = 1.09), bias in SUVr appeared to depend on uptake time and underlying level of specific binding. In conclusion, RPM and SA provide parametric images comparable to the NLR estimates. Individual SUVr values are biased compared with DVR and this bias requires further study in a larger dataset in order to understand its consequences.
Keywords: [18F]flortaucipir, AV-1451, tau imaging, Alzheimer’s disease, parametric imaging
Introduction
Accumulation of β-amyloid and aggregation of tau into neurofibrillary tangles (NFTs) are neuropathological hallmarks of Alzheimer’s disease (AD).1 With the introduction of positron emission tomography (PET) tau tracers, it is now possible to visualize tau in vivo. [18F]flortaucipir (also known as [18F]AV1451 or [18F]T807) is a tau PET tracer which strongly binds to NFTs.2–6 In line with neuropathological and cerebrospinal fluid (CSF) studies,7–10 in vivo tau uptake has, more than amyloid, shown strong correlations with cognitive symptoms.2,11–14 In addition, [18F]flortaucipir uptake spatially mirrors cognitive symptoms in distinct phenotypes of AD11,14 and resembles the neuropathological staging of tau.13,15,16 These features make [18F]flortaucipir a promising biomarker and potentially useful for monitoring disease severity and treatment efficacy in clinical trials.
Previously, the standard uptake value ratio (SUVr) has been widely used as a measure to assess [18F]flortaucipir uptake.17,18 Advantages of using SUVr include a shorter scan duration, insensitivity to calibration errors and computational simplicity. However, as a measure of specific binding, SUVr may be biased, as it depends on (changes in) tracer uptake and clearance rates.19,20 This is especially a concern for longitudinal studies, where variations in both true uptake and clearance may be challenging due to flow changes and require further evaluation.20,21 Although simplification of PET analysis is important for clinical implementation, careful studies are required for finding the optimal balance between simplicity and accuracy. Barret et al.22 have already performed validation of SUVr imaging time intervals against full kinetic modelling. It was concluded that even though the SUVr curves do not reach plateau in AD patients, a good correlation with binding potential (BPND) was obtained. However, the authors suggested that further investigations are required to assess the SUVr sensitivity.
Recently, it has been found that a reversible two-tissue compartmental model with additional blood volume fraction parameter (2T4k_VB) best describes in vivo [18F]flortaucipir kinetics.22–24 As such, this model can be used as a reference for optimizing parametric imaging.22–24 Previous studies have majorly reported a regional-level quantification, although a specific signal might not be homogenous in a region and gets diluted when observed at regionally. Hence it is necessary to obtain quantitatively accurate parametric images. Several parametric methods (both plasma input based and reference region based) are known; however, these methods need to be validated against non-linear regression (NLR) using metabolite-corrected plasma input function (gold standard). The first aim of the present study was to optimize several parametric methods (including SUVr) to obtain quantitatively accurate parametric images of [18F]flortaucipir. A second aim was to assess the impact of scanning interval on the accuracy of SUVr images.
Material and methods
Participants
Ten patients with probable AD and 10 cognitively healthy controls from the Amsterdam Dementia Cohort of the VU University Medical Center were included. All subjects underwent standardized dementia screening.25 Brain magnetic resonance imaging (MRI) and a lumbar puncture to quantify Aβ42, tau and p-tau in CSF were part of the standard dementia screening. AD patients were only included if they met diagnostic criteria for probable AD with at least an intermediate likelihood due to a positive [18F]florbetaben amyloid PET scan (visual read) and/or Alzheimer CSF profile (Aβ42 < 550 pg ml−1, tau > 375 pg ml−1, p-tau > 52 pg ml−1).26–28 Controls were performed within normal limits in both neuropsychological and clinical examinations. Exclusion criteria were haemoglobin levels ≤8 in males and ≤7 in females, structural abnormalities on MRI (which are likely to interfere with PET analysis, e.g. major stroke) and clinically significant cardiovascular disease or clinically significant electrocardiogram abnormalities (including, but not limited to prolonged QTc time). For each subject a written informed consent was given prior to inclusion in the study protocol. The study protocol (2014.519) was approved by the local Medical Ethics Review Committee of the VU University Medical Center. All procedures performed were in accordance with the ethical standards of the institutional research committee and with the 1975 Helsinki declaration and its later amendments.
Data acquisition
All subjects underwent a 3D T1-weighted MRI on the same 3.0 Tesla camera (Ingenuity TF PET/MR, Philips Medical Systems, Best, The Netherlands).
Dynamic PET emission scans (130 min) were acquired using a Gemini TF-64 PET/CT scanner (Philips Medical Systems, Best, The Netherlands). The scanning protocol consisted of two dynamics scans of 60 and 50 min, respectively, with a 20 min break in between. Each dynamic scanning period started with a low-dose CT scan for attenuation correction. The first 60 min dynamic scan started simultaneously with the administration of 223 ± 18 MBq of [18F]flortaucipir. PET list mode data were rebinned into a total of 29 frames and reconstructed using 3D RAMLA with a matrix size of 128 × 128 × 90 and a final voxel size of 2 × 2 × 2 mm3, including standard corrections for dead time, decay, attenuation, randoms and scatter. Each PET dataset consisted of 29 frames (1 × 15, 3 × 5, 3 × 10, 4 × 60, 2 × 150, 2 × 300, 4 × 600 and 10 × 300 s), in which the last 10 frames were of the second PET session.
Continuous arterial blood sampling, using an online detection system,29 was performed during the first dynamic scanning period (i.e. 60 min). In addition, manual arterial samples were withdrawn at set time points (5, 10, 15, 20, 40, 60, 80, 105 and 130 min post injection). The manual samples were used to estimate parent fractions, metabolite fractions and plasma to whole blood ratios. Using the aforementioned information, the continuous online blood sampler data were corrected for metabolites, plasma to whole blood ratios and delay, providing a metabolite-corrected arterial plasma input curve in addition to the uncorrected whole blood input curve. Supplementary material 1 contains further information on the input function processing.
Image processing
Average PET images were obtained by combining 8th to 12th frame (present in the first PET session) and 20th to 29th frames (present in the second PET session). The average PET image from the second PET session was co-registered to the average image from the PET first session. The co-registration matrix obtained is applied to individual frames of the second session to correct for the motion. The T1-weighted MRI images were co-registered to the PET images and segmentation of white matter, grey matter and CSF was performed using SPM8 (Wellcome Trust Centre for Neuroimaging). Sixty-eight volumes of interest (VOIs, including separate VOIs for left and right hemisphere) were defined on the MRI scans using PVElab30 with the Hammers template31 and corresponding regional time–activity curves were extracted by projecting these 68 VOIs on the dynamic PET scans. All 68 VOIs defined in the Hammers template31 were used for analysis.
Data analysis
Kinetic analysis
Previous studies have identified a reversible two-tissue compartmental model with blood volume fraction parameter (2T4k_VB) as the preferred model to describe in vivo kinetics of [18F]flortaucipir.22−24 Hence, regional kinetic parameters (distribution volume ratio (DVR), volume of distribution (VT) and rate of influx of tracer from blood to tissue (K1)) were obtained using NLR together with this model, which subsequently served as reference to optimize settings for different parametric methods.23 In addition, reference tissue-based parametric methods were also validated against corresponding kinetic parameters (BPND and ratio of K1 for VOI to reference region (R1)) obtained with the simplified reference tissue model (SRTM).
Parametric images
Parametric images were obtained using software developed in VUmc (PPET).32 Different linearization approaches were validated: plasma input Logan,33 reference Logan (RLogan)34 and five versions of the multilinear reference tissue model (MRTM0, MRTM1, MRTM2, MRTM3, MRTM4).35–37 In addition, basis function approaches such as receptor parametric mapping (RPM),38 simplified reference tissue model 2 (SRTM2)39 and spectral analysis (SA)40 were evaluated. As described by Wu and Carson,39 in SRTM2 the number of parameters is further reduced when compared to RPM implementation. This is done by fixing the reference tissue efflux rate constant (k2′). SRTM2 requires two runs. The first run is RPM implementation and in the second run k2′ was fixed to the median value of the first run.39 VT images were generated using plasma input-based Logan and SA. RLogan, MRTM, RPM and SRTM2 were used to obtain BPND images. A linear regression fitting model (weighted residual sum of squares) was used for SA. Following equation was used to estimate weighting factors
where represents the variances for each frame and is calculated based on the whole scanner trues counts (T), dcf is the decay correction factor, L represents frame length and α is the proportionality constant signifying the variance level.
The initial settings values for the parametric methods were estimated as described by Gunn et al.,38 Wu and Carson,39 Ichise and co-workers35–37 and Logan et al.33,34 Regional mean of BPND and VT values obtained from the parametric images was compared to corresponding parametric values derived using the 2T4k_VB model and where appropriate SRTM. The settings values were iterated until a best possible agreement is obtained between the parametric methods and NLR.
Finally, SUVr images generated for different time intervals (40–60, 50–60, 80–100, 80–130, 90–110, 90–120, 100–120, 100–120, 110–130 min) were evaluated. In addition, performance of the SUVr was assessed by comparing values with corresponding NLR-derived DVR and SRTM-derived BPND values. Cerebellar grey matter was used as a reference tissue, because of its low levels of tau3 and no significant differences in VT were observed between AD patients and controls of this cohort (see supplementary figure 1).
Statistical analysis
Standard deviations in parameter estimation were used to evaluate parameter reliability. Correlation (r2) and the slope were used to assess the agreement between parametric methods outputs and NLR values across all VOIs (n = 68) and across all subjects. In addition, we repeated analyses separately for each hemisphere (left and right) to investigate whether effects were independent of lateralization. Bias in the assessment of the underlying binding when using SUVr was also calculated. Bias was measured as the percentage difference of SUVr with respect to DVR. Similar bias assessment was also performed for parametric estimations of RPM and SA against respective NLR estimates
Results
Ten controls (male n = 7, 70%) with an average age of 67.7 ± 6.8 years and an MMSE score of 29.2 ± 0.6 were included. In addition, 10 AD patients (male n = 6, 60%) with an average age of 63.9 ± 7.8 years and an MMSE score of 23.9 ± 3.1 were enrolled. Considerable metabolism was seen across all subjects (86 ± 10% 5 min p.i.; 23% ± 8% 130 min p.i.) and parent fractions measured at all time points were comparable to the previous studies.22–24 One control was excluded for both Logan and SA due to an issue with online arterial blood sampling. Since the PET scan had no issues, this only concerned the input function, and therefore this subject could still be included for evaluation of reference region-based parametric methods.
Table 1 lists optimized settings for the different parametric imaging methods. Figure 1 shows VT parametric images obtained using Logan and SA for an AD patient and a control. DVR and BPND parametric images obtained using RLogan, RPM and SRTM2 implementations are illustrated in Figure 2. Logan, RLogan, RPM, SRTM2 and SA seem to provide parametric images with visually similar image quality. All MRTM parametric images were noisy and also had quantitatively inaccurate parametric values. Therefore, MRTM results are not presented in this manuscript.
Table 1.
Settings used for various parametric implementations.
| Parametric method | Interval (min) | Basis function range (min−1) | Number of basis functions |
|---|---|---|---|
| Logana | 10–130 | – | – |
| Spectral analysisa | 0–130 | 0.01–1 | 30 |
| RLoganb | 40–130 | – | – |
| RPMb | 0–130 | 0.01–0.1 | 30 |
| SRTM2b | 0–130 | 0.01–0.1 | 30 |
| MRTM0b | 10–130 | – | – |
| MRTM1b | 10–130 | – | – |
| MRTM2b | 10–130 | – | – |
| MRTM3b | 10–130 | – | – |
| MRTM4b | 10–130 | – | – |
2T4k_VB (plasma input model).
SRTM (simplified reference tissue model) with cerebellar grey matter as reference region.
MRTM: multilinear reference tissue model; RLogan: reference Logan; RPM: receptor parametric mapping; SRTM2: simplified reference tissue model 2.
Figure 1.

(a) Logan- and SA-derived VT parametric images for a representative AD patient and a control. Correlation for (b) Logan and (c) SA VT values with corresponding NLR estimates. LOI is line of identity. AD: Alzheimer’s disease; NLR: non-linear regression; SA: spectral analysis.
Figure 2.

(a) RLogan-, RPM- and SRTM2-derived DVR/BPND parametric images for a representative AD patient and a control. Correlations for (b) RPM, (c) SRTM2 and (d) RLogan DVR/BPND values with corresponding NLR estimates. LOI is line of identity. AD: Alzheimer’s disease; BPND: binding potential; DVR-1: distribution volume ratio; NLR: non-linear regression; RLogan: reference Logan; RPM: receptor parametric mapping; SRTM2: simplified reference tissue model 2.
Regional VT values derived from parametric Logan images (r2 = 0.95; slope = 0.80) and SA (r2 = 0.92; slope = 0.99) correlated well with their corresponding 2T4k_VB-derived VT values (Figure 1). RLogan, RPM and SRTM2 correlated well with indirect BPND (DVR-1) (r2 = 0.93, 0.95 and 0.95, respectively; Figure 2). Results were essentially comparable when repeating analyses stratified for hemisphere (data not shown). Even though Logan correlates well with the NLR estimates, an underestimation of ∼20% in case of plasma input-based implementation and ∼7% for reference-based implementation was observed. Both RPM and SRTM2 R1 correlated well with SRTM R1 (both r2 = 0.94; slope = 0.98). However, K1 estimated using SA has an underestimation when compared to the NLR (2T4k_VB) estimations (supplementary Figure 1). Correlation coefficients (r2), slopes and intercepts of the correlation (separately for AD patients and controls) between the various parametric methods and their corresponding NLR estimates are shown in Table 2. Parametric BPND images obtained using RLogan, RPM and SRTM2 for a typical AD patient are shown in Figure 3. Similar images were created for a typical control subject in Figure 4. In addition, SUVr images using different time intervals were also added to Figures 3 and 4. To study inter-subject variability for different plasma input and reference input methods, we calculated average bias and inter-subject variability (Supplementary Table 1). Almost all the parametric methods show a similar low inter-subject variability for controls (SD ranging from 0.03 to 0.09), but in case of AD patients, a higher SD (0.33) was observed for SUVr80–100. Supplementary Figure 2 presents the bias assessment for parametric estimates of RPM and SA when compared to NLR estimates.
Table 2.
Linear regression parameters of parametric [18F]flortaucipir VT and BPND against corresponding NLR estimates.
| r2 | Intercept | Slope | |
|---|---|---|---|
| Logan | 0.95 | 0.65 | 0.80 |
| Spectral analysis | 0.92 | −0.04 | 0.99 |
| RLogan | 0.93 | 0.22 | 0.79 |
| RPM | 0.95 | 0.03 | 0.98 |
| SRTM2 | 0.95 | 0.02 | 0.96 |
| MRTM0 | 0.90 | 0.01 | 0.71 |
| MRTM1 | 0.90 | 0.03 | 1.22 |
| MRTM2 | 0.92 | 0.02 | 0.91 |
| MRTM3 | 0.91 | 0.01 | 0.73 |
| MRTM4 | 0.94 | −0.01 | 1.01 |
BPND: binding potential; MRTM: multilinear reference tissue model; NLR: non-linear regression; RLogan: reference Logan; RPM: receptor parametric mapping; SRTM2: simplified reference tissue model 2.
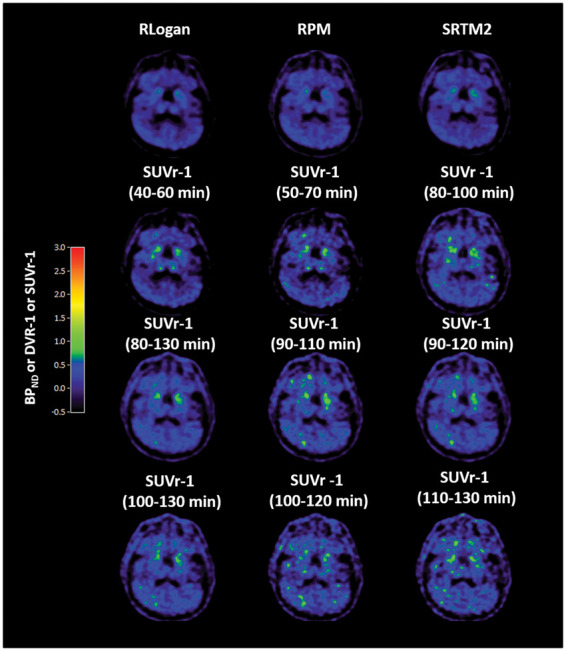
Figure 3.

SUVr-1 images of an AD patient for different time intervals. BPND images obtained using RLogan, RPM and SRTM2 are also shown as reference for specific binding. BPND: binding potential; DVR-1: distribution volume ratio; RLogan: reference Logan; RPM: receptor parametric mapping; SRTM2: simplified reference tissue model 2; SUVr-1: standard uptake value ratio.
Figure 4.
SUVr-1 images of a control for different time intervals. BPND images obtained using RLogan, RPM and SRTM2 are also shown as reference for specific binding. BPND: binding potential; DVR-1: distribution volume ratio; RLogan: reference Logan; RPM: receptor parametric mapping; SRTM2: simplified reference tissue model 2; SUVr-1: standard uptake value ratio.
SUVr
SUVr-1 images obtained using different scan time intervals are shown in Figures 3 and 4 for an AD patient and a control, respectively. SUVr-1(80–100 min) appeared visually similar to RLogan, RPM and SRTM2 BPND images. In addition, SUVr(80–100 min) showed good correlation with both NLR-derived DVR (r2 = 0.91; slope = 1.09) and SRTM-derived BPND (r2 = 0.83; slope = 0.90), although, even at 130 min, SUVr plots of whole brain grey matter still increased with uptake time in some AD subjects (Supplementary Figure 3). Moreover, as shown in Figure 5, bias of SUVr (in all Hammers template VOIs) appeared to depend on uptake time and underlying level of specific binding. Supplementary Figure 4 and Supplementary Table 1 further illustrate SUVr80–100 min variability in bias for different regions within a patient (intra-subject) and also between patients (inter-subject).
Figure 5.

Bar plots of % bias (mean ± SD) observed in SUVr with respect to the NLR-estimated DVR (BPND + 1) for different SUVr time intervals for all the grey matter VOIs from hammers template. AD: Alzheimer’s disease; SUVr: standard uptake value ratio.
Discussion
So far, studies have shown a substantial difference in [18F]flortaucipir accumulation between AD patients and controls in tau-specific regions using a VOI approach.22–24,41–43 In general, however, tau signal is not homogenous throughout a VOI, implying that some potentially significant differences might have been lost due to spatial dilution of the specific signal across a VOI. Moreover, to provide clinicians with accurate quantitative images, use of parametric images is necessary. Therefore, different methods to obtain quantitatively accurate parametric images were assessed in this study. Regarding plasma input-based parametric methods, SA correlates best with 2T4k_VB (NLR) estimates and for reference region-based methods, RPM correlated best with SRTM (NLR) estimates. Bias was observed for SUVr(80–100 min) which depended on uptake time and tau-specific signal.
As previously reported,22,24 and also illustrated in Figure 1, Logan slightly underestimated VT when compared with corresponding regional NLR estimates. This underestimation could be noise induced,44 but could also, at least in part, be due to the fact that the Logan method does not account for the blood volume fraction. Although, in case of a constant VB, an additional factor could be introduced to correct for this bias, this was not possible as VB varied between subjects and regions. SA is a plasma input-based basis function approach that also accounts for VB resulting in a better agreement with NLR estimates when compared with Logan. Another important advantage of SA is that it also generates K1 parametric images.
Reference region methods, such as RLogan and RPM, also showed good correlations with corresponding regional SRTM-derived values. Again, some underestimation was observed in case of RLogan, which could be due to the same reasons as mentioned above for Logan. On the other hand, reference region-based basis function approaches (RPM, SRTM2) were able to provide estimates without underestimation. SRTM2 is an adaptation of RPM in which the number of parameters is reduced from 3 to 2 by running RPM twice, the second time fixing the efflux rate of the reference region k2′ to its median (all voxels) from the first run. In theory this approach should provide more stable estimates of R1 and BPND, but this was not seen in the present study. One explanation would be that scan statistics were good enough to provide stable fits for RPM. Apparently, for [18F]flortaucipir, reducing the number of fit parameters did not affect parameter estimations.
Several clinical studies17,18 have used [18F]flortaucipir SUVr as outcome measure. Baker et al.41 analysed different SUVr intervals in comparison with reference tissue models and concluded that for a combination of high and low binding sites, the interval of SUVr80–100 min had the best correlation.41 However, as can be seen from supplementary Figure 3, SUVr does not become constant, even after 130 min, in case of AD patients. This has also been described by Barret et al.,22 who did not find equilibrium even at 210 min p.i. The bias in SUVr for a specific scan interval is not constant, but appears to depend on the underlying tau load (Figures 5 and 6). In case of healthy controls, bias was relatively constant (∼10%) for different scan intervals, provided the start time was at 80 min or later. Interestingly, in case of AD, not only a higher bias was observed, but also higher variability. In addition, bias seemed to vary between different regions in the same patient, as illustrated in Supplementary Figure 4. In clinical practice, SUVr images can possibly be used for clinical diagnosis (i.e. assessment of positive versus negative), but for longitudinal studies and treatment evaluation, where quantification becomes essential, SUVr may provide erroneous results. For the first (clinical) question any of the parametric methods, except MRTM, could be used. For longitudinal studies, however, the bias between SUVr and BPND images needs to be further evaluated, to conclude which parametric images are required to provide the best quantitative information on changes in specific binding. Another issue that needs to be further addressed in future studies is ‘off-target’ binding. Although we make use of advanced parametric methods, we still see ‘off-target’ binding, in for example the choroid plexus. This confirms that this ‘off-target binding’ is non-selective binding of [18F]flortaucipir and not an artefact, due to, for example, flow differences.
Conclusion
Quantitatively accurate VT and BPND images can be obtained by using SA and RPM, respectively. SUVr80–100 min correlates well with BPND but observed bias was dependent on underlying tau load.
Supplemental Material
Supplemental material, Supplemental Material1 for Parametric methods for [18F]flortaucipir PET by Sandeep SV Golla, Emma E Wolters, Tessa Timmers, Rik Ossenkoppele, Chris WJ van der Weijden, Philip Scheltens, Lothar Schwarte, Mark A Mintun, Michael D Devous Sr, Robert C Schuit, Albert D Windhorst, Adriaan A Lammertsma, Maqsood Yaqub, Bart NM van Berckel and Ronald Boellaard in Journal of Cerebral Blood Flow & Metabolism
Supplemental material, Supplemental Material2 for Parametric methods for [18F]flortaucipir PET by Sandeep SV Golla, Emma E Wolters, Tessa Timmers, Rik Ossenkoppele, Chris WJ van der Weijden, Philip Scheltens, Lothar Schwarte, Mark A Mintun, Michael D Devous Sr, Robert C Schuit, Albert D Windhorst, Adriaan A Lammertsma, Maqsood Yaqub, Bart NM van Berckel and Ronald Boellaard in Journal of Cerebral Blood Flow & Metabolism
Supplemental material, Supplemental Material3 for Parametric methods for [18F]flortaucipir PET by Sandeep SV Golla, Emma E Wolters, Tessa Timmers, Rik Ossenkoppele, Chris WJ van der Weijden, Philip Scheltens, Lothar Schwarte, Mark A Mintun, Michael D Devous Sr, Robert C Schuit, Albert D Windhorst, Adriaan A Lammertsma, Maqsood Yaqub, Bart NM van Berckel and Ronald Boellaard in Journal of Cerebral Blood Flow & Metabolism
Supplemental material, Supplemental Material4 for Parametric methods for [18F]flortaucipir PET by Sandeep SV Golla, Emma E Wolters, Tessa Timmers, Rik Ossenkoppele, Chris WJ van der Weijden, Philip Scheltens, Lothar Schwarte, Mark A Mintun, Michael D Devous Sr, Robert C Schuit, Albert D Windhorst, Adriaan A Lammertsma, Maqsood Yaqub, Bart NM van Berckel and Ronald Boellaard in Journal of Cerebral Blood Flow & Metabolism
Supplemental material, Supplemental Material5 for Parametric methods for [18F]flortaucipir PET by Sandeep SV Golla, Emma E Wolters, Tessa Timmers, Rik Ossenkoppele, Chris WJ van der Weijden, Philip Scheltens, Lothar Schwarte, Mark A Mintun, Michael D Devous Sr, Robert C Schuit, Albert D Windhorst, Adriaan A Lammertsma, Maqsood Yaqub, Bart NM van Berckel and Ronald Boellaard in Journal of Cerebral Blood Flow & Metabolism
Supplemental Material
Supplemental material, Supplemental Material6 for Parametric methods for [18F]flortaucipir PET by Sandeep SV Golla, Emma E Wolters, Tessa Timmers, Rik Ossenkoppele, Chris WJ van der Weijden, Philip Scheltens, Lothar Schwarte, Mark A Mintun, Michael D Devous Sr, Robert C Schuit, Albert D Windhorst, Adriaan A Lammertsma, Maqsood Yaqub, Bart NM van Berckel and Ronald Boellaard in Journal of Cerebral Blood Flow & Metabolism
Authors’ contributions
SSVG: acquiring data, analysing and interpreting data, drafting the manuscript, approving the final content of the manuscript. EEW: acquiring data, analysing and interpreting data, drafting the manuscript, approving the final content of the manuscript. TT: acquiring data, critically revising the manuscript, approving the final content of the manuscript. RO: contributing to conception and design, enhancing its intellectual content, approving the final content of the manuscript. CWJW: analysing and interpreting data, critically revising the manuscript, approving the final content of the manuscript. PS: contributing to conception and design, enhancing its intellectual content, approving the final content of the manuscript. LS: acquiring data, critically revising the manuscript, approving the final content of the manuscript. MAM: critically revising the manuscript, approving the final content of the manuscript. MDD Sr: critically revising the manuscript, approving the final content of the manuscript. RCS: acquiring data, analysing and interpreting data, critically contributing to the manuscript, approving the final content of the manuscript. ADW: contributing to conception and design, enhancing its intellectual content, approving the final content of the manuscript. AAL: contributing to conception and design, analysing and interpreting data, drafting the manuscript and enhancing its intellectual content, approving the final content of the manuscript. MY: contributing to conception and design, analysing and interpreting data, drafting the manuscript and enhancing its intellectual content, approving the final content of the manuscript. BNMB: contributing to conception and design, analysing and interpreting data, drafting the manuscript and enhancing its intellectual content, approving the final content of the manuscript. RB: contributing to conception and design, analysing and interpreting data, drafting the manuscript and enhancing its intellectual content, approving the final content of the manuscript.
Disclosures
AVID contributed to the implementation and writing of this study, but did not contribute to the design and analysis of this report. Devous and Mintun are employees of Avid Radiopharmaceuticals Inc., a wholly owned subsidiary of Eli Lilly and Company.
Funding
The author(s) disclosed receipt of the following financial support for the research, authorship, and/or publication of this article: This study was carried out with financial support from AVID to VU University Medical Center. This research was funded by AVID Radiopharmaceuticals, ZonMw. Sandeep SV Golla was supported by the European Union’s Seventh Framework Programme (FP7/2007-2013), grant agreement no. HEALTH-F2-2011-278850 (INMiND). Scheltens received grant support (for the institution) from GE Healthcare, Danone Research, Piramal and MERCK. In the past two years, he has received consultancy/speaker fees from Lilly, GE Healthcare, Novartis, Forum, Sanofi, Nutricia, Probiodrug and EIP Pharma. All funding are paid to the institution.
Declaration of conflicting interests
The author(s) declared no potential conflicts of interest with respect to the research, authorship, and/or publication of this article.
Supplementary material
Supplementary material for this paper can be found at the journal website: http://journals.sagepub.com/home/jcb
References
- 1.Nelson PT, Braak H, Markesbery WR. Neuropathology and cognitive impairment in Alzheimer disease: a complex but coherent relationship. J Neuropathol Exp Neurol 2009; 68: 1–14. [DOI] [PMC free article] [PubMed] [Google Scholar]
- 2.Chien DT, Bahri S, Szardenings AK, et al. Early clinical PET imaging results with the novel PHF-Tau Radioligand [F-18]-T807. J Alzheimers Dis 2013; 34: 457–468. [DOI] [PubMed] [Google Scholar]
- 3.Marquie M, Normandin MD, Vanderburg CR, et al. Validating novel tau positron emission tomography tracer [F-18]-AV-1451 (T807) on postmortem brain tissue. Ann Neurol 2015; 78: 787–800. [DOI] [PMC free article] [PubMed] [Google Scholar]
- 4.Lowe VJ, Curran G, Fang P, et al. An autoradiographic evaluation of AV-1451 Tau PET in dementia. Acta Neuropathol Commun 2016; 4: 58. [DOI] [PMC free article] [PubMed] [Google Scholar]
- 5.Sander K, Lashley T, Gami P, et al. Characterization of tau positron emission tomography tracer [18F]AV-1451 binding to postmortem tissue in Alzheimer’s disease, primary tauopathies, and other dementias. Alzheimers Dement 2016; 12: 1116–1124. [DOI] [PubMed] [Google Scholar]
- 6.Xia CF, Arteaga J, Chen G, et al. [(18)F]T807, a novel tau positron emission tomography imaging agent for Alzheimer’s disease. Alzheimers Dement 2013; 9: 666–676. [DOI] [PubMed] [Google Scholar]
- 7.Arriagada PV, Growdon JH, Hedley-Whyte ET, et al. Neurofibrillary tangles but not senile plaques parallel duration and severity of Alzheimer’s disease. Neurology 1992; 42: 631–639. [DOI] [PubMed] [Google Scholar]
- 8.Nelson PT, Alafuzoff I, Bigio EH, et al. Correlation of Alzheimer disease neuropathologic changes with cognitive status: a review of the literature. J Neuropathol Exp Neurol 2012; 71: 362–381. [DOI] [PMC free article] [PubMed] [Google Scholar]
- 9.van Rossum IA, Visser PJ, Knol DL, et al. Injury markers but not amyloid markers are associated with rapid progression from mild cognitive impairment to dementia in Alzheimer’s disease. J Alzheimers Dis 2012; 29: 319–327. [DOI] [PubMed] [Google Scholar]
- 10.Rolstad S, Berg AI, Bjerke M, et al. Cerebrospinal fluid biomarkers mirror rate of cognitive decline. J Alzheimers Dis 2013; 34: 949–956. [DOI] [PubMed] [Google Scholar]
- 11.Ossenkoppele R, Schonhaut DR, Scholl M, et al. Tau PET patterns mirror clinical and neuroanatomical variability in Alzheimer’s disease. Brain 2016; 139: 1551–1567. [DOI] [PMC free article] [PubMed] [Google Scholar]
- 12.Johnson KA, Schultz A, Betensky RA, et al. Tau positron emission tomographic imaging in aging and early Alzheimer disease. Ann Neurol 2016; 79: 110–119. [DOI] [PMC free article] [PubMed] [Google Scholar]
- 13.Scholl M, Lockhart SN, Schonhaut DR, et al. PET imaging of tau deposition in the aging human brain. Neuron 2016; 89: 971–982. [DOI] [PMC free article] [PubMed] [Google Scholar]
- 14.Pontecorvo MJ, Devous MD, Sr, Navitsky M, et al. Relationships between flortaucipir PET tau binding and amyloid burden, clinical diagnosis, age and cognition. Brain 2017; 140: 748–763. [DOI] [PMC free article] [PubMed] [Google Scholar]
- 15.Schwarz AJ, Yu P, Miller BB, et al. Regional profiles of the candidate tau PET ligand 18F-AV-1451 recapitulate key features of Braak histopathological stages. Brain 2016; 139: 1539–1550. [DOI] [PubMed] [Google Scholar]
- 16.Cho H, Choi JY, Hwang MS, et al. In vivo cortical spreading pattern of tau and amyloid in the Alzheimer disease spectrum. Ann Neurol 2016; 80: 247–258. [DOI] [PubMed] [Google Scholar]
- 17.Hall B, Mak E, Cervenka S, et al. In vivo tau PET imaging in dementia: pathophysiology, radiotracer quantification, and a systematic review of clinical findings. Ageing Res Rev 2017; 36: 50–63. [DOI] [PubMed] [Google Scholar]
- 18.Villemagne VL. Selective tau imaging: Der Stand der Dinge. J Nucl Med. Epub ahead of print 21 September 2017. DOI: 10.2967/jnumed.117.198325. [DOI] [PubMed]
- 19.Ossenkoppele R, Prins ND, van Berckel BN. Amyloid imaging in clinical trials. Alzheimers Res Ther 2013; 5: 36. [DOI] [PMC free article] [PubMed] [Google Scholar]
- 20.van Berckel BN, Ossenkoppele R, Tolboom N, et al. Longitudinal amyloid imaging using 11C-PiB: methodologic considerations. J Nucl Med 2013; 54: 1570–1576. [DOI] [PubMed] [Google Scholar]
- 21.Kogure D, Matsuda H, Ohnishi T, et al. Longitudinal evaluation of early Alzheimer’s disease using brain perfusion SPECT. J Nucl Med 2000; 41: 1155–1162. [PubMed] [Google Scholar]
- 22.Barret O, Alagille D, Sanabria S, et al. Kinetic modeling of the Tau PET tracer 18F-AV-1451 in human healthy volunteers and Alzheimer’s disease subjects. J Nucl Med. Epub ahead of print 1 December 2016. DOI: 10.2967/jnumed.116.182881. [DOI] [PubMed]
- 23.Golla SS, Timmers T, Ossenkoppele R, et al. Quantification of tau load using [18F]AV1451 PET. Mol Imaging Biol 2017; 19: 963–971. [DOI] [PMC free article] [PubMed]
- 24.Wooten D, Guehl NJ, Verwer EE, et al. Pharmacokinetic evaluation of the tau PET radiotracer [18F]T807 ([18F]AV-1451) in human subjects. J Nucl Med 2017; 58: 484–491. [DOI] [PMC free article] [PubMed]
- 25.van der Flier WM, Pijnenburg YA, Prins N, et al. Optimizing patient care and research: the Amsterdam Dementia Cohort. J Alzheimers Dis 2014; 41: 313–327. [DOI] [PubMed] [Google Scholar]
- 26.Seibyl J, Catafau AM, Barthel H, et al. Impact of training method on the robustness of the visual assessment of 18F-florbetaben PET scans: results from a phase-3 study. J Nucl Med 2016; 57: 900–906. [DOI] [PubMed] [Google Scholar]
- 27.McKhann GM, Knopman DS, Chertkow H, et al. The diagnosis of dementia due to Alzheimer’s disease: recommendations from the National Institute on Aging-Alzheimer’s Association workgroups on diagnostic guidelines for Alzheimer’s disease. Alzheimers Dement 2011; 7: 263–269. [DOI] [PMC free article] [PubMed] [Google Scholar]
- 28.Zwan M, van Harten A, Ossenkoppele R, et al. Concordance between cerebrospinal fluid biomarkers and [11C]PIB PET in a memory clinic cohort. J Alzheimers Dis 2014; 41: 801–807. [DOI] [PubMed] [Google Scholar]
- 29.Boellaard R, van Lingen A, van Balen SC, et al. Characteristics of a new fully programmable blood sampling device for monitoring blood radioactivity during PET. Eur J Nucl Med 2001; 28: 81–89. [DOI] [PubMed] [Google Scholar]
- 30.Svarer C, Madsen K, Hasselbalch SG, et al. MR-based automatic delineation of volumes of interest in human brain PET images using probability maps. Neuroimage 2005; 24: 969–979. [DOI] [PubMed] [Google Scholar]
- 31.Hammers A, Allom R, Koepp MJ, et al. Three-dimensional maximum probability atlas of the human brain, with particular reference to the temporal lobe. Hum Brain Mapp 2003; 19: 224–247. [DOI] [PMC free article] [PubMed] [Google Scholar]
- 32.Boellaard R, Yaqub M, Lubberink M, et al. PPET: a software tool for kinetic and parametric analyses of dynamic PET studies. Neuroimage 2006; 31: T62–T62. [Google Scholar]
- 33.Logan J, Fowler JS, Volkow ND, et al. Graphical analysis of reversible radioligand binding from time-activity measurements applied to [N-11C-methyl]-(-)-cocaine PET studies in human subjects. J Cereb Blood Flow Metab 1990; 10: 740–747. [DOI] [PubMed] [Google Scholar]
- 34.Logan J, Fowler JS, Volkow ND, et al. Distribution volume ratios without blood sampling from graphical analysis of PET data. J Cereb Blood Flow Metab 1996; 16: 834–840. [DOI] [PubMed] [Google Scholar]
- 35.Ichise M, Ballinger JR. From graphical analysis to multilinear regression analysis of reversible radioligand binding. J Cereb Blood Flow Metab 1996; 16: 750–752. [DOI] [PubMed] [Google Scholar]
- 36.Ichise M, Liow JS, Lu JQ, et al. Linearized reference tissue parametric imaging methods: application to [11C]DASB positron emission tomography studies of the serotonin transporter in human brain. J Cereb Blood Flow Metab 2003; 23: 1096–1112. [DOI] [PubMed] [Google Scholar]
- 37.Ichise M, Toyama H, Innis RB, et al. Strategies to improve neuroreceptor parameter estimation by linear regression analysis. J Cereb Blood Flow Metab 2002; 22: 1271–1281. [DOI] [PubMed] [Google Scholar]
- 38.Gunn RN, Lammertsma AA, Hume SP, et al. Parametric imaging of ligand-receptor binding in PET using a simplified reference region model. Neuroimage 1997; 6: 279–287. [DOI] [PubMed] [Google Scholar]
- 39.Wu Y, Carson RE. Noise reduction in the simplified reference tissue model for neuroreceptor functional imaging. J Cereb Blood Flow Metab 2002; 22: 1440–1452. [DOI] [PubMed] [Google Scholar]
- 40.Cunningham VJ, Jones T. Spectral analysis of dynamic PET studies. J Cereb Blood Flow Metab 1993; 13: 15–23. [DOI] [PubMed] [Google Scholar]
- 41.Baker SL, Lockhart SN, Price JC, et al. Reference tissue-based kinetic evaluation of 18F-AV-1451 for Tau imaging. J Nucl Med 2017; 58: 332–338. [DOI] [PMC free article] [PubMed] [Google Scholar]
- 42.Shcherbinin S, Schwarz AJ, Joshi A, et al. Kinetics of the tau PET tracer 18F-AV-1451 (T807) in subjects with normal cognitive function, mild cognitive impairment, and Alzheimer disease. J Nucl Med 2016; 57: 1535–1542. [DOI] [PubMed] [Google Scholar]
- 43.Hahn A, Schain M, Erlandsson M, et al. Modeling strategies for quantification of in vivo 18F-AV-1451 binding in patients with tau pathology. J Nucl Med 2017; 58: 623–631. [DOI] [PubMed] [Google Scholar]
- 44.Slifstein M, Laruelle M. Effects of statistical noise on graphic analysis of PET neuroreceptor studies. J Nucl Med 2000; 41: 2083–2088. [PubMed] [Google Scholar]
Associated Data
This section collects any data citations, data availability statements, or supplementary materials included in this article.
Supplementary Materials
Supplemental material, Supplemental Material1 for Parametric methods for [18F]flortaucipir PET by Sandeep SV Golla, Emma E Wolters, Tessa Timmers, Rik Ossenkoppele, Chris WJ van der Weijden, Philip Scheltens, Lothar Schwarte, Mark A Mintun, Michael D Devous Sr, Robert C Schuit, Albert D Windhorst, Adriaan A Lammertsma, Maqsood Yaqub, Bart NM van Berckel and Ronald Boellaard in Journal of Cerebral Blood Flow & Metabolism
Supplemental material, Supplemental Material2 for Parametric methods for [18F]flortaucipir PET by Sandeep SV Golla, Emma E Wolters, Tessa Timmers, Rik Ossenkoppele, Chris WJ van der Weijden, Philip Scheltens, Lothar Schwarte, Mark A Mintun, Michael D Devous Sr, Robert C Schuit, Albert D Windhorst, Adriaan A Lammertsma, Maqsood Yaqub, Bart NM van Berckel and Ronald Boellaard in Journal of Cerebral Blood Flow & Metabolism
Supplemental material, Supplemental Material3 for Parametric methods for [18F]flortaucipir PET by Sandeep SV Golla, Emma E Wolters, Tessa Timmers, Rik Ossenkoppele, Chris WJ van der Weijden, Philip Scheltens, Lothar Schwarte, Mark A Mintun, Michael D Devous Sr, Robert C Schuit, Albert D Windhorst, Adriaan A Lammertsma, Maqsood Yaqub, Bart NM van Berckel and Ronald Boellaard in Journal of Cerebral Blood Flow & Metabolism
Supplemental material, Supplemental Material4 for Parametric methods for [18F]flortaucipir PET by Sandeep SV Golla, Emma E Wolters, Tessa Timmers, Rik Ossenkoppele, Chris WJ van der Weijden, Philip Scheltens, Lothar Schwarte, Mark A Mintun, Michael D Devous Sr, Robert C Schuit, Albert D Windhorst, Adriaan A Lammertsma, Maqsood Yaqub, Bart NM van Berckel and Ronald Boellaard in Journal of Cerebral Blood Flow & Metabolism
Supplemental material, Supplemental Material5 for Parametric methods for [18F]flortaucipir PET by Sandeep SV Golla, Emma E Wolters, Tessa Timmers, Rik Ossenkoppele, Chris WJ van der Weijden, Philip Scheltens, Lothar Schwarte, Mark A Mintun, Michael D Devous Sr, Robert C Schuit, Albert D Windhorst, Adriaan A Lammertsma, Maqsood Yaqub, Bart NM van Berckel and Ronald Boellaard in Journal of Cerebral Blood Flow & Metabolism
Supplemental material, Supplemental Material6 for Parametric methods for [18F]flortaucipir PET by Sandeep SV Golla, Emma E Wolters, Tessa Timmers, Rik Ossenkoppele, Chris WJ van der Weijden, Philip Scheltens, Lothar Schwarte, Mark A Mintun, Michael D Devous Sr, Robert C Schuit, Albert D Windhorst, Adriaan A Lammertsma, Maqsood Yaqub, Bart NM van Berckel and Ronald Boellaard in Journal of Cerebral Blood Flow & Metabolism