Abstract
Brown and beige adipose tissue thermogenesis can combat metabolic disease, which requires activation by extrinsic stimuli1. Adipocyte lipolysis through cAMP/PKA signaling initiates thermogenic respiration, and this pathway has been subject to longstanding clinical investigation2–4. Here we apply a comparative metabolomic approach and identify an independent metabolic pathway that controls acute activation of adipose tissue thermogenesis in vivo. We show that substantial and selective accumulation of the tricarboxylic acid (TCA) cycle intermediate succinate is a metabolic signature of thermogenic adipose tissue upon activation by exposure to cold. Succinate accumulation occurs independently of the adrenergic cascade and is sufficient to elevate brown adipocyte thermogenic respiration in vivo. This selective accumulation can be driven by a newfound capacity for brown adipocytes to sequester elevated circulating succinate, furthermore, brown adipose tissue (BAT)-dependent thermogenesis can be initiated by systemic administration of succinate in mice. Succinate that is accumulated from the extracellular milieu is rapidly taken up by brown adipocyte mitochondria, and its oxidation by succinate dehydrogenase (SDH) is required for its activation of thermogenesis. Mechanistically, we find that SDH mediated-succinate oxidation initiates reactive oxygen species (ROS) production and thereby drives uncoupling protein 1 (UCP1)-dependent thermogenic respiration, while SDH inhibition supresses thermogenesis. Finally, we show that this pathway can be activated by pharmacological elevation of circulating succinate to drive UCP1-dependent BAT thermogenesis in vivo, which stimulates robust protection against diet-induced obesity and improves glucose tolerance. These findings reveal an unexpected mechanism for control of thermogenesis in vivo, utilizing succinate as a systemically-derived thermogenic molecule.
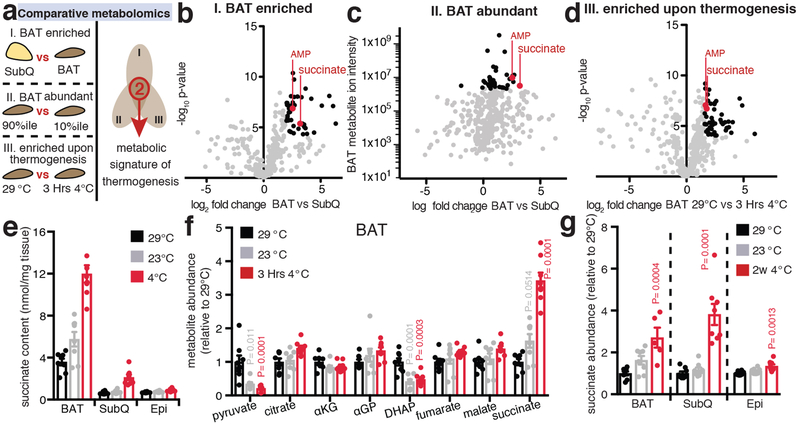
Activation of thermogenesis in brown and beige adipose tissues increases energy expenditure and can combat metabolic disease1. Exposure to environmental cold drives adrenergic stimulation, BAT heat production, and improves metabolic profiles in mice5 and humans6. However, pharmacological targeting of adrenoreceptors has so far shown limited clinical efficacy2–4. Here we explored the hypothesis that independent metabolic signals may contribute to acute activation of thermogenesis in BAT and beige fat. We applied a comparative metabolomics approach to identify conserved metabolic signatures of mouse adipose tissue thermogenesis (Fig. 1a), which gated on three criteria: i) metabolite enrichment in thermogenic adipose tissue (BAT vs subcutaneous white; Fig. 1b); ii) metabolite abundance in thermogenic adipose tissue (estimated as 10% most abundant annotated metabolite ion intensities; Fig. 1c); iii) increased metabolite abundance upon acute activation of BAT thermogenesis by exposure to 4°C vs 29°C (Fig. 1d). Remarkably, this comparative analysis revealed that only two metabolites fulfilled these criteria for a thermogenic signature (Fig. 1a–d and Supplementary Tables 1–3). One of these was the mitochondrial TCA cycle intermediate succinate, and the other was AMP. Absolute succinate concentrations in 4°C-activated BAT were substantial and selective compared to other TCA cycle metabolites (Fig. 1 e,f and Extended Data Fig 1a, b). Additionally, increasing beige adipocyte content in subcutaneous adipose tissue by chronic exposure to 4°C significantly increased succinate abundance (Fig. 1g).
Figure 1: Selective accumulation of succinate is a metabolic signature of adipose tissue thermogenesis.
a-d, (a) Comparative metabolomics strategy. Annotated metabolites (grey), metabolites fulfilling each individual criterion (black), metabolites fulfilling all criteria (red). BAT enriched metabolites in (b) were defined as fold change > 4 and −log10p > 4 versus subcutaneous inguinal adipose tissue (SubQ). Abundant BAT metabolites in (c) were defined as those within the 10% most abundant annotated metabolite ion intensities, although abundance determination in this way is not absolute, as ion intensity can vary between species on the basis of factors other than abundance. BAT metabolites enriched upon activation of thermogenesis by exposure to 4°C for 3 Hrs in (d) were defined as fold change > 3 and −log10p > 4 versus BAT in mice housed at 29°C (n = 8). e, Absolute succinate content in adipose tissues (n = 8). BAT 3 Hrs at 4°C, SubQ and epididymal (Epi) 2w at 4°C. f, Abundance of mitochondrial and proximal metabolites in BAT at 29°C, 23°C, and 3 Hrs exposure to 4°C (n = 8). g, Abundance of succinate in BAT, SubQ, and Epi comparing 29°C to 2 weeks 4°C exposure (n = 8; 2w 4°C BAT n = 5). b-d, univariate two-sided t-test; f,g, one-way ANOVA; data are mean of biologically independent samples ± s.e.m.
To investigate the role of succinate in BAT thermogenesis we explored the mechanisms responsible for driving its selective accumulation. While pharmacological β-adrenergic stimulation of BAT was sufficient to drive triglyceride lipolysis (Extended Data Fig. 2a–c), neither β1,2- nor β3-adrenergic stimulation had an effect on BAT succinate levels (Fig. 1h). So, selective and substantial accumulation of succinate is a signature of adipose tissue thermogenesis upon cold exposure but not β-adrenergic signaling. We next tested the role of inputs to succinate in BAT through TCA metabolism by oxidation of carbons from glucose and fatty acids (Extended Data Fig. 3a). Following bolus intravenous (i.v.) tail vein injection [U-13C]-glucose was taken up by BAT (Extended Data Fig. 3b) and oxidized by the TCA cycle (Extended Data Fig. 3c–h). Interestingly, (m + 3) fractional labelling of lactate was elevated compared to other glycolytic intermediates (Extended Data Fig. 3c). So, BAT may utilize circulating lactate as a major carbon source for the TCA cycle in vivo, consistent with recent observations in other tissues7,8. However, the fractional contribution of [U-13C]-glucose to succinate was unchanged in BAT following exposure to 4°C and was comparable to other TCA cycle metabolites (Extended Data Fig. 3f). [U-13C]-palmitate, administered i.v. as a bolus was also readily taken up by BAT (Extended Data Fig. 3i) and TCA cycle intermediates were enriched in 13C-carbons derived from palmitate oxidation (Extended Data Fig. 3j–m). Following exposure to 4°C the fractional contribution of [U-13C]-palmitate to succinate remained unchanged and was comparable to other TCA cycle metabolites (Extended Data Fig. 3k).
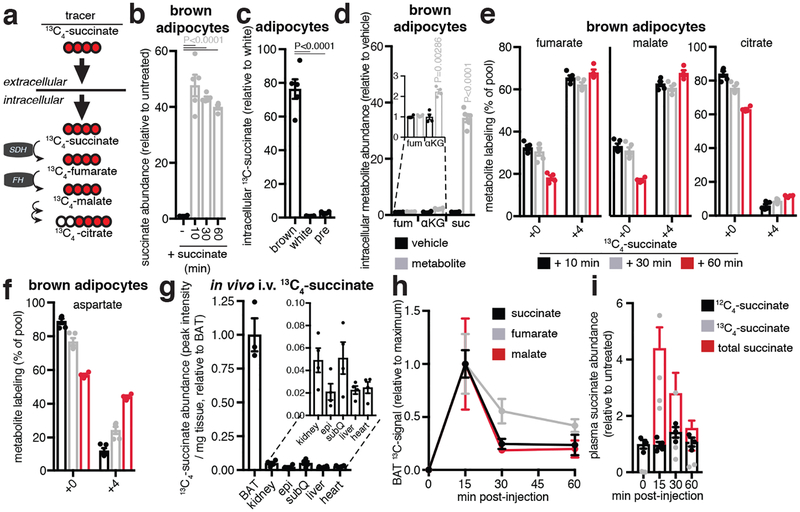
Apparent conventional operation of the TCA cycle (Extended Data Fig. 3fb–k), concomitant with the unusual selectivity of succinate accumulation upon activation of thermogenesis (Fig. 1e, f), led us to consider whether BAT may sequester succinate from the circulation (Fig. 2a). It is well established that most mammalian cell membranes are impermeable to succinate9,10. However, circulating succinate levels are substantial and dynamic, and reported extracellular concentrations range from low micromolar to millimolar11–13. Consistent with our hypothesis we found exposure of mice to 4°C led to elevation in circulating succinate (Extended Data Fig. 4a), suggesting this extracellular pool of succinate may contribute to accumulation in BAT. To test this idea, we monitored differentiated primary brown adipocytes incubated in standard medium, which lacks succinate. Under these conditions succinate concentrations were reduced compared to in vivo BAT (Extended Data Fig. 4b), while supplementation with [U-13C]-succinate led to substantial elevation of intracellular succinate levels (Fig. 2b). This capacity for succinate internalization was not observed in differentiated white adipocytes or pre-adipocytes isolated from BAT (Fig. 2c). Moreover, brown adipocytes did not display comparable capacity to internalize structurally the similar mitochondrial dicarboxylates fumarate and α-ketoglutarate (Fig. 2d).
Figure 2: Brown adipocytes can achieve selective accumulation of succinate via extracellular uptake.
a, Model for extracellularly driven succinate accumulation in brown adipocytes. b, Intracellular abundance of succinate in brown adipocytes following addition of extracellular succinate (n = 4; 10 min & 30 min n = 5). c, Abundance of intracellular (m + 4) 13C-succinate 10 min post-treatment with 13C-succinate in brown, white, and pre-adipocytes (n = 4; brown n = 5). d, Intracellular abundance of TCA cycle metabolites in brown adipocytes 10 min following extracellular addition (n = 4; succinate n = 5). e, 13C-isotopologue (m+0 and m+4) profile of metabolites downstream of mitochondrial succinate oxidation in brown adipocytes following extracellular addition of 13C-succinate (n = 5). f, Abundance of 13C-succinate in mouse tissues 15 min following 100 mg/kg i.v. 13C-succinate (n = 4; BAT n = 3). g, Abundance of (m+4) TCA cycle metabolites in BAT following 100 mg/kg i.v. 13C-succinate (n = 3). h, Abundance of (m+4) 13C-succinate and total succinate in plasma following 100 mg/kg i.v. 13C-succinate (n = 3; 15 min n = 4). b,c, one-way ANOVA; d, two-sided t-test; data are mean of biologically independent samples ± s.e.m.
Brown adipocyte succinate internalization resulted in accumulation of (m + 4) isotopologues of TCA cycle metabolites downstream of mitochondrial succinate oxidation (Fig. 2e and Extended Data Fig. 4b–f). Additionally, mitochondrial cataplerosis and accumulation of (m + 4) aspartate and (m + 2)/(m + 3) citrate (Fig. 2f and Extended Data Fig. 4e,f) was observed. Remarkably, bolus i.v. [U-13C]-succinate was also rapidly and efficiently taken up by BAT in vivo (Fig. 2g), which coincided with metabolism to downstream TCA cycle metabolites (Fig. 2h and Extended Data Fig. 4g) and clearance of [U-13C]-succinate from blood plasma (Fig. 2i and Extended Data Fig 4h). Therefore, our results indicate that brown adipocytes have the capacity to accumulate and oxidize succinate by sequestering it from the extracellular milieu.
BAT accumulates elevated circulating succinate (Fig. 2h), the levels of which increase upon exposure to 4°C (Extended Data Fig. 4a). This suggests that peripheral tissues supply succinate to BAT via the circulation upon cold exposure. Interventions that drive muscle contraction, such as exercise, are known to result in elevated circulating succinate11. Since muscle shivering is an early response to exposure to environmental cold, we hypothesized that this contractile activity could drive succinate release from muscle to supply BAT accumulation. By 30 min exposure of mice to 4°C extensive shivering was observed by electromyography (EMG) (Extended Data Fig. 4i), which could be inhibited by the nicotinic acetylcholine receptor inhibitor curare (Extended Data Fig. 4i) that significantly blunted cold-dependent accumulation of succinate in BAT (Extended Data Fig. 4j). These findings suggest that shivering muscle can be a source of succinate, although effects of curare on respiratory function may also play a role.
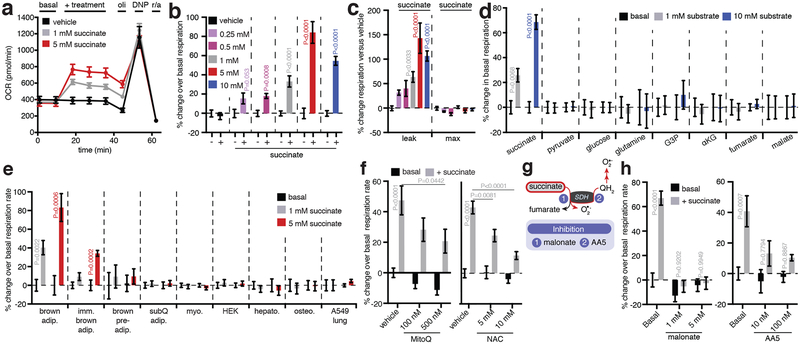
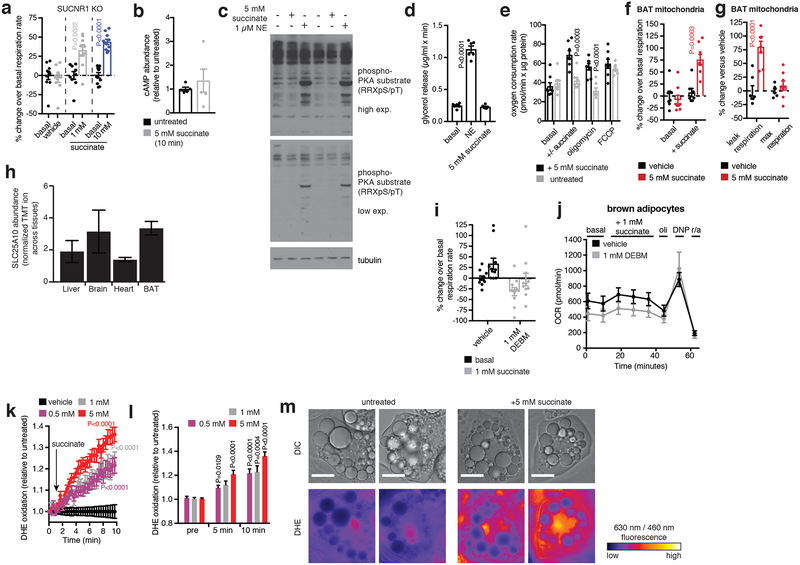
To investigate the potential role of succinate accumulation in brown adipocyte thermogenesis, we exploited the newfound capacity for these cells to rapidly internalize extracellular succinate (Fig. 2b). Remarkably, addition of succinate to brown adipocytes resulted in acute and robust concentration-dependent stimulation of respiration (Fig. 3a, b). Succinate-stimulated respiration was specifically attributable to leak respiration, which in brown adipocytes is UCP1-dependent and the component responsible for thermogenesis driven by these cells14 (Fig. 3c). Succinate utilization had no effect on chemically-induced maximal respiration, indicating that its effects were not attributable to increased mitochondrial substrate supply15 (Fig. 3c). Moreover, succinate exhibited a distinct capacity to elevate respiration compared to other respiratory substrates (Fig. 3d and Extended Data Fig. 4k,l). Through testing a comprehensive panel of cell types we found the capacity for succinate-stimulated respiration to be distinct to mature primary brown adipocytes, immortalized mouse brown adipocytes, and immortalized human brown adipocytes (Fig. 3e and Extended Data Fig. 5a–e). Notably, broad pharmacological inhibition of plasma membrane transport abrogated succinate-stimulated respiration (Extended Data Fig. 5f–i), as did inhibition of plasma membrane secondary active transport via the Na+/K+ ATPase (Extended Data Fig. 5j,k). Succinate-stimulated respiration did not require ligation of its cognate G-protein coupled receptor (SUCNR1; Extended Data Fig. 6a), elevation of cAMP levels (Extended Data Fig. 6b), activation of PKA signaling (Extended Data Fig. 6c), or elevated lipolysis (Extended Data Fig. 6d). So, succinate-dependent thermogenesis requires its transport across the plasma membrane and is independent of SUCNR1 signaling and the lipolytic cascade.
Figure 3: Succinate controls brown adipocyte thermogenesis via SDH oxidation and ROS production.
a, OCR of brown adipocytes ± acute succinate (n = 7; 1 mM succinate n = 6). b,c, Effect of addition of extracellular succinate on (b) brown adipocyte OCR, (c) leak respiration, and chemically uncoupled respiration (vehicle n = 20; 0.25 mM n = 6; 0.5 mM n = 7; 1 mM n = 18; 5 mM n = 13; 10 mM n =12). d, Effect of addition of mitochondrial and cellular substrates on brown adipocyte OCR (1 mM n = 6; 10 mM n = 7; 10 mM G3P n = 6; 10 mM αKG & fumarate n = 5). e, Effect of acute addition of succinate on cellular OCR across different cell types. (1 mM n = 6; 5 mM n = 7; 5 mM brown pre-adip. & SubQ adip. n = 5). f, Inhibition of succinate-stimulated OCR by MitoQ or NAC (MitoQ vehicle n = 15; 100 nM MitoQ n = 18; 500 nM MitoQ n = 17; NAC vehicle n = 7; 5 mM NAC n = 6; 10 mM NAC n = 7). g, Potential pathways of succinate-driven thermogenic ROS. h, Effect on succinate-stimulated OCR by inhibition of pathways linked to succinate oxidation by SDH (n = 12; 5 mM malonate n = 11; AA5 vehicle n = 11; 10 nM, 100 nM AA5 n = 6). b,d,e, two-sided t-test; c, one-way ANOVA; f,h, two-way ANOVA; data are mean of biologically independent samples ± s.e.m.
Mitochondrial succinate oxidation can drive extensive ROS formation16, which prompted us to investigate this pathway of intracellular succinate utilization. Elevation of ROS levels in brown adipocytes can support thermogenesis17, but mechanisms that control thermogenic ROS production are unknown. Supporting this line of investigation, we found the thermogenic effects of succinate were recapitulated in isolated BAT mitochondria (Extended Data Fig. 6e–g), and that BAT expresses high levels of the mitochondrial dicarboxylate carrier SLC25A10 (Extended Data Fig. 6h). SLC25A10 mediates rapid equilibration of mitochondrial and cytosolic succinate pools suggesting that internalized extracellular succinate can be accessed by brown adipocyte mitochondria. Indeed, chemical inhibition of SLC25A10 blunted succinate-driven respiration (Extended Data Fig. 6i,j).
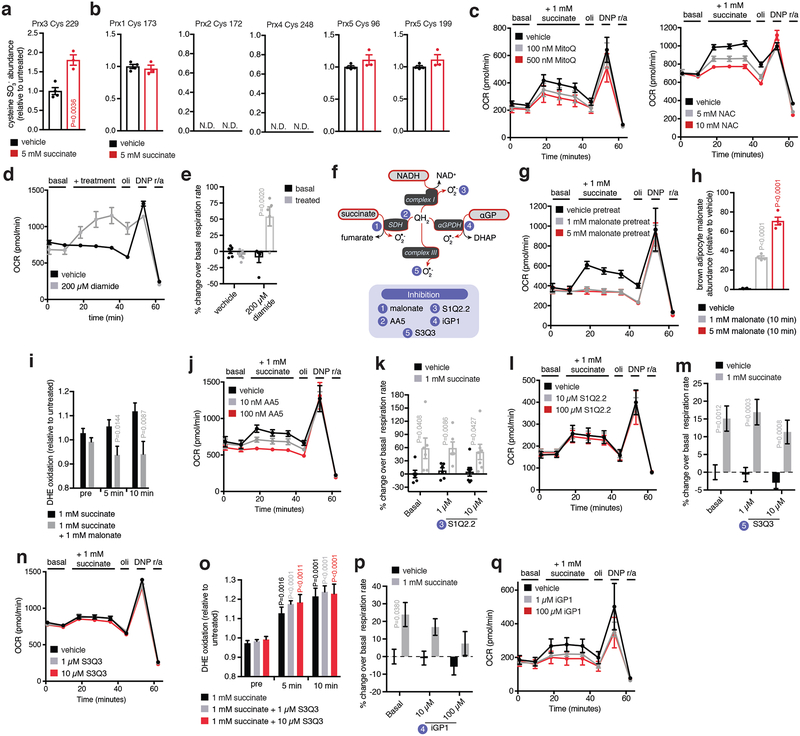
Remarkably, addition of succinate to brown adipocytes resulted in a rapid and robust increase in ROS levels (Extended Data Fig. 7k–m), indicating that it is a potent driver of ROS in these cells. Since protein cysteine residues are the principal signaling targets of thermogenic ROS17, we profiled the oxidation status of peroxiredoxin (Prx) catalytic cysteines. Prx cysteines are major targets of ROS, exhibiting hyperoxidation to sulfonic acid (SO3−) when ROS levels are elevated. Prx3, the only Prx isoform expressed exclusively in the mitochondrial matrix, uniquely exhibited elevation of cysteine thiol hyperoxidation to SO3− following succinate treatment (Extended Data Fig. 7a,b and Supplementary Data File 1). We next depleted either succinate-induced mitochondrial ROS levels using the mitochondria-targeted antioxidant MitoQ18, or inhibited ROS-dependent cysteine oxidation using N-acetyl cysteine (NAC). Suppression of either process substantially inhibited succinate-dependent respiration (Fig. 3f and Extended Data Fig. 7c). In contrast, chemical elevation of cysteine oxidation state with diamide was sufficient to drive respiration in brown adipocytes (Extended Data Fig. 7d,e).
Succinate could control ROS levels by fueling superoxide production through several electron circuits in the mitochondrial respiratory chain (Fig. 3g and Extended Data Fig. 7f). All of these pathways require succinate oxidation by the flavin site on SDH (Fig. 3g). Treatment of brown adipocytes with malonate, a competitive inhibitor of succinate oxidation by the SDH flavin (Fig. 3g and Extended Data Fig. 7f)19, abrogated both succinate-dependent ROS production and succinate-dependent respiration (Fig. 3h and Extended Data Fig. 7g–i). We next systematically manipulated the downstream superoxide producing sites linked to succinate oxidation (Extended Data Fig. 7f). Electron transfer between SDH and ubiquinone was required since inhibition at the SDH Q-site20 fully inhibited succinate-dependent respiration (Fig 3h and Extended Data Fig. 7j). Using recently developed inhibitors of ROS production through mitochondrial complex I21, complex III22, and α-glycerophosphate dehydrogenase23 (αGPDH), we did not observe substantial effects on succinate-stimulated respiration (Extended Data Fig. 7k–q),
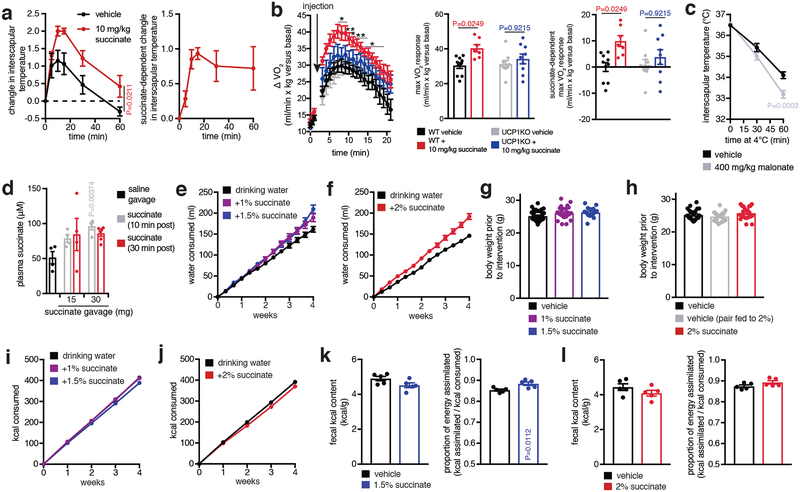
Taken together, our findings suggest a model for a novel activation pathway of adipocyte thermogenic respiration: BAT possesses the capacity to sequester elevated circulating succinate (Fig. 2), rapidly oxidizing it at SDH to drive Q pool reduction, ROS production, and thermogenesis (Fig. 3). This model predicts that acute elevation of systemic succinate should be sufficient to drive BAT thermogenesis in vivo. We found that i.v. injection of succinate resulted in a rapid increase in interscapular BAT temperature (Extended Data Fig. 8a) and whole-body oxygen consumption (Extended Data Fig. 8b). These effects peaked at the time of maximal utilization of circulating succinate by BAT (Fig. 2f). Since these experiments were performed in conscious free-moving mice there was a substantial effect of handing stress that when accounted for revealed succinate-dependent effects (Extended Data Fig. 8b)24. Importantly, in mice lacking UCP1 (UCP1KO) the thermogenic effect of succinate was largely abrogated (Extended Data Fig. 8b). Conversely, thermogenesis initiated by cold exposure was supressed by administration of the SDH inhibitor malonate (Extended Data Fig. 8c).
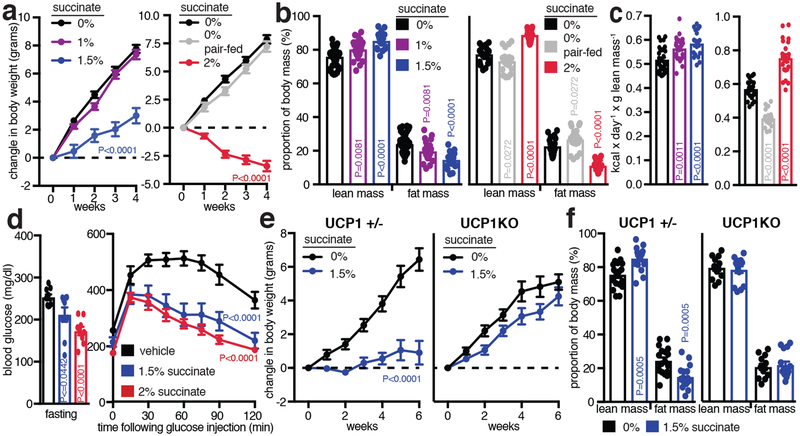
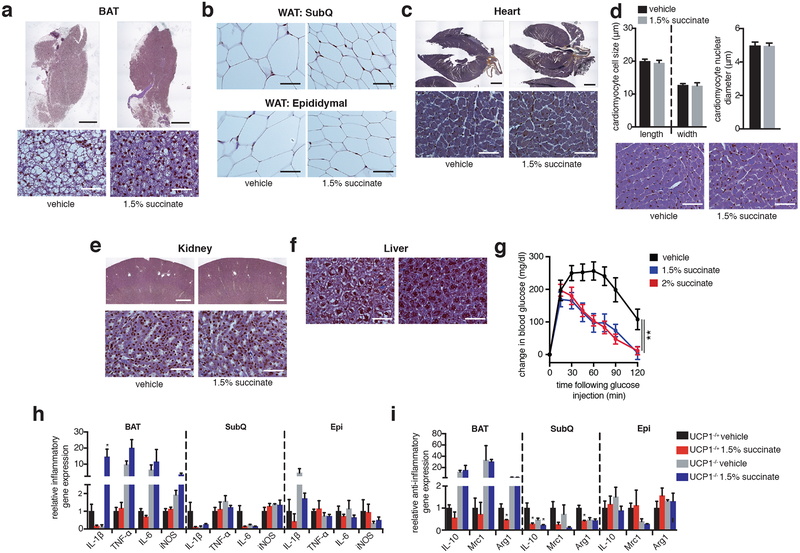
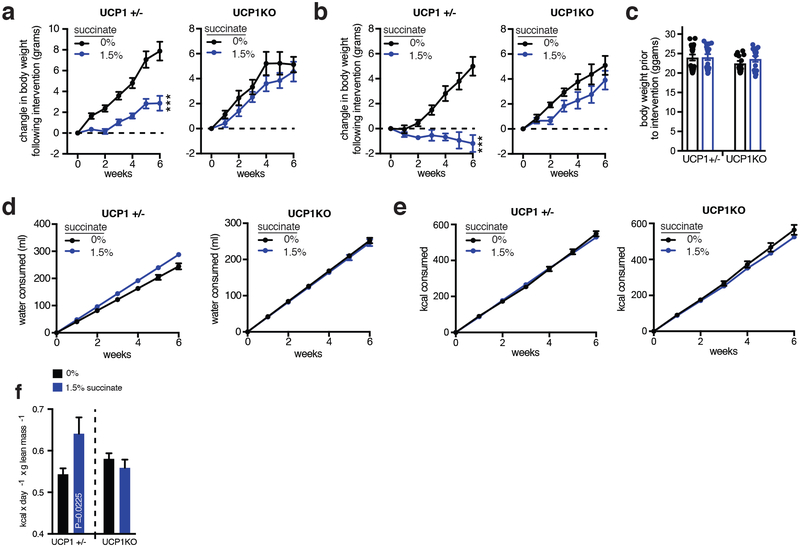
The unexpected utility of elevating circulating succinate to drive UCP1-dependent thermogenesis in vivo prompted us to investigate the role of this pathway in modulation of whole-body energy expenditure in diet-induced obesity. Dietary succinate is well tolerated at substantial concentrations25. Moreover, we confirmed that acute oral administration resulted in elevation of circulating succinate (Extended Data Fig. 8d)26. On this basis, ad libitium high-fat diet fed mice were provided drinking water supplemented with sodium succinate. No aversion to succinate was observed (Extended Data Fig. 8e, f), and mice exhibited a robust concentration-dependent suppression and reversal of weight gain induced by high-fat feeding over four weeks (Fig. 4a and Extended Data Fig. 8g, h) due to diminution of fat mass (Fig. 4b). This effect was at least partly attributable to an increase in energy expenditure based on several lines of evidence. First, succinate administration did not substantially inhibit ad libitium caloric intake (Extended Data Fig. 8i,j), while controlled pair-feeding recapitulated the metabolic phenotype observed under ad libitium conditions (Fig. 4b and Extended Data Fig. 8h). Furthermore, succinate supplementation did not inhibit caloric absorption or energy assimilation (Extended Data Fig. 8k, l). Most importantly, we applied the energy balance method27,28, which indicated that succinate supplementation drove a robust elevation in whole-body energy expenditure over the four-week period (Fig. 4c). These systemic effects of dietary succinate resulted in brown, subcutaneous, and epidydimal adipose depots exhibiting smaller adipocyte size and less lipid accumulation (Extended Data Fig. 9a). Additionally, livers of mice receiving dietary succinate exhibited less lipid deposition, while heart and kidneys were morphologically indistinguishable from controls (Extended Data Fig. 9b–f).
Figure 4: Elevation of systemic succinate stimulates UCP1-dependent thermogenesis in vivo and protects against obesity.
a, Body mass change during high-fat feeding ± sodium succinate (0% n = 35; 1% n = 26; 1.5% n = 18; 0% n = 24; 2% n = 22; pair fed n = 18). b, Body composition of mice following 4 weeks high-fat feeding ± low (n = 35; 1% n = 26; 1.5% n = 18) and high succinate (n = 24; 2% n = 22; pair fed n = 18). c, Mouse whole-body energy expenditure during 4 weeks high-fat feeding ± low (n = 35; 1% n = 26; 1.5% n = 18) and high succinate (n = 24; 2% n = 22; pair fed n = 18). d, Blood glucose parameters following 4 weeks high-fat feeding ± succinate (n = 9). e,f Change in (e) body mass and (f) body composition during high-fat feeding in UCP1+/− and UCP1KO mice ± 1.5% sodium succinate (n = 18; UCP1+/− 1.5% n = 17; UCP1KO n = 13; UCP1KO 1.5% n = 15; two-tailed pairwise). a,d(right),e, two-way ANOVA; b,c,d(left) one-way ANOVA; f, two-sided t-test; data are mean of biologically independent samples ± s.e.m.
Succinate supplementation also lowered fasting circulating glucose levels (Fig. 4d) and protected against glucose intolerance induced by high-fat feeding (Fig. 4d and Extended Data Fig. 9g). Moreover, there was no evidence of elevated inflammatory or anti-inflammatory markers in adipose tissues; and in some cases, such as interleukin-1β, a decrease (Extended Data Fig. 9h, i). These findings are remarkable since in certain physiological settings, circulating succinate can engage immune cell recruitment and activation29,30. The lack of immunogenic signaling by succinate here can be explained by the fact that thermogenic adipose tissue acts as a sink for succinate (Fig. 2g), rapidly clearing circulating succinate (Fig. 2h,i) which would be predicted to antagonize immunogenic signaling29,30. This interpretation is supported by the observation that dietary succinate potentiated inflammatory signaling only in adipose depots of UCP1KO mice (Extended Data Fig. 9h), suggesting that competent thermogenic adipose tissue antagonizes inflammatory signaling by succinate in a dominant fashion. Finally, to determine whether the robust weight loss and energy expenditure effects of dietary succinate required adipose tissue thermogenesis, we examined the physiological effect of succinate supplementation in UCP1KO mice. Strikingly, we found that the inhibitory effects on weight gain (Fig. 4fe,f and Extended Data Fig 10a–e) and stimulatory effects on energy expenditure (Extended Data Fig. 10f) were lost in UCP1KO mice.
Taken together, we have identified an unexpected mechanism for activation of BAT thermogenesis through utilization of a systemic pool of the TCA cycle intermediate succinate. Succinate exerts acute control over UCP1-dependent thermogenesis by triggering mitochondrial ROS production via SDH oxidation, and is systemically integrated by the newfound capacity for brown adipocytes to sequester it from the circulation. So, besides identification of a novel molecular pathway for activation of adipocyte heat production, these data demonstrate that succinate acts as a previously unappreciated systemic redox signal, exerting profound effects on whole body metabolism.
Methods
Animal procedures and ethics statement.
Animal experiments were performed according to procedures approved by the Institutional Animal Care and Use Committee of the Beth Israel Deaconess Medical Center. Unless otherwise stated, mice used were male C57BL/6J (8–12 weeks of age; Jackson Laboratories), and housed in a temperature-controlled (23 °C) room on a 12 h light/dark cycle. Both male and female UCP1-KO (B6.129-Ucp1tm1Kz/J) and littermate matched heterozygotes were used.
Body temperature and cold exposure.
Interscapular body temperature was assessed using implantable electronic ID transponders (Bio Medic Data Systems, Inc). When studying acute activation of thermogenesis, mice were housed from birth at 23°C to allow for recruitment of thermogenic adipose tissue32. Before individual housing at 4 °C or any experiments involving acute activation of thermogenesis, mice were placed at thermoneutrality (29 °C) for 1 day which allows both for maintenance BAT UCP1 protein content33 and for measurement of induction of BAT thermogenesis by acute intervention.
Metabolite analyses by MS.
Metabolites were profiled using an LC-MS system comprised of a Nexera X2 U-HPLC (Shimadzu Scientific Instruments; Marlborough, MA) coupled to a Q Exactive Plus orbitrap mass spectrometer (Thermo Fisher Scientific; Waltham, MA). Tissues were rapidly isolated and homogenized in extraction solution of 80% methanol containing inosine-15N4, thymine-d4 and glycocholate-d4 internal standards (Cambridge Isotope Laboratories; Andover, MA) at a 4:1 volume to wet weight ratio. The samples were centrifuged (10 min, 9,000 × g, 4°C) and the supernatants were injected directly onto a 150 × 2.0 mm Luna NH2 column (Phenomenex; Torrance, CA). For analysis of TCA cycle metabolites in BAT, an additional 100x dilution was performed in extraction solution to render succinate abundance within the linear quantification range of the instrument, as described in Extended Data Fig. 1. The column was eluted at a flow rate of 400 μL/min with initial conditions of 10% mobile phase A (20 mM ammonium acetate and 20 mM ammonium hydroxide in water) and 90% mobile phase B (10 mM ammonium hydroxide in 75:25 v/v acetonitrile/methanol) followed by a 10 min linear gradient to 100% mobile phase A. MS analyses were carried out using electrospray ionization in the negative ion mode using full scan analysis over m/z 70–750 at 70,000 resolution and 3 Hz data acquisition rate. Additional MS settings were: ion spray voltage, −3.0 kV; capillary temperature, 350°C; probe heater temperature, 325 °C; sheath gas, 55; auxiliary gas, 10; and S-lens RF level 50. Raw data were processed using Progenesis QI software version 1.0 (NonLinear Dynamics) for feature alignment, nontargeted signal detection, and signal integration. Targeted processing of a subset of known metabolites and isotopologues was conducted using TraceFinder software version 4.1 (Thermo Fisher Scientific; Waltham, MA). Compound identities were confirmed using reference standards. Succinate was quantified using a targeted LC-MS method operated on a ACQUITY UPLC (Waters Corp.; Milford, MA) coupled to a 5500 QTRAP mass spectrometer (SCIEX; Framingham, MA) as described previously14,34. For succinate analysis of mouse serum for shivering and curare experiments samples were analyzed using reverse phase ion-pairing chromatography coupled to tandem mass spectrometry (Agilent LC-MS). Analytes were eluted in buffer A (97% H2O, 3% MeOH, 10 mM Tributylamine, 15 mM Glacial Acetic Acid, pH 5.5) and buffer B (10 mM Tributylamine, 15 mM Glacial Acetic Acid in 100% MeOH). Samples were run on a ZORBAX Extend-C18, 2.1 × 150 mm, 1.8 μm (Agilent) with a flow rate of 0.25 mL/min for 2.5 minutes of buffer A, followed by a linear gradient (100% buffer A to 80% buffer A) for 5 minutes, followed by a linear gradient (80% buffer A to 55% buffer A) for 5.5 minutes, followed by a linear gradient (55% buffer A to 1% buffer A) for 7 minutes, followed by 4 minutes with (1% buffer A). Samples were ionized using Agilent Jet Spray ionization; nebulizer 45 psi, capillary −2000 V, nozzle voltage: 500 V, sheath gas temperature 325 °C, and sheath gas flow 12 L/min. An Agilent 6470 Triple Quadrupole mass spectrometer was used for mass detection with a targeted method. Peaks were integrated in Mass Hunter (Agilent).
13-Carbon metabolite tracing.
[U-13C]-glucose (2.4 g/kg), [U-13C]-palmitate (80 mg/kg) or [U-13C]-succinate (100 mg/kg) (all from Cambridge Isotope Laboratories) were administered by tail vein injection and mice were individually housed at 4 °C or 29 °C for the indicated times prior to tissue harvest. [U-13C]-palmitate was conjugated to 1% BSA prior to injection. All injections were performed as a bolus over 20 seconds. For in vitro studies [U-13C]-succinate was added to BAT cells for the indicated times at a final concentration of 5 mM. Cells were washed and lysed directly in metabolite extraction buffer, snap frozen in liquid nitrogen and stored at −80°C until MS analysis was performed.
Primary brown adipocyte preparation and differentiation.
Interscapular brown adipose stromal vascular fraction was obtained from 2- to 6-day-old pups as described previously35. Interscapular brown adipose was dissected, washed in PBS, minced, and digested for 45 min at 37 °C in PBS containing 1.5 mg ml−1 collagenase B, 123 mM NaCl, 5 mM KCl, 1.3 mM CaCl2, 5 mM glucose, 100 mM HEPES, and 4% essentially fatty-acid-free BSA. Tissue suspension was filtered through a 40 μm cell strainer and centrifuged at 600g for 5 min to pellet the SVF. The cell pellet was resuspended in adipocyte culture medium and plated. Cells were maintained at 37°C in 10% CO2. Primary brown pre-adipocytes were counted and plated in the evening, 12 h before differentiation at 15,000 cells per well of a seahorse plate. Pre-adipocyte plating was scaled according to surface area. The following morning, brown pre-adipocytes were induced to differentiate for 2 days with an adipogenic cocktail (1 μM rosiglitazone, 0.5 mM IBMX, 5 μM dexamethasone, 0.114 μg ml−1 insulin, 1 nM T3, and 125 μM indomethacin) in adipocyte culture medium. Two days after induction, cells were re-fed every 48 h with adipocyte culture medium containing 1 μM rosiglitazone, 1 nM T3, and 0.5 μg ml−1 insulin. Cells were fully differentiated by day 7 after induction.
Primary white adipocyte preparation and differentiation.
Inguinal white adipose stromal vascular fraction was obtained from 2- to 6-day-old pups as described previously36. Adipose tissue was dissected, washed in PBS, minced, and digested for 45 min at 37°C in HBSS containing collagenase D (10 mg/ml), dispase II (3 U/ml) and CaCl2 (10 mM). Tissue suspension was filtered through a 40 cell strainer and centrifuged at 600g for 5 min to pellet the SVF. The cell pellet was resuspended in adipocyte culture medium supplemented with 10% foetal bovine serum (FBS) and 1% penicillin/streptomycin (P/S) and plated. Cells were maintained at 37°C in 10% CO2. Primary white pre-adipocytes were counted and plated in the evening, 12 h before differentiation at 15,000 cells per well of a seahorse plate. Preadipocyte plating was scaled according to surface area. The following morning, white pre-adipocytes were induced to differentiate for 2 days with an adipogenic cocktail (rosiglitazone (1 μM), IBMX (0.5 mM), dexamethasone (1 μM), insulin (5 μg/ml)) in adipocyte culture medium. Two days after induction, cells were re-fed every 48 h with adipocyte culture medium containing rosiglitazone (1 μM) and insulin (5 μg/ml). Cells were fully differentiated by day 6 after induction.
Immortalized human brown pre-adipocyte line differentiation.
Immortalized human brown preadipocytes37 were cultured with animal component-free medium (Stem Cell Technologies; #05449). Brown adipocyte differentiation was induced by treating confluent preadipocytes with animal component-free adipogenic differentiation medium (Stem Cell Technologies; #05412) supplemented with T3 (1 nM) and rosiglitazone (0.5 μM). Cells were fully differentiated 2 weeks after induction.
Maintenance of cell lines.
All cell lines were grown in DMEM supplemented with 10% FBS and 1% P/S. Cells were detached using 0.05% trypsin and subcultured every other day.
Cellular respirometry of primary adipocytes.
Cellular OCR of primary brown or white adipocytes was determined using a Seahorse XF24 Extracellular Flux Analyzer. Adipocytes were plated and differentiated in XF24 V7 cell culture microplates. Prior to analysis adipocyte culture medium was changed to respiration medium consisting of DMEM lacking NaHCO3 (Sigma), NaCl (1.85 g/L), phenol red (3 mg/L), 2% fatty acid free BSA, and sodium pyruvate (1 mM), pH 7.4. In all cases, basal respiration was determined to be the OCR in the presence of substrate (1 mM sodium pyruvate) alone. Respiration uncoupled from ATP synthesis was determined following addition of oligomycin (4.16 μM). Maximal respiration was determined following addition of DNP (2 mM). Rotenone (3 μM) and antimycin (3 μM) were used to abolish mitochondrial respiration. Leak respiration was calculated as OCR following rotenone/antimycin treatment subtracted from OCR following oligomycin treatment.
Cellular respirometry of cell lines.
Cellular OCR of cells lines was determined using a Seahorse XF24 Extracellular Flux Analyzer as described above with a few minor changes. All cell lines, except DE cells and immortalized human brown adipocytes, were plated at a density of 50,000 cells/well and a final concentration of 0.2% fatty acid free BSA was used. De2.3 cells and immortalized human brown adipocytes were plated at 5,000 cells/well and 30,000 cells/well, respectively, and a final concentration of 2% fatty acid free BSA was used. Respiration uncoupled from ATP synthesis was determined following addition of oligomycin (1.25 μM). Rotenone (3 μM) and antimycin (3 μM) were used to abolish mitochondrial respiration.
Imaging of brown adipocytes.
ROS production was estimated by oxidation of DHE and ratiometric assessment. Cells were grown on 35 mm glass bottom No. 1.5 coverslips (MatTek). 10 mins prior to imaging cells were loaded with dihydroethidium (DHE, 5 μM, Sigma) in imaging buffer (NaCl, 156 mM; KCl, 3 mM; MgCl2 2 mM; KH2PO4, 1.25 mM; HEPES, 10 mM; sodium pyruvate, 1 mM). Cell culture dishes were mounted in a Tokai Hit INU microscope stage top incubator (37°C and 5% CO2). Oxidised DHE was excited at 500 nm and the emitted signal was acquired at 632 nm. Reduced DHE was excited at 380 nm and the emitted signal was acquired at 460 nm. A time-lapse was performed in which cells were imaged every 20 s using an exposure time of 30 ms, 4×4 camera binning and the ND4 filter in. Four images were acquired prior to acute treatment with compounds of interest and imaged for 10 min. For experiments including inhibitors of succinate-dependent ROS induction these compounds were added in the initial 10 min incubation prior to imaging. All images were collected with an Inverted Nikon Ti fluorescence microscope equipped with 10x SF objective lens using MetaMorph 7.2 acquisition software and the Perfect Focus System for maintenance of focus over time. All measured cell parameters were analysed with Fiji image processing software. Briefly, 5 cells were selected from each image acquired with 10x objective, background removal was performed and a ratio of oxidized DHE over reduced DHE was calculated. For high resolution images a 40X SF objective lens with a layer of mineral oil on top of the media was used and cells were imaged at one time-point, 10 mins posttreatment. Images were processed using the Fiji ratio plus plugin with background correction for each channels and multiplication factors set to 1. The fluorescence images are displayed using the same setting and were pseudocolored using the fire LUT. The transmitted light images are displayed using the autoscale LUT gray scale.
Assessment of protein thiol sulfonic acids.
Samples were homogenized in 50 mM Tris base, containing 100 mM NaCl, 100 μM DTPA, 0.1% SDS, 0.5% sodium deoxycholate, 0.5% Triton-X 100, 10 mM TCEP and 50 mM iodoacetamide. Following incubation for 15 min, SDS was added to a final concentration of 1% and samples were incubated for a further 15 min.
Protein digestion.
Protein pellets were dried and resuspended in 8 M urea containing 50 mM HEPES (pH 8.5). Protein concentrations were measured by BCA assay (Thermo Scientific) before protease digestion. Protein lysates were diluted to 4 M urea and digested with LysC (Wako, Japan) in a 1/100 enzyme/protein ratio overnight. Protein extracts were diluted further to a 1.0 M urea concentration, and trypsin (Promega) was added to a final 1/200 enzyme/protein ratio for 6 h at 37 °C. Digests were acidified with 20 μl of 20% formic acid (FA) to a pH ~2, and subjected to C18 solid-phase extraction (50 mg Sep-Pak, Waters).
LC–MS/MS parameters for targeted Prx cysteine peptide analysis.
All spectra were acquired using an Orbitrap Fusion mass spectrometer (Thermo Fisher) in line with an Easy-nLC 1000 (Thermo Fisher Scientific) ultra-high pressure liquid chromatography pump. Peptides were separated onto a 100 μM inner diameter column containing 1 cm of Magic C4 resin (5μm,100Å, MichromBioresources) followed by 30cm of SepaxTechnologies GP-C18 resin (1.8 μm, 120 Å) with a gradient consisting of 9–30% (ACN, 0.125% FA) over 180 min at ~250 nl min−1. For all LC–MS/MS experiments, the mass spectrometer was operated in the data-dependent mode. We collected MS1 spectra at a resolution of 120,000, with an AGC target of 150,000 and a maximum injection time of 100 ms. The ten most intense ions were selected for MS2 (excluding 1 Z-ions). MS1 precursor ions were excluded using a dynamic window (75 s ± 10 ppm). The MS2 precursors were isolated with a quadrupole mass filter set to a width of 0.5 Th. For the MS3 based TMT quantitation, MS2 spectra were collected at an AGC of 4,000, maximum injection time of 200 ms, and CID collision energy of 35%. MS3 spectra were acquired with the same Orbitrap parameters as the MS2 method except HCD collision energy was increased to 55%. Synchronous- precursor-selection was enabled to include up to six MS2 fragment ions for the MS3 spectrum.
Data processing and MS2 spectra assignment.
A compilation of in-house software was used to convert.raw files to mzXML format, as well as to adjust monoisotopic m/z measurements and erroneous peptide charge state assignments. Assignment of MS2 spectra was performed using the SEQUEST algorithm38. All experiments used the Mouse UniProt database (downloaded 10 April 2014) where reversed protein sequences and known contaminants such as human keratins were appended. SEQUEST searches were performed using a 20 ppm precursor ion tolerance, while requiring each peptide’s amino/carboxy (N/C) terminus to have trypsin protease specificity and allowing up to two missed cleavages. For targeted assessment of Prx cysteine thiol sulfonic acids, TMT tags on lysine residues and peptide N termini (+229.16293 Da), iodoacetamide on cysteine residues (+57.0214637 Da) were set as static modifications and oxidation of methionine residues (+15.99492 Da) and sulfonic acid formation on cysteine residues (+9.036719 Da versus iodoacetamide) as variable modifications. Determination of sulfonic acid formation of the Prx peptides was determined by comparing TMT reporter ion abundance of sulfonic acid containing peptides normalized to the unmodified (iodoacetamide-labelled) forms. An MS2 spectra assignment false discovery rate of less than 1% was achieved by applying the target-decoy database search strategy39. Protein filtering was performed using an in-house linear discrimination analysis algorithm to create one combined filter parameter from the following peptide ion and MS2 spectra metrics: XCorr, ACn score, peptide ion mass accuracy, peptide length and missed-cleavages40. Linear discrimination scores were used to assign probabilities to each MS2 spectrum for being assigned correctly, and these probabilities were further used to filter the data set to a 1% protein-level false discovery rate.
Western Blotting.
Samples were isolated in 50 mM Tris, pH 7.4, 500 mM NaCl, 1% NP40, 20% glycerol, 5 mM EDTA and 1 mM phenylmethylsulphonyl fluoride, supplemented with a cocktail of protease inhibitors (Roche). Homogenates were centrifuged at 16,000 g × 10 min at 4°C, and the supernatants were used for subsequent analyses. Protein concentration was determined using the bicinchoninic acid assay (Pierce). Protein lysates were denatured in Laemmli buffer (60 mM Tris, pH 6.8, 2% SDS, 10% glycerol, 0.05% bromophenol blue, 100 mM DTT), resolved by 4%–12% NuPAGE Bis-Tris SDS–PAGE (Invitrogen) and transferred to a polyvinylidene difluoride (PVDF) membrane. Primary antibodies (pPKA substrate (CST 9624 s); Tubulin (Abcam AB44928)) were diluted in TBS containing 0.05% Tween (TBS-T), 5% BSA and 0.02% NaN340. Membranes were incubated overnight with primary antibodies at 4°C. For secondary antibody incubation, anti-rabbit HRP (Promega) was diluted in TBS-T containing 5% milk. Results were visualized with enhanced chemiluminescence (ECL) western blotting substrates (Pierce).
Glycerol release.
Adipocytes were incubated in respiration medium and treated as indicated before collection of medium and quantification of glycerol using free glycerol reagent (Sigma-Aldrich) relative to glycerol standard.
Metabolic phenotyping.
Whole-body energy metabolism was evaluated using a Comprehensive Lab Animal Monitoring System (CLAMS, Columbia Instruments). Mice were acclimated in the metabolic chambers and acclimated with mock injection procedures to minimize contribution of stress to the metabolic phenotype. O2 levels were collected every 60 s. Basal O2 consumption rate was determined to be the average of the lowest three consecutive readings determined prior to intervention. Maximum O2 consumption rate was determined as the average of three highest rates recorded post-intervention.
Determination of free living whole body total energy expenditure.
Whole body energy expenditure in mice was determined using the energy balance method, otherwise known as the law of energy conservation, which accounts for caloric intake, change in body weight, and change in lean and fat mass throughout dietary intervention, as described previously27,28,41. Briefly, individual mouse body weight and body composition were determined prior to dietary intervention ± sodium succinate. Throughout the four-week intervention period, mouse kcal intake was measured, as well as changes in body weight and body composition (fat mass and fat-free mass). kcal intake was determined on the basis of the energy density of high-fat diet (5.24 kcal/gram) and the energy density of ingested succinate (2.99 kcal/gram). Energy density of accumulated fat mass in mice was 9.4 kcal/gram and fat-free mass was 1.8 kcal/gram41. Based on bomb calorimetry of feces during the experiment, which found no differences in kcal absorption between interventions, we confirmed that the calculated metabolizable energy intake based on kcal intake measurements adequately accounted for any differences due to digestion.
High-fat feeding.
All mouse high-fat feeding experiments were performed with age-matched littermate controls. At eight weeks of age, mice were switched to high fat-diet (OpenSource Diets, D12492) with 60% kcal from fat, 20% kcal from carbohydrate, and 20% kcal from protein. Following initiation of high-fat feeding, mice provided with succinate in drinking water had it supplemented to the indicated level using sodium succinate. Succinate-containing drinking water was freshly prepared and replaced every two days.
Body composition analysis.
Body composition was examined with Echo MRI (Echo Medical Systems, Houston, Texas) using the 3-in-1 Echo MRI Composition Analyzer.
GTT.
Mice were fasted for 6 Hrs. Glucose (1 g/kg) was administered i.p., and blood glucose levels were measured at 0, 15, 30, 45, 60, 75, 90 and 120 minutes using a glucometer.
Bomb calorimetry of feces.
Calorimetry was conducted using a Parr 6725EA Semimicro Calorimeter and 1107 Oxygen Bomb. During dietary intervention, fecal specimens from mice were collected over a 48 h period. Collected samples and baked at 60°C for 48 h to remove water content. Fecal samples were combusted and the energy content of the fecal matter was measured as heat of combustion (kcal/g).
Assessment of respiration in isolated mitochondria.
BAT mitochondria were isolated as described previously36. Using freshly isolated mitochondria basal respiration was measured in the presence of 10 mM pyruvate and 10 mM malate in the presence of 3 mM GDP in 50 mM KCl, 10 mM TES, 1mM EGTA medium containing 0.4% (w/v) fatty acid-free bovine serum albumin, 1 mM KH2PO4, 2 mM MgCl2 and 0.46 mM CaCl2. OCR was monitored in a Seahorse XF24 instrument at 2.5 μg mitochondrial protein per well. Succinate was added acutely at 5 mM following determination of basal respiration, leak was determined using 1 μg ml-1 oligomycin. 0.1 mM DNP was applied to determine chemically uncoupled respiration.
Histological analysis.
Tissues were extracted and placed in tissue clamps in 10% neutral buffer formalin (NBF) overnight. The following day samples were rinsed twice in PBS and stored in 70% ethanol. Tissue fragments were embedded in paraffin, sectioned and mounted on glass slides. For histological and morphometric studies, the sections were stained with hematoxylin and eosin or Masson’s trichrome. Digital images were collected with a Nikon Ti2 motorized inverted microscope equipped with a 4x or 40x objective lens. Images were acquired with a Nikon DS-Fi1 color camera controlled with NIS-Elements image acquisition software. The quantitative analysis of cardiomyocyte cross-sectional height and width and nuclear diameter were measured using Fiji image processing software.
Gene expression analysis.
Total RNA was extracted from frozen tissue using TRIzol (Invitrogen), purified with a PureLink RNA Mini Kit (Invitrogen) and quantified using a Nanodrop 2000 UV-visible spectrophotometer. cDNA was prepared using 1 μg total RNA by a reverse transcription-polymerase chain reaction (RT-PCR) using a high capacity cDNA reverse transcription kit (Applied Biosystems), according to the manufacturer’s instructions. Real-time quantitative PCR (qPCR) was performed on cDNA using SYBR Green probes. qPCR was performed on a 7900 HT Fast Real-Time PCR System (Applied Biosystems) using GoTaq qPCR Master Mix (Promega). Reactions were performed in a 384-well format using an ABI PRISM 7900HT real time PCR system (Applied Biosystems). For SYBR primer pair sequences see Supplementary Methods. Fold changes in expression were calculated by the Delta Delta Ct method using mouse cyclophilin A as an endogenous control for mRNA expression. All fold changes are expressed normalized to the vehicle control. SYBR primer pair sequences were as follows: Il1b, FW 5’-TGGCAACTGTTCCTG-3’, RV 5’-GGAAGCAGCCCTTCATCTTT-3’; Il10, FW 5’-AGGCGCTGTCATCG-ATTT-3’, RV 5’-CACCTTGGTCTTGGAGCTTAT-3’; Tnfa, FW 5’-GCCTCTTCT-CATTCCTGCTT-3’, RV 5’-TGGGAACTTCTCATCCCTTTG-3’; Arg1, FW 5’-GATTATCGGAGCGCCTTTCT-3’, RV 5’-TGGTCTCTCACGTCATACTCT-3’, Nos2, FW 5’-CCAAGCCCTCACCTACTTCC-3’, RV 5’- CTCTGAGGGCTGACACAAGG-3’, Il6, FW 5’-ACAAAGCCAGAGTCCTTCAGAGAG-3’, RV 5’- TTGGATGGTCTTGGTCCTTAGCCA-3’, Mrc1, FW 5- GGCGAGCATCAAGAGTAAAGA-3’, RV 5’-CATAGGTCAGTCCCAACCAAA-3’, Cyclophilin, FW 5’-GGAGATGGCACAGGAGGAA-3’, RV 5’- GCCCGTAGTGCTTCAGCTT-3’.
Statistical analyses.
Data were expressed as mean ± s.e.m. and P values were calculated using two-tailed Student’s t-test for pairwise comparison of variables, one-way ANOVA for multiple comparison of variables, and two-way ANOVA for multiple comparisons involving two independent variables. Sample sizes were determined on the basis of previous experiments using similar methodologies. For all experiments, all stated replicates are biological replicates. For in vivo studies, mice were randomly assigned to treatment groups. For MS analyses, samples were processed in random order and experimenters were blinded to experimental conditions.
Extended Data
Extended Data Figure 1: Quality control for MS analysis of succinate in thermogenic adipose tissue.
a, Because of its unusual abundance in BAT, special consideration is required to determine the linearity of the relationship between LC–MS succinate peak intensity and succinate concentration for quantitative analysis. Succinate abundance is measured in extraction solution as described in the methods section. Absolute determination of succinate concentration is compared between succinate extracted from BAT (red) and the same samples following 100-fold dilution (green). Samples are analyzed in parallel with defined amounts of 13C-succinate (black) used at concentrations that are within the established linear range of the mass spectrometer. Following 100-fold dilution of BAT extracts, succinate signals are within the linear range of detection. However, undiluted extracts are at concentrations that result in a non-linear relationship and are therefore not appropriate for quantitative analysis. b, Calculation of the apparent dilution factor reveals the effect of non-linearity with apparent dilutions ranging from ~11–28-fold that are in fact 100-fold.
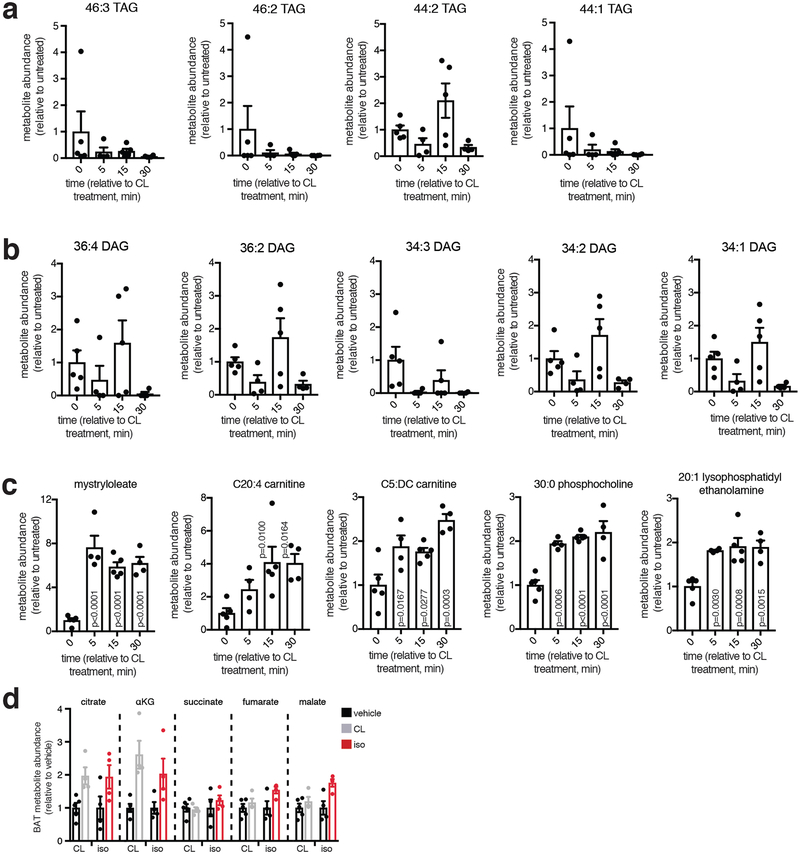
Extended Data Figure 2: Metabolite analysis of the acute response of BAT to β3-adrenergic stimulus in vivo by CL.
a, Rapid depletion of BAT triacylglycerol (TAG) species following i.v. injection of 1 mg/kg CL. b, Depletion of BAT diacylglycerol (DAG) species following i.v. injection of CL. c, Accumulation of free fatty acid species and acyl-carnitine species in BAT following i.v. injection of CL. d, Abundance of TCA cycle metabolites in BAT following i.v. β-adrenoreceptor agonism with 1 mg/kg isoproterenol or 1 mg/kg CL (n = 5; CL, iso n = 4). c, one-way ANOVA; d, two-sided t-test; data are mean of biologically independent samples ± s.e.m.
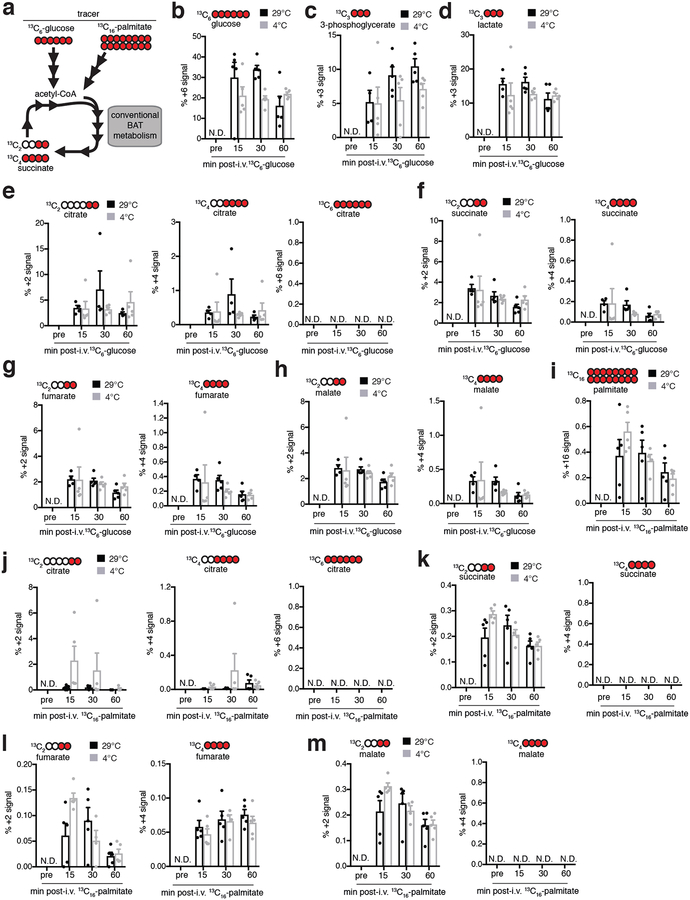
Extended Data Figure 3: 13C isotopologue labelling of glucose and TCA cycle metabolites in mouse BAT following i.v. 13C-glucose at 29°C or 4°C.
a, Potential inputs to succinate-directed flux by conventional BAT metabolism and 13C-metabolite labelling strategy. Mice were administered (b-h) [U-13C]-glucose or (i-m) [U-13C]-palmitic acid i.v. as a bolus at 29°C or 4°C followed by BAT harvesting and snap freezing for LC-MS analysis at indicated time-points. b, Proportional isotopic labelling of BAT glucose. c,d, Proportional isotopic labelling profile of glycolytic metabolites (c) 3-phosphoglycerate and (d) lactate in mouse BAT. e-h, Proportional isotopic labelling profile of TCA cycle metabolites (e) citrate, (f) succinate, (g) fumarate, and (h) malate in mouse BAT. i, Proportional isotopic labelling of BAT palmitate. h-k, Proportional isotopic labelling profile of TCA cycle metabolites (j) citrate, (k) succinate, (l) fumarate, and (m) malate in BAT. (n = 5). Missing values or N.D. indicate value not determined. Data are mean of biologically independent samples ± s.e.m.
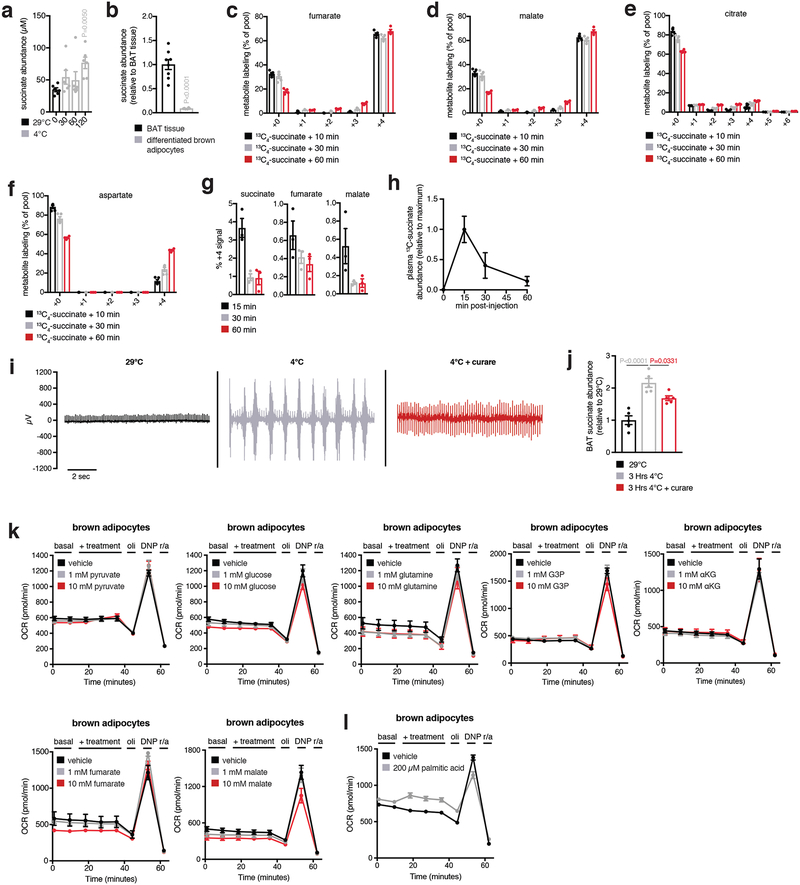
Extended Data Figure 4: Analysis of succinate levels in isolated BAT cells and effect of muscle shivering on BAT succinate accumulation.
a, Abundance of succinate in mouse plasma comparing 29°C to acute 4°C exposure (n = 6). b, Comparison of succinate abundance in BAT in vivo versus brown adipocytes (n = 8; brown adipocytes n = 7). c-f, Full 13C-isotopologue profile of (b) fumarate, (c) malate, (d) citrate, and (e) aspartate in brown adipocytes following extracellular addition of 13C-succinate (n = 5). g, 13C-isotopologue (m + 4) profile of TCA metabolites downstream of mitochondrial succinate oxidation in BAT following i.v. administration of 100 mg/kg 13C-succinate as a bolus (n = 3). h, Timecourse of abundance of (n) (m + 4) 13C-succinate in plasma following 100 mg/kg i.v. 13C-succinate (n = 3; 15 min n = 4). i, Representative mouse nuchal muscle EMG traces at 29°C and after acute cold exposure ± curare (0.1 mg kg−1). j, Determination of BAT succinate abundance at 29°C and after acute cold exposure ± inhibition of muscle shivering with curare (0.1 mg kg−1; n = 5). k, Effect of acute addition of cellular and mitochondrial respiratory substrates on brown adipocyte respiration (pyruvate n = 7; 1 mM n = 6; 10 mM n = 7; glucose n = 7; 1 mM n = 6; 10 mM n = 7; glutamine n = 6; 1 mM n = 6; 10 mM n = 7; G3P vehicle n = 7; 1 mM n = 6; 10 mM n = 6; αKG n = 6; 10 mM n = 5; fumarate n = 6; 10 mM n = 5; malate n = 6; 10 mM n = 7). l, Effect of acute addition of palmitic acid on brown adipocyte respiration (n = 18; palmitic acid n = 16). Effects on respiration were determined by acute addition, ± oligomycin (oli) to determine leak respiration, ± 2,4-dinitrophenol (DNP) to determine chemically uncoupled maximal respiration, and rotenone + antimycin (r/a) to determine non-mitochondrial respiration. In all cases basal respiration in these cells is in the presence of 1 mM pyruvate. a,j one-way ANOVA; data are mean of biologically independent samples ± s.e.m.
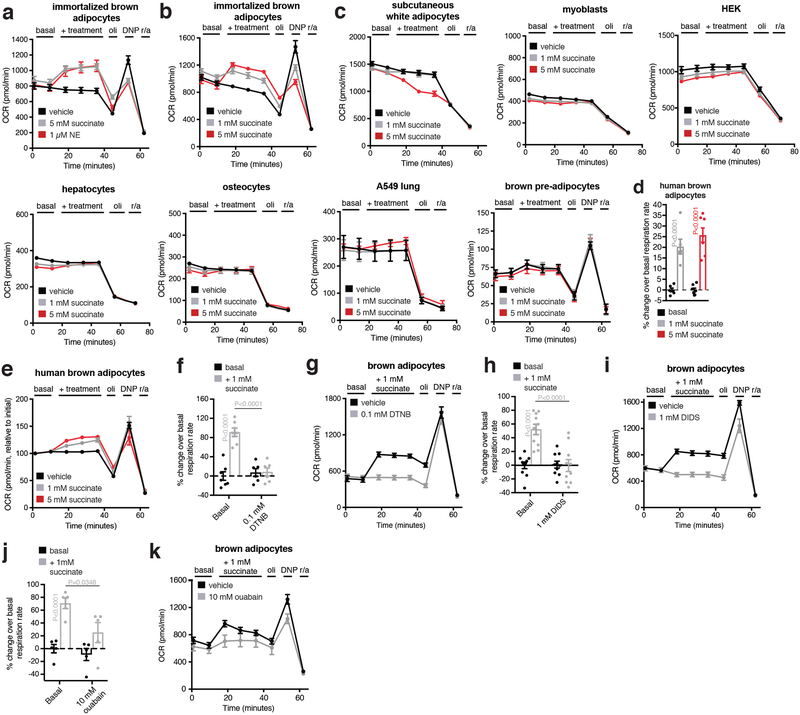
Extended Data Figure 5: Representative OCR experiments of brown adipocytes and other cell types ± acute addition succinate and related substrates.
a, Representative OCR trace monitoring effect of acute addition of succinate or noradrenaline in the De2.3 immortalized brown adipocyte cell line31 (NE; vehicle n = 7; succinate n = 6; NE n = 7). b, Representative OCR trace monitoring dose-dependent effect of acute addition of succinate in the De2.3 immortalized brown adipocyte cell line (vehicle n = 7; 1 mM succinate n = 6; 5 mM succinate n = 7). c, Representative OCR trace monitoring dose-dependent effect of acute addition of succinate in various cell types (subcutaneous white adipocytes n = 6; 1 mM n = 6; 5 mM n = 5; myoblasts n = 7; 1 mM n = 6; 5 mM n = 7; HEK n = 7; 1 mM n = 6; 5 mM n = 7; hepatocytes n = 7; 1 mM n = 6; 5 mM n = 7; osteocytes n = 7; 1 mM n = 6; 5 mM n = 7; A549 lung n = 7; 1 mM n = 6; 5 mM n = 7; brown pre-adipocytes n = 7; 1 mM n = 6; 5 mM n = 7). d, Effect of acute addition of succinate on cellular OCR in human brown adipocytes (n = 6; 5 mM n = 7). e, Representative OCR trace monitoring dose-dependent effect of acute addition of succinate in human immortalized brown adipocytes (vehicle n = 7; 1 mM succinate n = 6). f, Inhibition of succinate-stimulated OCR in brown adipocytes by suppression of plasma membrane transport with DTNB. g, Representative oxygen consumption rate (OCR) experiment (n = 7; 0.1 mM DTNB n = 6). h,i, Inhibition of succinate-stimulated OCR in brown adipocytes by treatment with the plasma membrane transport inhibitor DIDS. (n = 12; 1 mM DIDS n = 8). j,k, Inhibition of succinate-stimulated OCR in brown adipocytes by treatment with the Na+/K+ ATPase inhibitor ouabain. (n = 5). Effects on respiration were determined by acute addition, ± oligomycin (oli) to determine leak respiration, ± 2,4-dinitrophenol (DNP) to determine chemically uncoupled maximal respiration, and rotenone + antimycin (r/a) to determine non-mitochondrial respiration. In all cases basal respiration in these cells is in the presence of 1 mM pyruvate. d, two-sided t-test; f,h,j two-way ANOVA; data are mean of biologically independent samples ± s.e.m.
Extended Data Figure 6: Examining mechanisms of succinate-driven thermogenesis in brown adipocytes.
a, Succinate-induced respiration is intact in brown adipocytes lacking SUCNR1 (n = 10; 1 mM succinate n = 9). b, Measurement of cAMP abundance in brown adipocytes 10 min following addition of succinate. c, Immunoblot analysis of PKA substrate phosphorylation following addition of succinate (30 min) or NE (5 min). d, Glycerol release rate from brown adipocytes as an index of lipolysis in response to succinate or NE (n = 6). e-g, Effect of acute addition of succinate in mitochondria isolated from BAT monitoring (g) effects on basal respiration rate and (h) leak respiration, and chemically uncoupled maximal respiration. (n = 7; succinate n = 8). h, Quantitation of SLC25A10 protein levels in mouse liver, brain, heart, and BAT (n = 3). i,j, Inhibition of succinate-stimulated OCR in brown adipocytes by treatment with the SLC25A10 inhibitor diethyl butylmalonate (DEBM; n = 11). Data are mean ± s.e.m. of at least three replicates. k, Effect of succinate treatment on brown adipocyte ROS levels assessed by DHE oxidation (n = 15). l, Acute addition of succinate drives rapid DHE oxidation in brown adipocytes (n = 15). m, Representative high resolution microscopic images illustrating effect of acute (10 min) addition of succinate on DHE oxidation in brown adipocytes. Scale bars = 20 μm. a,e,f,g, two-sided t-test; d,l, one-way ANOVA; k, two-way ANOVA; data are mean of biologically independent samples ± s.e.m.
Extended Data Figure 7: Mechanisms of succinate-driven thermogenic ROS and respiration in brown adipocytes.
a, Effect of succinate treatment on Prx3 cysteine thiol sulfonic acid formation (n = 4; succinate n = 3). b, Effect of succinate treatment on Prx family cysteine thiol sulfonic acid (SO3−) status (n = 4; succinate n = 3). c, Representative OCR experiments of brown adipocytes ± acute addition succinate ± MitoQ or NAC. Effects on respiration were determined by acute addition, ± oligomycin (oli) to determine leak respiration, ± DNP to determine chemically uncoupled maximal respiration, and rotenone + antimycin (r/a) to determine non-mitochondrial respiration (MitoQ n = 6; 1 mM n = 6; 5 mM n = 5; NAC n = 7; 1 mM n = 6; 5 mM n = 7). d,e, Representative OCR experiments of brown adipocytes ± acute addition of diamide. Effects on respiration were determined by acute addition, ± oligomycin (oli) to determine leak respiration, ± DNP to determine chemically uncoupled maximal respiration, and rotenone + antimycin (r/a) to determine non-mitochondrial respiration. (n = 6; 200 μM diamide n = 5). f, Potential pathways for succinate-driven thermogenic ROS in brown adipocytes via SDH or electron transfer via QH2. 1, Malonate inhibits succinate oxidation by SDH19; 2, Atpenin A5 (AA5) inhibits electron transfer between SDH and the ubiquinone pool20; 3, S1Q2.2 inhibits ROS production from mitochondrial complex I21; 4, iGP1 inhibits electron transfer between αGPDH and the ubiquinone pool23; and S3Q3 inhibits ROS production from mitochondrial complex III22. g, Representative OCR experiment demonstrating inhibition of succinate stimulated OCR by suppression of SDH oxidation with malonate (n = 6; 5 mM malonate n = 5). h,i Treatment of brown adipocytes with malonate results in (h) rapid intracellular accumulation (n = 4) and (i) prevents succinate-driven DHE oxidation in brown adipocytes (n = 30). j-l, Representative OCR experiments in brown adipocytes ± acute addition succinate ± (j) AA5 (n = 6; 10 nM n = 6; 100 nM n = 5), (k,l) S1Q2.2 (n = 6; 10 μM n = 6; 100 μM n = 7), (m,n) S3Q3 (n = 13; 1 μM n = 12). o, treatment of brown adipocytes with S3Q3 has no effect on succinate-driven DHE oxidation in brown adipocytes (n = 30; 1 μM n = 15). p, Succinate stimulation of brown adipocyte OCR ± iGP (iGP vehicle n = 21; iGP 10 μM n = 17; iGP 100 μM n = 26). q, Representative OCR experiments in brown adipocytes ± acute addition succinate ± iGP1 (n = 7; 1 μM n = 6; 100 μM n = 7). a,e,i, two-sided t-test; h,o, one-way ANOVA; k,m,p, two-way ANOVA; data are mean of biologically independent samples ± s.e.m.
Extended Data Figure 8: Metabolic characterization of mice following systemic succinate administration.
a, Effect of acute i.v. administration of succinate on interscapular temperature (n = 6; succinate n = 5). b, Acute effect of i.v. succinate on whole body oxygen consumption in WT and UCP1KO mice. Basal O2 consumption rate determined as described in the methods section (n = 10; succinate n = 7; UCP1KO n = 9). c, Mouse interscapular temperature following acute exposure to 4°C ± acute i.v. administration of malonate (n = 8). Malonate was administered 10 min prior to transition to 4°C. d, Acute oral administration of succinate by gavage drives elevation of circulating succinate (n = 4; 10% 30 min n = 6). e, Water consumption during high-fat feeding ± intervention with 1% and 1.5% sodium succinate in drinking water indicates lack of aversion to succinate-containing water (n = 35; 1% n = 26; 1.5% n = 18). f, Water consumption during high-fat feeding ± intervention with 2% succinate in drinking water indicates lack of aversion to succinate-containing water (n = 24; 2% n = 22). g, Body weights of high-fat diet feeding mice prior to intervention with 1% and 1.5% sodium succinate in drinking water (n = 35; 1% n = 26; 1.5% n = 18). h, Body weights of high-fat diet feeding mice prior to intervention with 2% sodium succinate in drinking water (n = 24; 2% n = 22; pair fed n = 18). i, kcal consumption during high-fat feeding ± intervention with 1% and 1.5% sodium succinate in drinking water. Consumption data indicate no significant effect of succinate on kcal consumed by food (n = 35; 1% n = 26; 1.5% n = 18). j, kcal consumption during high-fat feeding ± intervention with 2% sodium succinate in drinking water, pair fed mice in this experiment were fed the same number of calories as the 2% succinate group (n = 24; 2% n = 22; pair fed n = 18). k-l, kcal absorption and energy assimilation during high-fat feeding ± intervention with either (h) 1.5% or (i) 2% sodium succinate in drinking water. Proportion of energy assimilated from diet was determined by subtracting the total kcal remaining in mouse feces from the total kcal consumed in the same period (n = 6). *P < 0.05, **P<0.01; a,b (left), c, two-way ANOVA; b (middle, right), d, one-way ANOVA; k, two-sided t-test; data are mean of biologically independent samples ± s.e.m.
Extended Data Figure 9: Assessment of morphologic effects of systemic succinate administration on mouse tissues.
a-f, Representative images of hematoxylin and eosin (a, b, d-f) or Masson’s trichrome (c) staining of indicated tissues harvested from mice following high-fat feeding ± 4 weeks succinate supplementation in drinking water. (a, c, e upper panels 4x magnification, scale bars 1 mm; a, c, e lower panels, b, d, f 40x magnification, scale bars 50 μm). d, Cardiac morphometric analysis ± intervention with 1.5% sodium succinate. Lower panels show representative images of cell width (x40 magnification, scale bars 50 μm). The bar charts indicate quantitative analysis of cardiomyocyte width and length and nuclear diameter (n= 15). g, i.p. glucose tolerance test in mice following high-fat feeding ± 4 weeks succinate supplementation in drinking water quantifying relative changes in glucose upon glucose challenge (n = 9). h, i, mRNA expression of inflammatory (h) and anti-inflammatory (i) markers in the indicated tissues ± intervention with 1.5% sodium succinate in WT and UCP1KO mice (n = 3). g, two-way ANOVA; h, one-way ANOVA; data are mean of biologically independent samples ± s.e.m.
Extended Data Figure 10: Metabolic characterization of UCP1-deficient mice following systemic succinate administration.
a, Change in body mass in UCP+/− (n = 9; 1.5% n = 9) and UCP−/− (n = 7; 1.5% n = 8) male mice during high-fat feeding ± intervention with 1.5% sodium succinate in drinking water. b, Change in body mass in UCP+/− (n = 9; 1.5% n = 8) and UCP−/− (n = 6; 1.5% n = 7) female mice during high-fat feeding ± intervention with 1.5% sodium succinate in drinking water. c, Body weights of high-fat diet feeding UCP+/− (n = 18; 1.5% n = 17) and UCP−/− (n = 13; 1.5% n = 15) mice prior to intervention with 1.5% sodium succinate in drinking water. d, Water consumption during high-fat feeding ± intervention with 1.5% sodium succinate in drinking water in UCP+/− (n = 18; 1.5% n = 17) and UCP−/− (n = 13; 1.5% n = 15) mice indicates lack of aversion to succinate-containing water. e, kcal consumption during high-fat feeding ± intervention with 1.5% sodium succinate in drinking water in UCP+/− (n = 18; 1.5% n = 17) and UCP−/− (n = 13; 1.5% n = 15) mice. f, Energy expenditure of UCP1+/− and UCP1KO mice during 6 weeks high-fat feeding ± 1.5% sodium succinate (n = 18; UCP1+/− 1.5% n = 17; UCP1KO n = 13; UCP1KO 1.5% n = 15) a,b, two-way ANOVA; f, one-way ANOVA; data are mean of biologically independent samples ± s.e.m.
Supplementary Material
Supplementary Data File 1: MS2 spectra of all identified Prx cysteine containing peptides identified in MS experiments in either their unmodified (iodoacetamide alkylated) form or cysteine thiol sulfonic acid form.
Acknowledgements:
Supported by the Claudia Adams Barr Program (E.T.C), EMBO (E.L.M), Novo Nordisk (S.W), CIHR (L.K), NIH-DK97441 and DK112268 (S.K.), MRC-MC_U105663142, Wellcome Trust 110159/Z/15/Z (M.P.M), and NIH-GM067945 (S.P.G). We acknowledge Bruce Spiegelman for helpful discussions, Renata Goncalves for assistance with reagents, the Nikon Imaging Center at Harvard Medical School for assistance with microscopy, and Dana-Farber/Harvard Cancer Center (NIH-5-P30-CA06516) for preparing histology slides.
Footnotes
Competing Interests: E.T.C and E.L.M have applied for a patent on some of the work described here.
Data availability. Full scans for all western blots are provided in Supplementary Fig 1. Source Data for all mouse experiments have been provided. All other data are available from the corresponding author on reasonable request.
References:
- 1.Pfeifer A & Hoffmann LS Brown, beige, and white: the new color code of fat and its pharmacological implications. Annu Rev Pharmacol Toxicol 55, 207–227 (2015). [DOI] [PubMed] [Google Scholar]
- 2.Cypess AM, et al. Cold but not sympathomimetics activates human brown adipose tissue in vivo. Proceedings of the National Academy of Sciences of the United States of America 109, 10001–10005 (2012). [DOI] [PMC free article] [PubMed] [Google Scholar]
- 3.Cypess AM, et al. Activation of human brown adipose tissue by a beta3-adrenergic receptor agonist. Cell metabolism 21, 33–38 (2015). [DOI] [PMC free article] [PubMed] [Google Scholar]
- 4.Carey AL, et al. Ephedrine activates brown adipose tissue in lean but not obese humans. Diabetologia 56, 147–155 (2013). [DOI] [PubMed] [Google Scholar]
- 5.Ravussin Y, Xiao C, Gavrilova O & Reitman ML Effect of intermittent cold exposure on brown fat activation, obesity, and energy homeostasis in mice. PLoS One 9, e85876 (2014). [DOI] [PMC free article] [PubMed] [Google Scholar]
- 6.Hanssen MJ, et al. Short-term cold acclimation improves insulin sensitivity in patients with type 2 diabetes mellitus. Nature medicine 21, 863–865 (2015). [DOI] [PubMed] [Google Scholar]
- 7.Hui S, et al. Glucose feeds the TCA cycle via circulating lactate. Nature 551, 115–118 (2017). [DOI] [PMC free article] [PubMed] [Google Scholar]
- 8.Faubert B, et al. Lactate Metabolism in Human Lung Tumors. Cell 171, 358–371 e359 (2017). [DOI] [PMC free article] [PubMed] [Google Scholar]
- 9.Hems R, Stubbs M & Krebs HA Restricted permeability of rat liver for glutamate and succinate. The Biochemical journal 107, 807–815 (1968). [DOI] [PMC free article] [PubMed] [Google Scholar]
- 10.Ehinger JK, et al. Cell-permeable succinate prodrugs bypass mitochondrial complex I deficiency. Nat Commun 7, 12317 (2016). [DOI] [PMC free article] [PubMed] [Google Scholar]
- 11.Hochachka PW & Dressendorfer RH Succinate accumulation in man during exercise. Eur J Appl Physiol Occup Physiol 35, 235–242 (1976). [DOI] [PubMed] [Google Scholar]
- 12.Sadagopan N, et al. Circulating succinate is elevated in rodent models of hypertension and metabolic disease. Am J Hypertens 20, 1209–1215 (2007). [DOI] [PubMed] [Google Scholar]
- 13.Correa PR, et al. Succinate is a paracrine signal for liver damage. J Hepatol 47, 262–269 (2007). [DOI] [PMC free article] [PubMed] [Google Scholar]
- 14.Chouchani ET, et al. Mitochondrial ROS regulate thermogenic energy expenditure and sulfenylation of UCP1. Nature 532, 112–116 (2016). [DOI] [PMC free article] [PubMed] [Google Scholar]
- 15.Brand MD & Nicholls DG Assessing mitochondrial dysfunction in cells. The Biochemical journal 435, 297–312 (2011). [DOI] [PMC free article] [PubMed] [Google Scholar]
- 16.Murphy MP How mitochondria produce reactive oxygen species. The Biochemical journal 417, 1–13 (2009). [DOI] [PMC free article] [PubMed] [Google Scholar]
- 17.Chouchani ET, Kazak L & Spiegelman BM Mitochondrial reactive oxygen species and adipose tissue thermogenesis: Bridging physiology and mechanisms. The Journal of biological chemistry 292, 16810–16816 (2017). [DOI] [PMC free article] [PubMed] [Google Scholar]
- 18.Smith RA & Murphy MP Animal and human studies with the mitochondria-targeted antioxidant MitoQ. Ann N Y Acad Sci 1201, 96–103 (2010). [DOI] [PubMed] [Google Scholar]
- 19.Quastel JH & Wooldridge WR Some properties of the dehydrogenating enzymes of bacteria. The Biochemical journal 22, 689–702 (1928). [DOI] [PMC free article] [PubMed] [Google Scholar]
- 20.Miyadera H, et al. Atpenins, potent and specific inhibitors of mitochondrial complex II (succinate-ubiquinone oxidoreductase). Proceedings of the National Academy of Sciences of the United States of America 100, 473–477 (2003). [DOI] [PMC free article] [PubMed] [Google Scholar]
- 21.Brand MD, et al. Suppressors of Superoxide-H2O2 Production at Site IQ of Mitochondrial Complex I Protect against Stem Cell Hyperplasia and Ischemia-Reperfusion Injury. Cell metabolism 24, 582–592 (2016). [DOI] [PMC free article] [PubMed] [Google Scholar]
- 22.Orr AL, et al. Suppressors of superoxide production from mitochondrial complex III. Nature chemical biology 11, 834–836 (2015). [DOI] [PMC free article] [PubMed] [Google Scholar]
- 23.Orr AL, et al. Novel inhibitors of mitochondrial sn-glycerol 3-phosphate dehydrogenase. PLoS One 9, e89938 (2014). [DOI] [PMC free article] [PubMed] [Google Scholar]
- 24.Golozoubova V, Cannon B & Nedergaard J UCP1 is essential for adaptive adrenergic nonshivering thermogenesis. Am J Physiol Endocrinol Metab 291, E350–357 (2006). [DOI] [PubMed] [Google Scholar]
- 25.Maekawa A, et al. Lack of toxicity/carcinogenicity of monosodium succinate in F344 rats. Food Chem Toxicol 28, 235–241 (1990). [DOI] [PubMed] [Google Scholar]
- 26.Browne JL, Sanford PA & Smyth DH Transfer and metabolism of citrate, succinate, alpha-ketoglutarate and pyruvate by hamster small intestine. Proc R Soc Lond B Biol Sci 200, 117–135 (1978). [DOI] [PubMed] [Google Scholar]
- 27.Ravussin Y, Gutman R, LeDuc CA & Leibel RL Estimating energy expenditure in mice using an energy balance technique. Int J Obes (Lond) 37, 399–403 (2013). [DOI] [PMC free article] [PubMed] [Google Scholar]
- 28.Goldgof M, et al. The chemical uncoupler 2,4-dinitrophenol (DNP) protects against diet-induced obesity and improves energy homeostasis in mice at thermoneutrality. The Journal of biological chemistry 289, 19341–19350 (2014). [DOI] [PMC free article] [PubMed] [Google Scholar]
- 29.Peruzzotti-Jametti L, et al. Macrophage-Derived Extracellular Succinate Licenses Neural Stem Cells to Suppress Chronic Neuroinflammation. Cell Stem Cell 22, 355–368 e313 (2018). [DOI] [PMC free article] [PubMed] [Google Scholar]
- 30.Littlewood-Evans A, et al. GPR91 senses extracellular succinate released from inflammatory macrophages and exacerbates rheumatoid arthritis. J Exp Med 213, 1655–1662 (2016). [DOI] [PMC free article] [PubMed] [Google Scholar]
- 31.Pan D, Fujimoto M, Lopes A & Wang YX Twist-1 is a PPARdelta-inducible, negative-feedback regulator of PGC-1alpha in brown fat metabolism. Cell 137, 73–86 (2009). [DOI] [PMC free article] [PubMed] [Google Scholar]
- 32.Cannon B & Nedergaard J Nonshivering thermogenesis and its adequate measurement in metabolic studies. J Exp Biol 214, 242–253 (2011). [DOI] [PubMed] [Google Scholar]
- 33.Gospodarska E, Nowialis P & Kozak LP Mitochondrial turnover: a phenotype distinguishing brown adipocytes from interscapular brown adipose tissue and white adipose tissue. The Journal of biological chemistry 290, 8243–8255 (2015). [DOI] [PMC free article] [PubMed] [Google Scholar]
- 34.Townsend MK, et al. Reproducibility of metabolomic profiles among men and women in 2 large cohort studies. Clin Chem 59, 1657–1667 (2013). [DOI] [PMC free article] [PubMed] [Google Scholar]
- 35.Kir S, et al. Tumour-derived PTH-related protein triggers adipose tissue browning and cancer cachexia. Nature 513, 100–104 (2014). [DOI] [PMC free article] [PubMed] [Google Scholar]
- 36.Kazak L, et al. A Creatine-Driven Substrate Cycle Enhances Energy Expenditure and Thermogenesis in Beige Fat. Cell 163, 643–655 (2015). [DOI] [PMC free article] [PubMed] [Google Scholar]
- 37.Shinoda K, et al. Genetic and functional characterization of clonally derived adult human brown adipocytes. Nature medicine 21, 389–394 (2015). [DOI] [PMC free article] [PubMed] [Google Scholar]
- 38.Eng JK, McCormack AL & Yates JR An approach to correlate tandem mass spectral data of peptides with amino acid sequences in a protein database. J Am Soc Mass Spectrom 5, 976–989 (1994). [DOI] [PubMed] [Google Scholar]
- 39.Elias JE & Gygi SP Target-decoy search strategy for increased confidence in large-scale protein identifications by mass spectrometry. Nat Methods 4, 207–214 (2007). [DOI] [PubMed] [Google Scholar]
- 40.Huttlin EL, et al. A tissue-specific atlas of mouse protein phosphorylation and expression. Cell 143, 1174–1189 (2010). [DOI] [PMC free article] [PubMed] [Google Scholar]
- 41.Guo J & Hall KD Predicting changes of body weight, body fat, energy expenditure and metabolic fuel selection in C57BL/6 mice. PLoS One 6, e15961 (2011). [DOI] [PMC free article] [PubMed] [Google Scholar]
Associated Data
This section collects any data citations, data availability statements, or supplementary materials included in this article.
Supplementary Materials
Supplementary Data File 1: MS2 spectra of all identified Prx cysteine containing peptides identified in MS experiments in either their unmodified (iodoacetamide alkylated) form or cysteine thiol sulfonic acid form.


