Abstract
Membrane reorientation of oncogenic RAS proteins is emerging as an important modulator of their functions. Previous studies have shown that the most common orientations include those with either the three C-terminal α-helices (OS1) or N-terminal β-strands (OS2) of the catalytic domain facing the membrane. OS1 and OS2 differ by the degree to which the effector-interacting surface is occluded by the membrane. However, the relative stability of these states and the rates of transition between them remained undetermined. How mutations might modulate preferences for specific orientation states is also far from clear. The current work attempted to address these questions through a comprehensive analysis of two 20 μs-long atomistic molecular dynamics simulations. The simulations were conducted on the oncogenic G12D and Q61H KRAS mutants bound to an anionic lipid bilayer. G12D and Q61H are among the most prevalent cancer-causing mutations at the P-loop and switch 2 regions of KRAS, respectively. We found that both mutants fluctuate in a similar manner between OS1 and OS2 via an intermediate orientation OS0, and both favor the signaling competent OS1 and OS0 over the occluded OS2. However, they differ in the details, such as in the extent to which they sample OS1. Analysis of the orientation free-energy landscapes estimated from the simulations indicate that OS1 and OS2 are the most stable states. However, the overall free energy surface is rugged, indicating a large diversity of conformations including at least two substates in each orientation state that differ in stability only by about 0.5–1.0 kcal/mol. Reversible transitions between OS1 and OS2 occur via two well-defined pathways that traverse OS0. In the minimum energy path, helix 4 remains close to the membrane as the angle of the catalytic domain from the membrane plane changes, resulting in a barrier of ~1 kcal/mol for OS1/OS2 interconversions. Estimation of the rates of the various transitions based on survival probabilities yielded two rate constants in the order of 107 and 106 s−1, which we attribute to intrinsic protein conformational dynamics and transient protein–lipid interactions, respectively. The faster process dominates every transition, confirming a previous suggestion that RAS membrane reorientation is driven by conformational fluctuations rather than protein–lipid interactions.
Graphical Abstract
INTRODUCTION
RAS proteins mediate a wide variety of signal transduction events by cycling between GTP-bound active and GDP-bound inactive conformations.1,2 GDP-bound RAS interacts with guanine nucleotide exchange factors (GEFs) while GTP-RAS interacts with effector kinases and GTPase activating proteins (GAPs). GEFs facilitate exchange of GDP for GTP and GAPs catalyze GTP hydrolysis. Oncogenic mutations impair GAP action or decrease the rate of intrinsic GTPase activity of RAS, leading to constitutive RAS activation and cancer.3,4 The most common RAS mutations occur at amino acid positions 12, 13 and 61.5,6 Of the three human RAS isoforms, KRAS is the most frequently mutated in cancers, followed by NRAS and HRAS. For example, KRAS is mutated in approximately 92% of pancreatic, 43% colon, and 33% lung cancer cases.7,8
The structure of KRAS consists of a conserved catalytic domain (residues 1–166) and a hypervariable region (HVR) comprised of residues 167–185. The polybasic farnesylated lipid anchor at the C-terminus of the HVR attaches KRAS to the inner surface of the plasma membrane. The catalytic G-domain has two lobes:9 lobe1 (residues 1–86) and lobe2 (residues 87–166). The G-domain of KRAS, as well as NRAS and HRAS, adopts multiple orientations with respect to the membrane plane.10–19 Membrane reorientation can be modulated by GDP/GTP exchange or mutation,13,16–22 can lead to occlusion of the effector binding region,11,17 and affects the solvent accessibility of some ligand-binding sites.23,24 Moreover, ligands have been reported that inhibit KRAS likely by stabilizing the occluded orientation.25,26 These observations strongly suggest that membrane reorientation may also modulate RAS functions in the cell. A better understanding of membrane orientation dynamics of RAS proteins in general, and KRAS in particular, may therefore open up new opportunities for therapeutic interventions.
Previous molecular dynamics (MD) simulations of KRAS in a POPC/POPS bilayer identified two dominant orientations:11 orientation state 1 (OS1) in which helices 3–5 of lobe2 face the membrane, and orientation state 2 (OS2) where residues at the three N-terminal β-strands of lobe1 face the membrane (Figure 1). Similar observations were made using nuclear magnetic resonance (NMR) analysis of KRAS bound to a synthetic lipid nanodisc,17 and single-molecule fluorescence resonance energy transfer (smFRET) measurements of KRAS bound to cell-derived native lipid nanodiscs.10 Other simulation and experimental studies arrived at a similar conclusion.27,28
Figure 1.
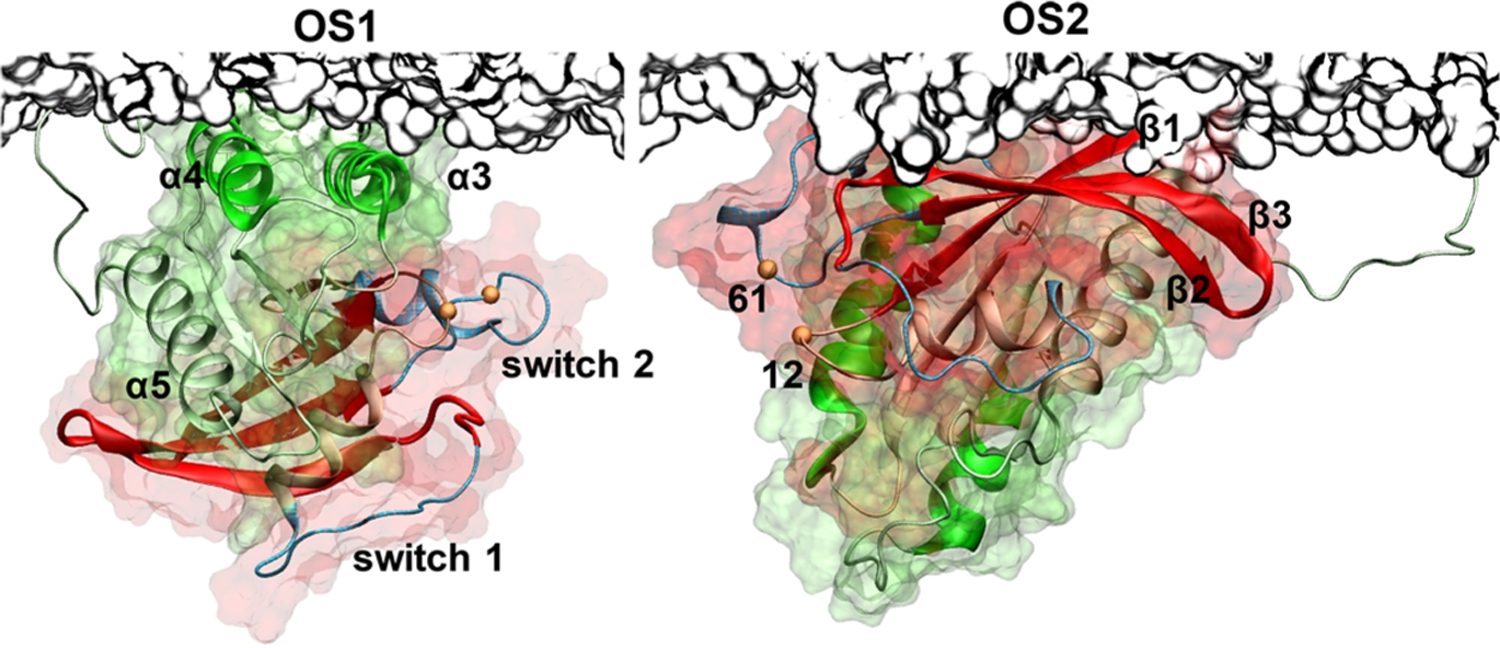
Orientations of the KRAS catalytic domain on membrane surfaces. Shown are two predominantly sampled orientations of the KRAS catalytic domain on the surface of a POPC/POPS bilayer observed in previous MD simulations.11 Notice that in OS1 helices α3 and α4 (green) are near the bilayer surface, whereas in OS2 β-strands β1–β3 from the opposite face of the catalytic domain (red) are close to the membrane. The two lobes of KRAS are shown in surface representation with lobe1 (residues 1–86) in red and lobe2 (residues 87–166) in green; switch 1 (residues 25–40) and switch 2 (residues 57–75) are shown in light blue, and the P-loop is in orange. The locations of the two mutations studied in the current work, Q61H on switch 2 and G12D on the P-loop, are shown as small orange spheres. A portion of the bilayer surface is shown in gray using surface representation.
Despite the notable advances described above that enhanced our understanding of KRAS conformational dynamics at membrane surfaces, the relative stability of the different orientation states and the rates of transition between the states remained unexplored. This information is crucial to fully understand the mechanism and harness the therapeutic potential of membrane orientation dynamics, or to predict the extent to which mutations may modulate the distribution of orientation states and thereby function. The current work explores the conformational landscape and energetics of KRAS membrane reorientation based on data from extended atomistic MD simulations of G12D and Q61H KRAS mutants. G12D and Q61H represent the most prevalent oncogenic mutations at the P-loop and switch 2 regions of KRAS, respectively, and are commonly found in a variety of cancers. For example, the prevalence of G12D and Q61H KRAS mutations in pancreatic cancer is 51% and 82%;7,29 G12D KRAS mutation is also found in 34% of colorectal and 17% of lung cancer cases (COSMIC database). Our 20-μs-long simulations on these mutants yielded a considerable number of transition events that allowed us to estimate the relative stability of the major orientation states and examine the mechanisms and rates of transition among them.
COMPUTATIONAL DETAILS
We simulated GTP-bound G12D and Q61H KRAS attached to a POPC/POPS (80/20%) bilayer. The MD simulations were conducted on Anton 230 with the goal of observing reversible transitions between conformational states that would allow us to evaluate the energy landscape of KRAS membrane orientation. Technical details of the simulations are as described in previous publications,10,11 while the definition of reaction coordinates and the description of structural, thermodynamic and kinetic analyses techniques can be found in the Results and Discussion. Below we briefly describe the methods that are specific to the current work and are not described elsewhere in the manuscript.
The starting structure for the MD simulation of G12D KRAS was a snapshot in the OS1 configuration from a previous simulation.11 Since the then existing X-ray structure of Q61H KRAS was of relatively poor resolution (2.27 Å) and had missing residues, we mutated Asp12 to Gly and Gln61 to His on the G12D structure to generate a starting structure for the Q61H simulation. Each system was solvated by TIP3P waters containing 192 Na+ and 96 Cl− ions, resulting in a 150000-atoms system and a physiologic ionic strength of 150 mM. Each system was simulated for 20 μs with Desmond using default conditions (e.g., a 2.5 fs time step and the U-series cutoffs), the CHARMM36m force field for proteins,31 CHARMM36 parameters for lipids,32 and in-house parameters for GTP.11 Coordinates were saved every 100 ps (i.e., a total of 200,000 snapshots per system) and analyzed as described in Results and Discussion and previous publications.10,11
RESULTS AND DISCUSSION
We conducted a 20-μs-long MD simulation on each of the G12D and Q61H oncogenic KRAS mutants attached to a pre-equilibrated bilayer made up of POPC (80%) and POPS (20%) phospholipids. We chose this lipid mixture because: (i) it reflects the PS content at the inner surface of the plasma membrane where KRAS is located; (ii) cellular KRAS selectively interacts with membrane patches enriched with PS but not with other anionic phospholipids such as PIP2 and PA;33 (iii) using the same lipid composition as in previous simulations10,11,33,34 allows us to directly compare the current results with published reports; and (iv) a two-component lipid mixture with or without the polycationic and farnesylated KRAS lipid anchor equilibrates well within hundreds of nanoseconds during atomistic simulations (e.g.: refs 35 and 36).
During the entire duration of each of the current simulations, KRAS remained attached to the bilayer via hydrophobic and ionic interactions involving the farnesyl tail and lysine residues at the lipid anchor. The catalytic domain, on the other hand, was forming dynamic contacts with lipid head groups. These contacts were made primarily via helices α3-α5 on lobe2 or β strands β1–β3 on lobe1, in agreement with previous observations on G12D11 and G12V10 KRAS. The two mutually exclusive forms of catalytic domain-membrane contact correspond to the previously defined orientation states 1 (OS1) and 2 (OS2), respectively11 (see Figure 1). In subsequent sections, we will describe the conformational dynamics and transition mechanisms between these two orientations via an intermediate state OS0.
Two Dominant Orientation States and an Intermediate.
We used two recently described reaction coordinates to quantitatively examine the orientational dynamics of KRAS:10 the distance between the Cα atoms of D132 on helix α4 and T183 on the lipid anchor (ζ), and the cosine of the angle between a vector along β1 (residues 5–9) and the membrane normal (cos(Θ)). The time evolution of ζ (Figure 2A) and cos(Θ) (Figure 2B) suggest large conformational fluctuations in both G12D and Q61H. In each case, ζ varies between 10 and 70 Å and cos(Θ) between 1 (Θ = 0°) and −0.9 (Θ ≈ 154°), indicating large differences among the simulated conformers in terms of distance and orientation of the catalytic domain relative to the bilayer surface. However, the histograms in Figure 2C show preferences for specific values of ζ. This can be seen from the sharp peak at ζ ≈ 22 Å in both mutants, a second peak at ζ ≈ 40 Å and a prominent shoulder around ζ ≈ 49 Å in Q61H, and a broad distribution capped by two minor peaks at ζ = 31 and 46 Å in G12D. Similarly, in both G12D and Q61H, cos(Θ) is characterized by a sharp peak at cos(Θ) = 1.0 and a broader distribution around −0.25 < cos(Θ) < 0.25 centered at 0. However, the peak at cos(Θ) = 0 is somewhat sharper and better resolved in Q61H than G12D. The overall shape of the distributions of ζ and cos(Θ) derived from the first and last 10 μs of the trajectory is similar for both the G12D and Q61H (Figure S1), with relatively small differences in terms of peak positions (i.e., dominant conformations) and variances (extent of conformational fluctuations). This suggests that the two halves of each simulation sampled similar regions of configurational space (variations in peak heights will be discussed later). Figure S1 also confirms that the subtle differences between Q61H and G12D mentioned above, such as differences in some of the peak positions and the sharper nature of the ζ and cos(Θ) distributions in the former, are not artifacts of sampling limitations. Together, these results suggest that Q61H and G12D KRAS fluctuate between the same of set configurations but differ in their preference for specific regions of the phase space defined by ζ and cos(Θ).
Figure 2.
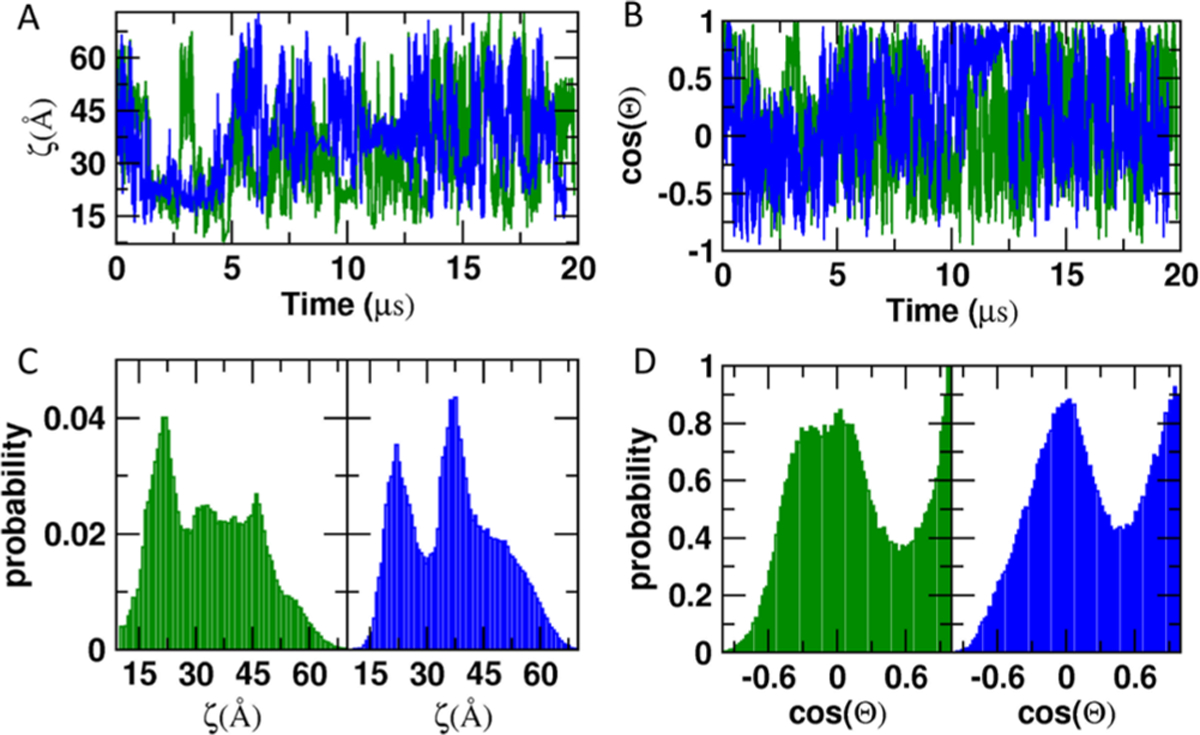
Conformational fluctuations of membrane-bound G12D and Q61H KRAS. (A, B) Evolution of ζ (A) and cos(Θ) (B) during a 20 μs MD simulation. (C, D) Normalized histograms of ζ (C) and cos(Θ) (D). G12D is in green and Q61H in blue. ζ = distance between the Cα atoms of residues D132 and T183; cos(Θ) = cosine of the angle between a vector along β-strand 1 (residues 5–9) and the membrane normal.
While ζ and cos(Θ) have captured the large conformational and orientational variabilities among the MD-derived conformers, neither was able to unambiguously group the data into distinct clusters. Therefore, we checked if the 2D probability density distribution, P(ζ,cos(Θ)) enables a better separation of the data, as found in a previous work.10 Indeed, there are two well-resolved peaks in the P(ζ,cos(Θ)) histogram of G12D (Figure 3A) and Q61H (Figure 3B). Based on visual analysis of the conformers in the two clusters and comparison with a recent study using a combined MD simulation and smFRET analysis,10 we determined that the peak at the bottom left corresponds to OS1 and the peak at the top corresponds to OS2; the wide distribution between the two major peaks represents OS0. One can see that the P(ζ,cos(Θ)) distributions for G12D and Q61H are similar, but not identical. For example, quantification of the population size of the two major clusters suggests that, while both mutants sample OS1 more than OS2, OS1 is more populated in G12D than Q61H (discussed further in a separate section).
Figure 3.
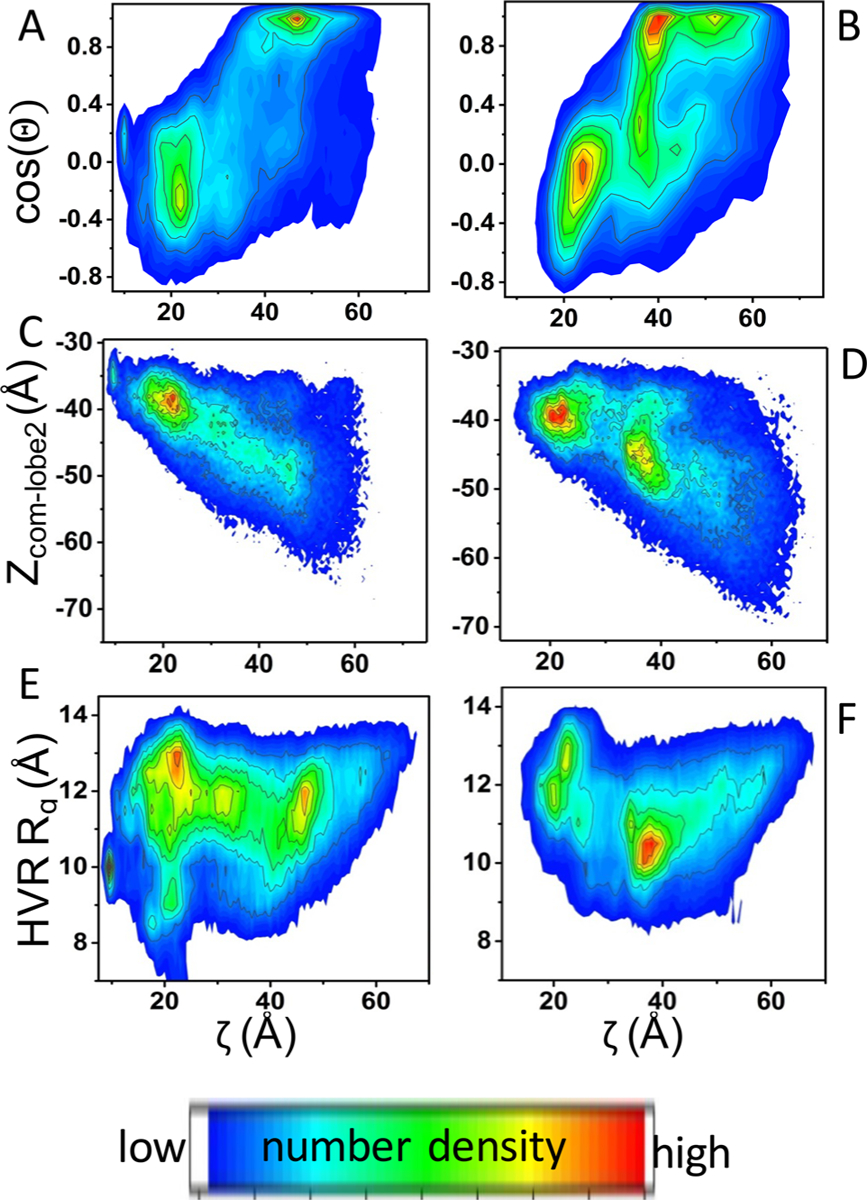
Distribution of orientation states examined by different reaction coordinates. 2D probability density distributions of the MD-derived data for G12D (left panels) and Q61H KRAS (right panels). (A, B) P(ζ,cos(Θ)); (C, D) P(ζ,Zcom_lobe2); (E, F): P(ζ,HVR Rg). Zcom_lobe2 = center-of-mass distance between lobe2 and the bilayer; HVR Rg = radius of gyration of the HVR (residues 167–185). See text and Figure 2 for the definition of the other reaction coordinates.
To check if our classification of the conformers based on ζ and cos(Θ) is robust, we reanalyzed the data using two other reaction coordinates: Zcom_lobe2 (the center-of-mass distance between lobe2 and the bilayer), and HVR Rg (the radius of gyration of the HVR). As can be seen in Figure 3C–F, the P(ζ,Zcom_lobe2) and P(ζ,HVR Rg) histograms are generally similar to the P(ζ,cos(Θ)) plots described above. In each case, at least two dominant peaks are apparent. Subsequent visual analysis of the conformers comprising each of the high-density regions confirmed that the two major peaks represent OS1 and OS2. For example, conformers with less compact HVR (HVR Rg > 11 Å) and those whose lobe2 is closer to the bilayer center (|Zcom_lobe2| < 46) generally are also characterized by smaller values of cos(Θ) and ζ and thus belong to OS1.
While the overall qualitative conclusions drawn from analyses of the data with the different reaction coordinates are consistent, it is clear from Figure 3 that the quantitative outcomes can be reaction coordinate dependent. For instance, for G12D, P(ζ,cos(Θ)) does a good job of clustering the data into two distinct groups while P(ζ,Zcom_lobe2) does poorly and P(ζ,HVR Rg) yielded more than two high-density regions. In the case of Q61H, P(ζ,HVR Rg) and P(ζ,Zcom_lobe2) performed a better job of data reduction than P(ζ,cos(Θ)). These results indicate that no two reaction coordinates will be equally useful for the different KRAS mutants, underscoring the underlying differences in dynamics and illustrating the challenge of an “apple-to-apple” comparison. Nonetheless, given the overall similarity of the dynamics described above, for the purposes of this work we assume that the data from the best two reaction coordinates for one mutant will be comparable to those from the best two reaction coordinates for another mutant. With this in mind, below we will use P(ζ,cos(Θ)) and the G12D mutant to draw general conclusions regarding thermodynamic and kinetic features, and then discuss subtle but potentially important differences between G12D and Q61H KRAS mutants.
Membrane Reorientation Energy Landscape.
The relatively long simulations conducted in this work resulted in a comparatively large number of transition events along ζ and cos(Θ) (Figure 2), which in principle allows one to estimate the free energy change of membrane reorientation (ΔGorient) from the 2D probability density distribution P(ζ, cos(Θ)) using eq 1:
| (1) |
where R is the universal gas constant and T = 310 K is the simulation temperature. It should be noted here that this analysis assumes the simulations are well-converged. One way to check this is to compare the distributions of ζ and cos(Θ) in the first and second halves of the trajectory. As shown in Figure S1 and noted earlier, the two halves of the G12D simulation (as well as the Q61H simulation) yielded generally similar distributions in terms of peak positions and variances. However, they differ in terms of the heights of the major peaks representing orientation states OS1 and OS2, suggesting that longer and/or multiple simulations are required to confidently predict the stability of OS1 relative to OS2 or vice versa. Other regions of the distributions, which we broadly define as OS0 (see previous section), are similar in the first and second halves of the trajectory. For the purposes of the current analysis, therefore, we assume that OS1 and OS2 are approximately equally stable as suggested by the distributions of ζ and cos(Θ) in the entire trajectory (Figure 2), and roughly estimate their free energy relative to the comparatively well-sampled OS0. Figure 4 displays the free energy surface for the orientational dynamics of G12D. Two energy basins of similar depth are apparent: the lower left basin represents OS1, and the topmost basin corresponds to OS2. These two states might be likened to the native state of a bistable folded protein. Outside these two energy wells, the protein samples a large configurational space as indicated by the shallow surface colored blue-through-orange. This region is broadly ascribed to OS0 and, extending our analogy to protein folding, may be compared with the denatured state of a protein. The most frequently sampled portion of the intermediate state OS0 comprises the region (31 < ζ < 45 Å, −0.6 < cos(Θ) < 0.75).
Figure 4.
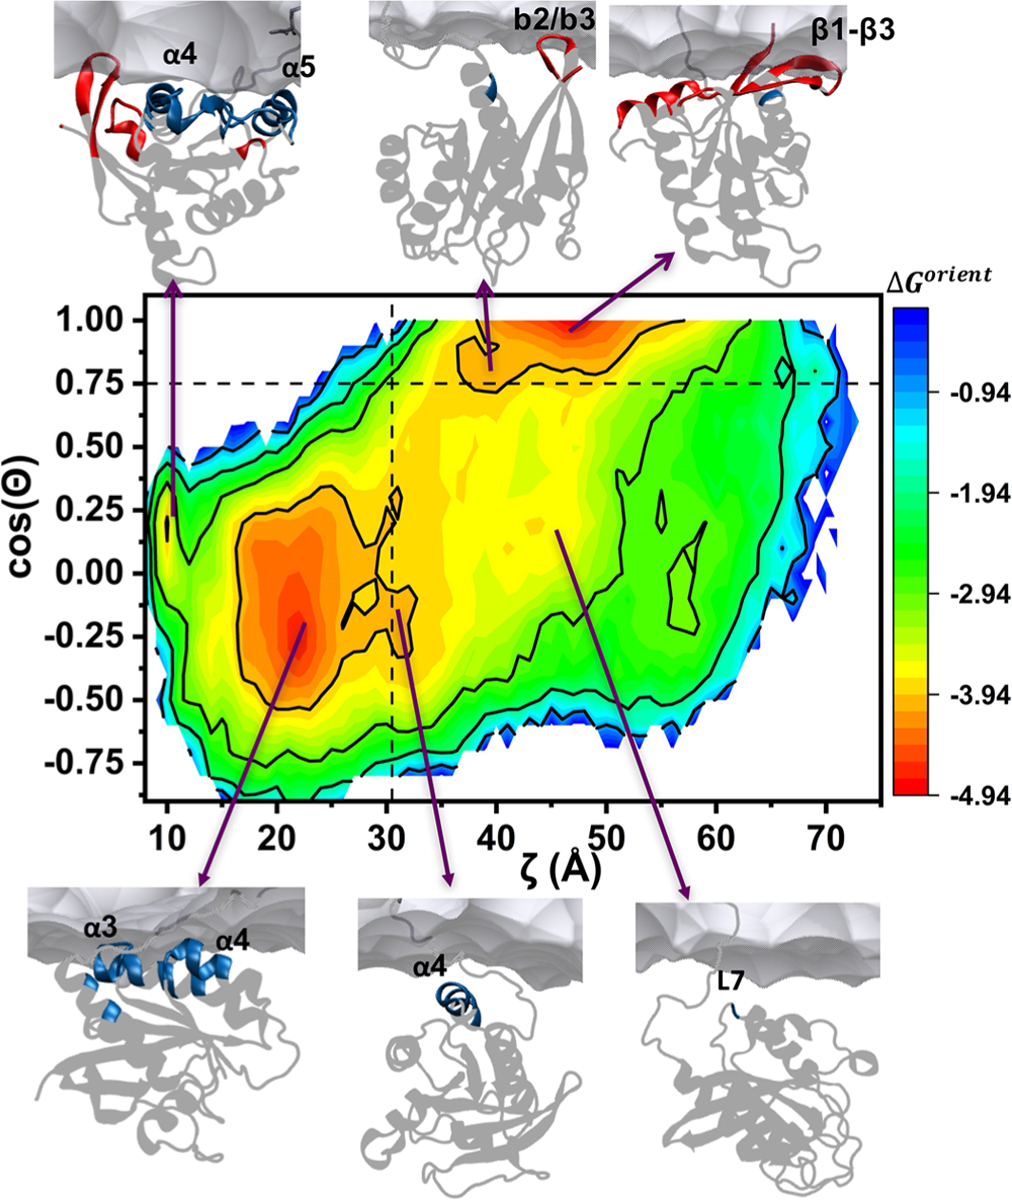
Membrane orientation energy landscape of G12D KRAS. Shown is the free energy surface of G12D based on ζ and cos(Θ). Equation 1 and the probability density distribution P(ζ, cos(Θ)) from Figure 3A were used to calculate the orientational free energy change ΔGorient (shown as contours of 1 kcal/mol). Snapshots at (10, 0.17), (22, −0.25), (31.5, −0.20), (43.5, 0.20), (40, 0.80), and (47, 0.99) illustrate two substates each in OS1 (top and bottom left: α3/α4 and α4/α5), OS2 (top: b2/b3 and ß1-ß3), and OS0 (bottom: α4 and L7). Secondary structure elements whose residues are within 9 Å of lipids are highlighted in blue for lobe2 and red for lobe1; the rest of the protein is in gray. A portion of the bilayer surface proximal to the protein is shown as gray surface. The dotted lines at ζ = 30.5 and cos(Θ) = 0.75 indicate the cutoffs used to split the trajectory into three groups.
The overall ruggedness of the free energy surface indicates that the simulated system is characterized by substantial conformational diversity. This diversity is exemplified by the representative snapshots displayed in Figure 4, which highlight that there are at least two substates in each state. The dominant suborientation in OS1 is α3/α4 in which helices α3 and α4 are located near the bilayer surface in a semiparallel orientation. The other OS1 substate is α4/α5, where helices 4 and 5 and turn β2/β3 face the membrane while the HVR wraps around the catalytic domain similar to that observed in H-RAS.16 However, we believe this metastable orientation is a kinetic trap because (i) it is visited only once during the simulation albeit for an extended period of ~1.5 μs, (ii) it was seldom observed in Q61H or during a previous simulation of G12V,10 and (iii) it is characterized by a very narrow energy well that is likely entropically less favored. Furthermore, while helices α3, α4, and α5 all harbor hotspot residues for membrane binding11,37,38 or self-interaction,39,40 residues on α3 and α4 made more frequent contact with the PC/PS lipid bilayer. It is possible that different lipids such as PIP2 could alter this preference as suggested in recent reports,27,28 but our current and previous simulations in PC/PS bilayers consistently show that α3/α4 may be more relevant for KRAS membrane contact than α4/α5.
Within OS2, too, there exist at least two substates that differ in stability by ~0.9 kcal/mol (Figure 4). In the more stable substate of the two, switch 2 and β1–β3 face the membrane. In the less stable substate, only turn β2/β3 faces the bilayer. We propose that the former, which contacts lipids through a larger surface area, is likely more relevant under physiologic conditions.
Traversing the region populated by the OS0 conformers are two low-energy valleys connecting OS1 and OS2. In one of these, helix α4 remains proximal to the membrane (ζ ≈ 32 ± 2) while cos(Θ) spans values from −0.6 to 0.75 (orange in Figure 4). Crossing only a relatively small energy barrier of ~1 kcal/mol would be required to transition between OS1 and OS2 via this path. The second valley (yellow) is of slightly higher energy, so that OS1/OS2 transition via this path requires crossing a ~ 1.5 kcal/mol barrier. In this pathway, α4 is farther away from the membrane (ζ ≈ 35–45) while loop7 (L7 in Figure 4) residues K101 and R102 make transient contacts with lipids.
Mechanism of Membrane Reorientation.
The analyses in the previous sections clearly show that reversible transitions between the OS1 and OS2 orientations occur via the highly dynamic OS0, and that in the lowest-energy transition paths either α4 or L7 are close to the bilayer surface. While direct membrane contact via the G-domain (defined by a heavy atom protein–lipid distance ≤4.5 Å) is minimal in OS0, it is well established that lobe2 helices α3–α5 and lobe1 β strands β1–β3 make dynamic contacts with lipids in OS1 and OS2, respectively.10,11 An important question is whether these dynamic interactions are drivers or consequences of the protein’s orientational dynamics.
We have seen in the previous section that, rather than docking nonspecifically, the catalytic domain approaches the bilayer via a limited number of pathways. This suggests that membrane reorientation is an intrinsic property of the protein and that interstate transitions likely involve a defined sequence of specific conformational changes. To explore this issue, we aligned the combined OS1 and OS2 ensemble based on the catalytic domain and compared the conformation of the HVR (Figure 5). Consistent with a previous observation on G12V,10 we found that the HVR faces lobe2 in OS1 but mostly lobe1 in OS2 (it is orientated away from the catalytic domain in some OS2 conformations). This suggests that the HVR dynamics and its orientation relative to the catalytic domain underpins membrane reorientation rather than specific interactions of the protein with lipids. To further check this, we grouped conformers with a minimum heavy atom distance of 9 Å between α4 residues 127–137 and lipids into one and those with a minimum heavy atom distance of 9 Å between β1–β3 residues (1–10 and 37–57) and lipids into another; the remaining snapshots formed a third group. These three groups are mutually exclusive because α4 and β1-β3 are located on the opposite face of the catalytic domain separated by more than 22 Å, and the 9 Å cutoff ensures that conformers with no direct membrane contact are included. Analysis of the three groups separately recapitulated the distributions of ζ and Zcom-lobe2 derived from the entire trajectory, confirming that KRAS can adopt a given orientation prior to contact with lipids. This conclusion does not rule out the steering effect of long-range electrostatic interactions. In fact, we believe that upon favorable alignments attraction between anionic lipids and surface exposed basic residues on α4 or L7 likely steers the catalytic domain to the bilayer surface. Subsequent local conformational changes tuned by short-range protein–lipid interactions would then lead to the adoption of a bona fide OS1 or OS2 orientation.
Figure 5.
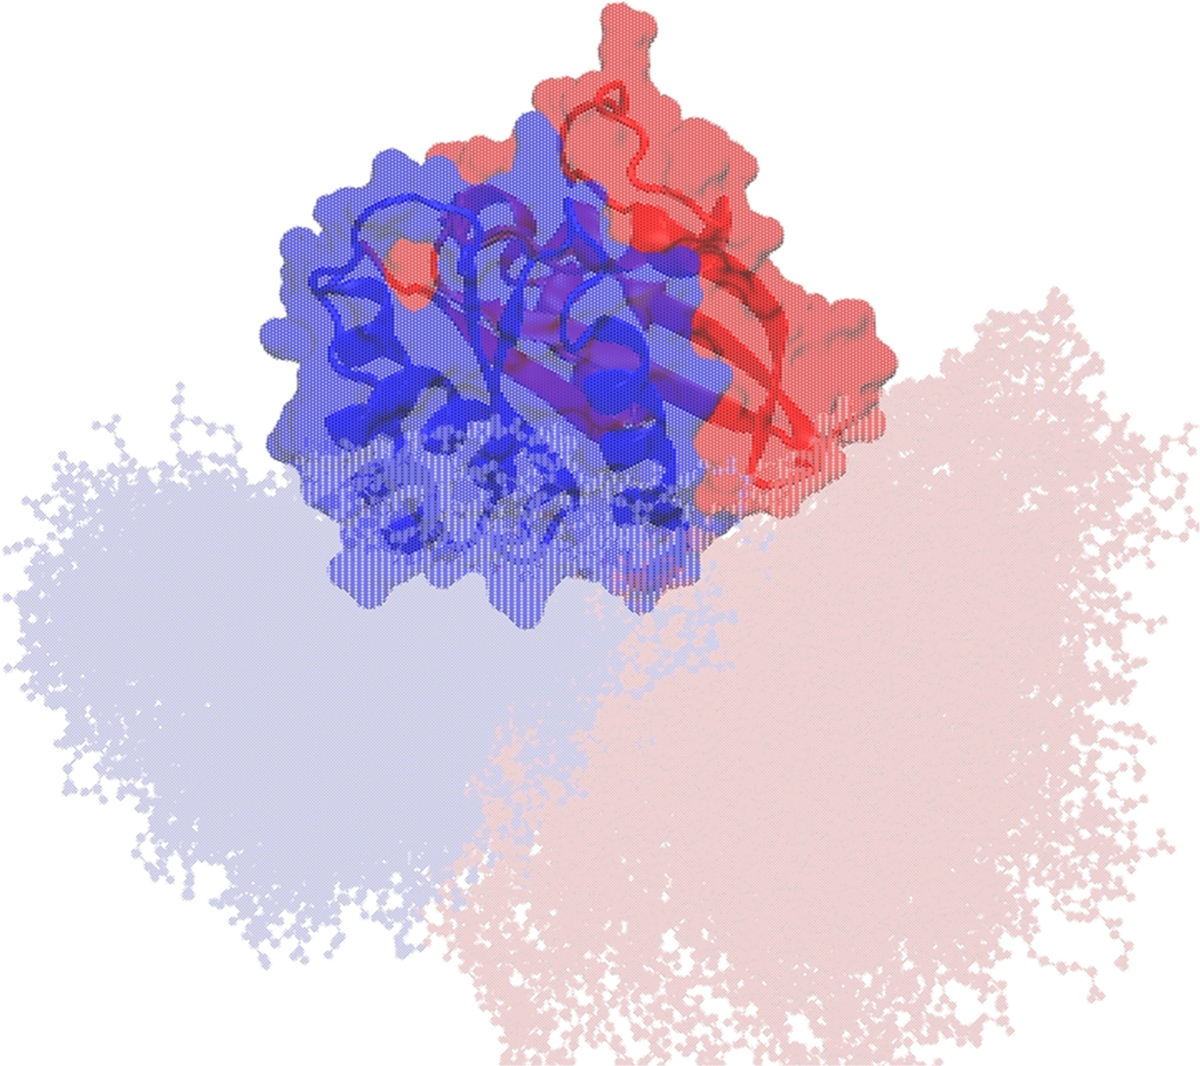
Conformational plasticity of the HVR underlies membrane reorientation. The combined ensemble of OS1 and OS2 was aligned using backbone atoms of the catalytic domain excluding the flexible switches, and using the equilibrated initial structure as reference. The HVR is oriented toward lobe2 (blue) and lobe1 (red) in conformations belonging to OS1 and OS2, respectively.
Kinetics of Membrane Reorientation.
Following previous studies,41–43 we estimated the rates for the reversible OS1/OS0 and OS2/OS0 transitions using the survival probability, S(Δt), of the protein in each orientation state. For this analysis, the OS0 ensemble was split into two depending on the direction of transition (i.e., toward OS1 or OS2). S(Δt) was then calculated as the probability of the protein existing in a specific orientation, uninterrupted, between time t and t + Δt. The plots of S(Δt) shown in Figure 6 suggest similar rates of transition among the three orientation states, with no obvious difference in the rates of the forward and backward reactions. Indeed, a double-exponential fit of S(Δt) yielded very similar rate constants, k, for all of the reactions. An interesting feature to emerge from this analysis, however, is that all of the data set required a double exponential model for optimal fitting. This suggests that KRAS membrane reorientation involves two processes: a faster process occurring at the rate k = ~4 × 10⁷ s−1 and an order-of-magnitude slower process occurring at k = ~5 × 10⁶ s−1. Close to 90% of the reorientation process involved the faster “reaction” that we attribute to the intrinsic dynamics of the protein, as described above. The slower process, on the other hand, is likely attributable to the transient interactions of the G-domain with lipids. This interpretation can be directly tested using simulations in different lipid compositions and recalculating the relative contribution of the two processes under conditions that stabilize or destabilize protein–lipid interactions.
Figure 6.
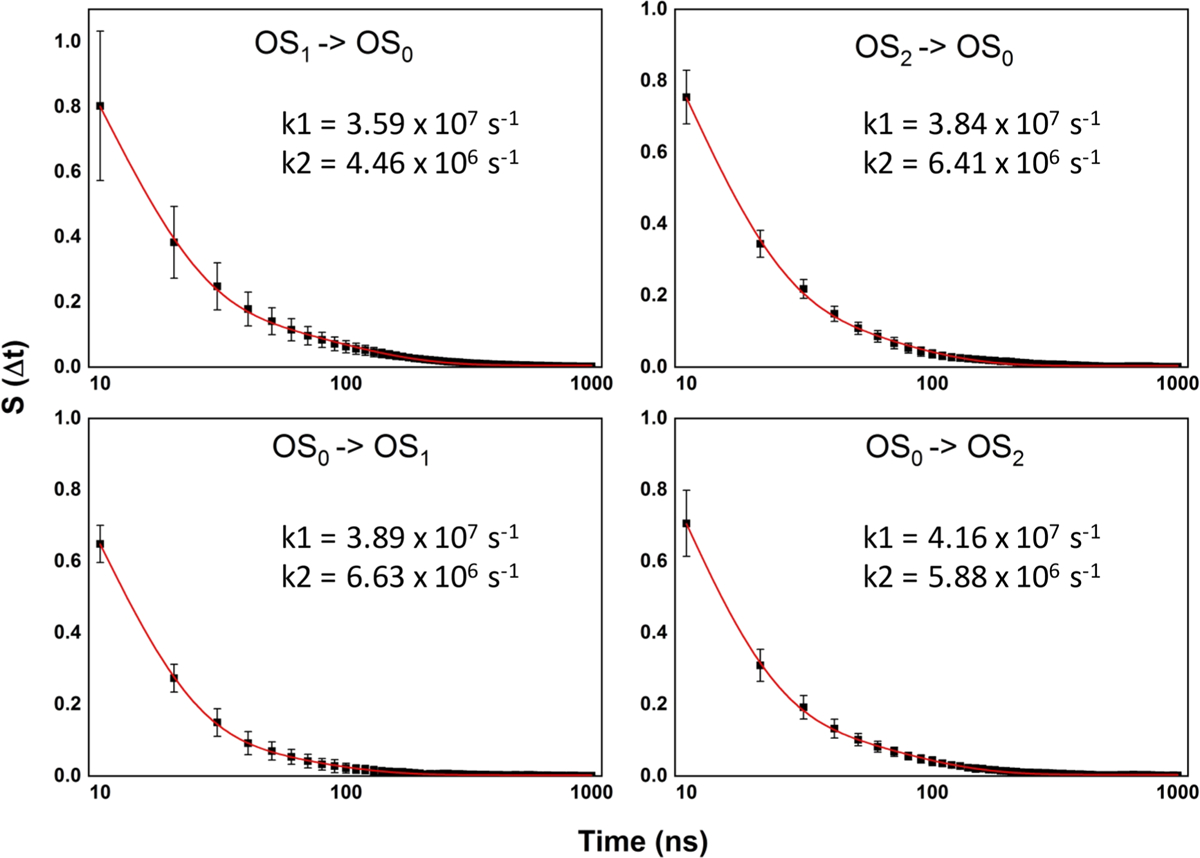
Kinetics of G12D KRAS membrane reorientation. Survival probabilities, S(Δt), and the resulting rates of transition from orientation state OS1 to the intermediate orientation OS0 (top left), OS0 to OS1 (bottom left), OS2 to OS0 (top right) and OS0 to OS2 (bottom right). The sampling frequency was 10 ns (i.e., a state was defined to exist if its minimum residence time is 10 ns). S(Δt) was calculated as described in the text and the curves were fit to a double exponential decay function of the form: S(Δt) = (A1−Δt/τ1) + (A2−Δt/τ2) + y0. The sliding window approach was used to calculate the error at each Δt.
We used eq 2 and the estimated rate constants along with a pre-exponential factor A = 106 s−1 (ref 44 and references therein) to estimate the energy barriers to the interstate transitions (ΔG#,orient)
| (2) |
and obtained ΔG#,orient ≈ 1–1.5 kcal/mol for the various transitions. These values are in good agreement with the barriers estimated from the free-energy surface in Figure 4. However, we would like to note that the calculated rates are likely an overestimate and the barriers of 0.5–2 kBT likely an underestimate. This is because the CHARMM36m force field used in this work appears to enhance KRAS dynamics when compared to the CHARMM3610 or CHARMM2711 force fields.
Impact of Oncogenic Mutations on Membrane Orientation Dynamics.
A previous study found that selected oncogenic and RASopathy mutations modulate the membrane orientation dynamics of KRAS.17 To test if a switch 2 (residues 57–75) oncogenic mutation may similarly modulate the orientation dynamics relative to the P-loop mutant G12D, we simulated Q61H KRAS under identical conditions as G12D. The key results are summarized in Figures 2 and 3. Briefly, we find that G12D and Q61H undergo similar orientational dynamics and interconvert between OS1 and OS2 via the intermediate orientation OS0. In both cases, the occluded OS2 is sampled less frequently than OS1 or OS0. A quantitative comparison of G12D and Q61H further indicate that the combined population of OS1 and OS0, in which the switch loops are available for effector interaction, is significantly larger (77% and 69%) than the occluded OS2 (19 and 17%). A previous MD and smFRET analysis of a different P-loop mutant, G12V, arrived at a similar conclusion.10 That all three mutants predominantly sample signaling competent conformations makes intuitive sense since they are constitutively active. It is also consistent, albeit indirectly, with previous experiments showing that oncogenic mutations increase the active RAS fraction by an order of magnitude.45
Despite the broad similarities described above, there are also subtle but potentially important differences among G12D, G12V, and Q61H: (1) Much fewer interstate transition events were observed in a 20 μs MD run of G12V compared to both G12D and Q61H. In this regard, therefore, G12D shares more similarity to Q61H than G12V. (2) While Q61H and G12D sampled OS2 to a similar extent, OS1 is more populated in the latter (46%) than the former (31%), whereas the intermediate state OS0 is sampled more in Q61H (50%) than G12D (37%). This suggests that, compared with the switch 2 charge-preserving Q61H mutation, the P-loop G12D mutant that introduces a negative charge in the effector-interacting lobe1 stabilized a state in which the C-terminal lobe2 interacts with membrane. (3) We also observed a single event of a long-lived orientation in G12D that resembles a dominant orientation in GTP-bound H-RAS observed in previous simulations;16 this conformation was rarely seen in G12V or Q61H. (4) There are also notable differences in the distributions of ζ and cos(Θ) (Figure 2), suggesting differences in the preferred distances and angles of the catalytic domain from the membrane plane. Similarly, there are significant differences between G12D and Q61H when analyzed by other reaction coordinates (Figure 3). Combining these observations, we conclude that the P-loop and switch 2 KRAS mutants examined here fluctuate between the same set of orientation states but differ in the details. These differences may be enhanced or dampened upon changes in experimental conditions, lipid compositions, or post-translational modification such as acetylation or ubiquitination.
CONCLUSION
Membrane orientation can act as a regulator of function by modulating the accessibility of functionally important surface loops and binding sites to partner proteins or ligands. However, the link between structure and thermodynamics of the process has been lacking. Using data from two long-time scale atomistic MD simulations conducted on G12D and Q61H KRAS, the current work provided a quantitative picture of membrane reorientation that goes beyond structure. A detailed analysis of the trajectories has been conducted using various reaction coordinates. This included examination of the membrane orientation free energy surface, the rates of transition between the major orientation states, and the dynamics of the two KRAS mutants within each orientation state. We found similar orientational dynamics among the mutants studied in this work as well as the G12V mutant analyzed in a previous report.10 All fluctuate between the two most stable orientations OS1 and OS2 via the dynamic intermediate orientation OS0, as schematically summarized in Figure 7. And all three mutants favor the signaling competent OS1 and OS0 orientations over the occluded OS2. However, we also found notable differences with regard to preferences for specific conformations and the extent to which they sample a specific orientation state or substate. For example, G12D samples OS1 more frequently than Q61H. These differences suggest differential capacities to interact with partner proteins or ligands, which may aid in efforts to search for novel anti-RAS drugs. We have shown that the free energy surface of KRAS membrane reorientation is rugged, and that there are at least two substates in each major orientation state. The substates are nearly iso-energetic and differ only by ~0.5–1.0 kcal/mol in stability, although these values may vary with force field and other simulation conditions. Transitions between OS1 and OS2 occur via two well-defined pathways involving a set of conformational changes and relatively small energy barriers. The estimated rate constants for the various transitions are similar and lie in the order of 107 s−1 for the faster process and 106 s−1 for the slower process. We attribute the dominant faster rate to protein conformational dynamics that drives the reorientation process, and the slower one to dynamic protein–lipid interactions although this requires further scrutiny. We believe these observations are likely applicable to other RAS mutants and isoforms and more broadly members of the RAS family.
Figure 7.
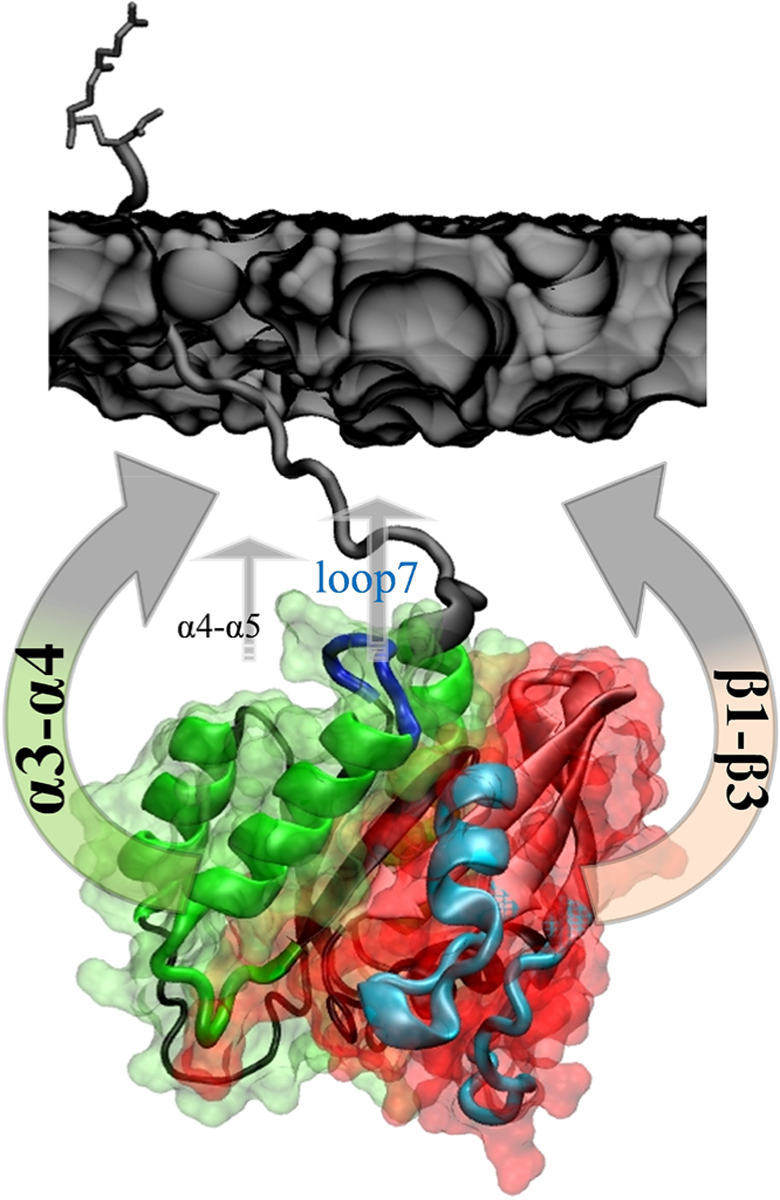
Schematic summary of KRAS membrane orientation dynamics. The arrows highlight four key surface patches of the catalytic domain (labeled) that make dynamic contacts with membrane (dark gray surface). The thickness of the arrows highlights the relative frequency of bilayer contact observed during the time scale of the current MD simulations. Interactions via α4/α5 in OS1 and loop7/switch 2 in OS0 are less frequent. Lobe1 and lobe2 are shown as red and green surfaces, switches 1 and 2 are colored cyan, helices 3 and 4 are in green, and loop7 is in blue.
Supplementary Material
ACKNOWLEDGMENTS
This work was supported by grants from the National Institutes of Health (Grant No. R01GM124233) and the Cancer Prevention and Research Institute of Texas (CPRIT Grant No. DP150093). The simulations were conducted on the Anton 2 (Award No. PSCA16072P). Anton 2 computer time was provided by the Pittsburgh Supercomputing Center (PSC) through Grant R01GM116961 from the National Institutes of Health. The Anton 2 machine at PSC was generously made available by D. E. Shaw Research. We thank the Texas Advanced Computing Center (TACC) and the Extreme Science and Engineering Discovery Environment (XSEDE Grant No. MCB150054) for additional computational resources. We are grateful to Prof. Donald Hamelberg from Georgia State University for stimulating discussions and very helpful suggestions.
Footnotes
Supporting Information
The Supporting Information is available free of charge on the ACS Publications website at DOI: 10.1021/acs.jpcb.9b05796.
Distribution of ζ and cos(Θ) for the first- and second-halves of 20 μs MD simulations of membrane-bound G12D and Q61H (PDF)
The authors declare no competing financial interest.
REFERENCES
- (1).Vetter IR; Wittinghofer A The guanine nucleotide-binding switch in three dimensions. Science 2001, 294 (5545), 1299–1304. [DOI] [PubMed] [Google Scholar]
- (2).Wittinghofer A; Vetter IR Structure-function relationships of the G domain, a canonical switch motif. Annu. Rev. Biochem 2011, 80, 943–71. [DOI] [PubMed] [Google Scholar]
- (3).Bos JL Ras oncogenes in human cancer: a review. Cancer Res. 1989, 49 (17), 4682–4689. [PubMed] [Google Scholar]
- (4).Karnoub AE; Weinberg RA Ras oncogenes: split personalities. Nat. Rev. Mol. Cell Biol. 2008, 9 (7), 517–531. [DOI] [PMC free article] [PubMed] [Google Scholar]
- (5).Cox AD; Der CJ Ras history: The saga continues. Small GTPases 2010, 1 (1), 2–27. [DOI] [PMC free article] [PubMed] [Google Scholar]
- (6).Prior IA; Lewis PD; Mattos C A comprehensive survey of Ras mutations in cancer. Cancer Res. 2012, 72 (10), 2457–2467. [DOI] [PMC free article] [PubMed] [Google Scholar]
- (7).Bryant KL; Mancias JD; Kimmelman AC; Der CJ KRAS: feeding pancreatic cancer proliferation. Trends Biochem. Sci 2014, 39 (2), 91–100. [DOI] [PMC free article] [PubMed] [Google Scholar]
- (8).Stephen AG; Esposito D; Bagni RK; McCormick F Dragging Ras back in the ring. Cancer Cell 2014, 25 (3), 272–281. [DOI] [PubMed] [Google Scholar]
- (9).Gorfe AA; Grant BJ; McCammon JA Mapping the nucleotide and isoform-dependent structural and dynamical features of Ras proteins. Structure 2008, 16 (6), 885–896. [DOI] [PMC free article] [PubMed] [Google Scholar]
- (10).Prakash P; Litwin D; Liang H; Sarkar-Banerjee S; Dolino D; Zhou Y; Hancock JF; Jayaraman V; Gorfe AA Dynamics of membrane-bound G12V-KRAS from simulations and single-molecule FRET in native nanodiscs. Biophys. J 2019, 116 (2), 179–183. [DOI] [PMC free article] [PubMed] [Google Scholar]
- (11).Prakash P; Zhou Y; Liang H; Hancock JF; Gorfe AA Oncogenic K-Ras binds to an anionic membrane in two distinct orientations: a molecular dynamics analysis. Biophys. J 2016, 110 (5), 1125–1138. [DOI] [PMC free article] [PubMed] [Google Scholar]
- (12).Prakash P; Gorfe AA Membrane orientation dynamics of lipid-modified small GTPases. Small GTPases 2017, 8, 129–138. [DOI] [PMC free article] [PubMed] [Google Scholar]
- (13).Gorfe AA Mechanisms of allostery and membrane attachment in Ras GTPases: implications for anti-cancer drug discovery. Curr. Med. Chem 2010, 17 (1), 1–9. [DOI] [PubMed] [Google Scholar]
- (14).Abankwa D; Gorfe AA; Hancock JF Mechanisms of Ras membrane organization and signalling: Ras on a rocker. Cell Cycle 2008, 7 (17), 2667–2673. [DOI] [PMC free article] [PubMed] [Google Scholar]
- (15).Abankwa D; Hanzal-Bayer M; Ariotti N; Plowman SJ; Gorfe AA; Parton RG; McCammon JA; Hancock JF A novel switch region regulates H-ras membrane orientation and signal output. EMBO J. 2008, 27 (5), 727–735. [DOI] [PMC free article] [PubMed] [Google Scholar]
- (16).Gorfe AA; Hanzal-Bayer M; Abankwa D; Hancock JF; McCammon JA Structure and dynamics of the full-length lipid-modified H-Ras protein in a 1,2-dimyristoylglycero-3-phosphocholine bilayer. J. Med. Chem 2007, 50 (4), 674–684. [DOI] [PubMed] [Google Scholar]
- (17).Mazhab-Jafari MT; Marshall CB; Smith MJ; Gasmi-Seabrook GM; Stathopulos PB; Inagaki F; Kay LE; Neel BG; Ikura M Oncogenic and RASopathy-associated K-RAS mutations relieve membrane-dependent occlusion of the effector-binding site. Proc. Natl. Acad. Sci. U. S. A 2015, 112 (21), 6625–6630. [DOI] [PMC free article] [PubMed] [Google Scholar]
- (18).Kapoor S; Weise K; Erlkamp M; Triola G; Waldmann H; Winter R The role of G-domain orientation and nucleotide state on the Ras isoform-specific membrane interaction. Eur. Biophys. J 2012, 41 (10), 801–813. [DOI] [PubMed] [Google Scholar]
- (19).Kapoor S; Triola G; Vetter IR; Erlkamp M; Waldmann H; Winter R Revealing conformational substates of lipidated N-Ras protein by pressure modulation. Proc. Natl. Acad. Sci. U. S. A 2012, 109 (2), 460–465. [DOI] [PMC free article] [PubMed] [Google Scholar]
- (20).Abankwa D; Gorfe AA; Inder K; Hancock JF Ras membrane orientation and nanodomain localization generate isoform diversity. Proc. Natl. Acad. Sci. U. S. A 2010, 107 (3), 1130–1135. [DOI] [PMC free article] [PubMed] [Google Scholar]
- (21).Abankwa D; Gorfe AA; Hancock JF Ras nanoclusters: molecular structure and assembly. Semin. Cell Dev. Biol 2007, 18 (5), 599–607. [DOI] [PMC free article] [PubMed] [Google Scholar]
- (22).Prakash P; Gorfe AA Lessons from computer simulations of Ras proteins in solution and in membrane. Biochim. Biophys. Acta, Gen. Subj 2013, 1830 (11), 5211–5218. [DOI] [PMC free article] [PubMed] [Google Scholar]
- (23).Prakash P; Sayyed-Ahmad A; Gorfe AA pMD-membrane: a method for ligand binding site identification in membrane-bound proteins. PLoS Comput. Biol 2015, 11 (10), e1004469. [DOI] [PMC free article] [PubMed] [Google Scholar]
- (24).Sayyed-Ahmad A; Gorfe AA Mixed-Probe Simulation and Probe-Derived Surface Topography Map Analysis for Ligand Binding Site Identification. J. Chem. Theory Comput 2017, 13 (4), 1851–1861. [DOI] [PMC free article] [PubMed] [Google Scholar]
- (25).Jansen JM; Wartchow C; Jahnke W; Fong S; Tsang T; Pfister K; Zavorotinskaya T; Bussiere D; Cheng JM; Crawford.; et al. Inhibition of prenylated KRAS in a lipid environment. PLoS One 2017, 12 (4), e0174706. [DOI] [PMC free article] [PubMed] [Google Scholar]
- (26).Fang Z; Marshall CB; Nishikawa T; Gossert AD; Jansen JM; Jahnke W; Ikura M Inhibition of K-RAS4B by a unique mechanism of action: stabilizing membrane-dependent occlusion of the effector-binding site. Cell Chem. Biol 2018, 25 (11), 1327–1336. [DOI] [PubMed] [Google Scholar]
- (27).Cao S; Chung S; Kim S; Li Z; Manor D; Buck M K-Ras G-domain binding with signaling lipid phosphatidylinositol (4,5)-phosphate (PIP2): membrane association, protein orientation, and function. J. Biol. Chem 2019, 294 (17), 7068–7084. [DOI] [PMC free article] [PubMed] [Google Scholar]
- (28).Gregory MC; McLean MA; Sligar SG Interaction of KRas4b with anionic membranes: a special role for PIP2. Biochem. Biophys. Res. Commun 2017, 487 (2), 351–355. [DOI] [PMC free article] [PubMed] [Google Scholar]
- (29).Bos JL; Rehmann H; Wittinghofer A GEFs and GAPs: critical elements in the control of small G proteins. Cell 2007, 129(5), 865–877. [DOI] [PubMed] [Google Scholar]
- (30).Shaw DE; Dror RO; Salmon JK; Grossman JP; Mackenzie KM; Bank JA; Young C; Deneroff MM; Batson B; Bowers KJ Millisecond-scale molecular dynamics simulations on Anton. the Conference SC ‘09 2009, 1–11. [Google Scholar]
- (31).Huang J; Rauscher S; Nawrocki G; Ran T; Feig M; de Groot BL; Grubmuller H; MacKerell AD Jr. CHARMM36m: an improved force field for folded and intrinsically disordered proteins. Nat. Methods 2017, 14 (1), 71–73. [DOI] [PMC free article] [PubMed] [Google Scholar]
- (32).Klauda JB; Venable RM; Freites JA; O’Connor JW; Tobias DJ; Mondragon-Ramirez C; Vorobyov I; MacKerell AD Jr.; Pastor RW Update of the CHARMM all-atom additive force field for lipids: validation on six lipid types. J. Phys. Chem. B 2010, 114(23), 7830–7843. [DOI] [PMC free article] [PubMed] [Google Scholar]
- (33).Zhou Y; Prakash P; Liang H; Cho KJ; Gorfe AA; Hancock JF Lipid-sorting specificity encoded in K-Ras membrane anchor regulates signal output. Cell 2017, 168 (1–2), 239–251.e16. [DOI] [PMC free article] [PubMed] [Google Scholar]
- (34).Sarkar-Banerjee S; Sayyed-Ahmad A; Prakash P; Cho KJ; Waxham MN; Hancock JF; Gorfe AA Spatiotemporal analysis of K-Ras plasma membrane interactions reveals multiple high order homo-oligomeric complexes. J. Am. Chem. Soc 2017, 139 (38), 13466–13475. [DOI] [PMC free article] [PubMed] [Google Scholar]
- (35).Janosi L; Gorfe AA Segregation of negatively charged phospholipids by the polycationic and farnesylated membrane anchor of Kras. Biophys. J 2010, 99 (11), 3666–3674. [DOI] [PMC free article] [PubMed] [Google Scholar]
- (36).Janosi L; Gorfe AA Simulating POPC and POPC/POPG Bilayers: Conserved Packing and Altered Surface Reactivity. J. Chem. Theory Comput. 2010, 6 (10), 3267–3273. [DOI] [PubMed] [Google Scholar]
- (37).Li H; Gorfe AA Aggregation of lipid-anchored full-length H-Ras in lipid bilayers: simulations with the MARTINI force field. PLoS One 2013, 8 (7), e71018. [DOI] [PMC free article] [PubMed] [Google Scholar]
- (38).Prakash P; Hancock JF; Gorfe AA Binding hotspots on K-ras: consensus ligand binding sites and other reactive regions from probe-based molecular dynamics analysis. Proteins: Struct., Funct., Genet. 2015, 83 (5), 898–909. [DOI] [PMC free article] [PubMed] [Google Scholar]
- (39).Prakash P; Sayyed-Ahmad A; Cho K-J; Hancock JF; Gorfe AA; et al. Computational and biochemical characterization of two partially overlapping interfaces and multiple weak-affinity K-Ras dimers. Sci. Rep 2017, 7, e40109. [DOI] [PMC free article] [PubMed] [Google Scholar]
- (40).Sayyed-Ahmad A; Cho KJ; Hancock JF; Gorfe AA Computational equilibrium thermodynamic and kinetic analysis of K-Ras dimerization through an effector binding surface suggests limited functional role. J. Phys. Chem. B 2016, 120 (33), 8547–8556. [DOI] [PMC free article] [PubMed] [Google Scholar]
- (41).Xin Y; Doshi U; Hamelberg D Examining the limits of time reweighting and Kramers’ rate theory to obtain correct kinetics from accelerated molecular dynamics. J. Chem. Phys 2010, 132 (22), 224101. [DOI] [PubMed] [Google Scholar]
- (42).Yeh IC; Hummer G Peptide loop-closure kinetics from microsecond molecular dynamics simulations in explicit solvent. J. Am. Chem. Soc 2002, 124 (23), 6563–6568. [DOI] [PubMed] [Google Scholar]
- (43).Neale C; Garcia AE Methionine 170 is an environmentally sensitive membrane anchor in the disordered HVR of K-Ras4B. J. Phys. Chem. B 2018, 122 (44), 10086–10096. [DOI] [PubMed] [Google Scholar]
- (44).Schuler B; Lipman EA; Eaton WA Probing the free-energy surface for protein folding with single-molecule fluorescence spectroscopy. Nature 2002, 419 (6908), 743–7. [DOI] [PubMed] [Google Scholar]
- (45).Lee HW; Kyung T; Yoo J; Kim T; Chung C; Ryu JY; Lee H; Park K; Lee S; Jones WD; et al. Real-time single-molecule co-immunoprecipitation analyses reveal cancer-specific Ras signalling dynamics. Nat. Commun 2013, 4, 1505. [DOI] [PMC free article] [PubMed] [Google Scholar]
Associated Data
This section collects any data citations, data availability statements, or supplementary materials included in this article.


