

Abstract
Reducing the echo time of magnetic resonance spectroscopy experiments is appealing because it increases the available signal and reduces J-evolution of coupled metabolites. In this manuscript a novel sequence, referred to as Ultrashort echo TimE, SPin ECho, full Intensity Acquired Localized (UTE-SPECIAL), is described which is able to achieve ultrashort echo times (4 ms) on a standard clinical 3T MR system while recovering the entirety of the available magnetization. UTE-SPECIAL obtains full 3D spatial localization through a 2D adiabatic inversion pulse which is cycled “on” and “off” every other repetition, in combination with a slice-selective excitation pulse. In addition to an ultrashort echo time, UTE-SPECIAL has negligible chemical shift displacement artefact and, because it uses no slice-selective refocusing pulse, has no signal cancellation at the borders for J-coupled metabolites. Spectra with an ultrashort echo time of 4 ms are demonstrated in vivo at 3T, as well as J-resolved spectra obtained in a phantom and a healthy volunteer.
Keywords: In Vivo Magnetic Resonance Spectroscopy, SPECIAL, Ultrashort TE MRS, J-coupling
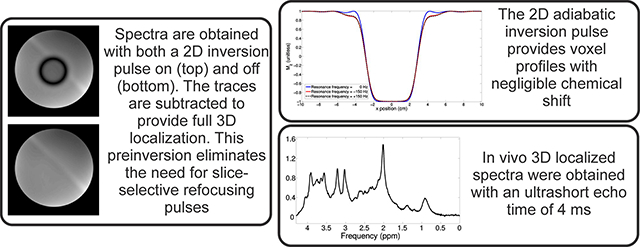
Graphical Abstract
Introduction
Spatial localization in single voxel magnetic resonance spectroscopy (MRS) is typically obtained through the intersection of three or more slice-selective bands1. Spatial localization comes at the cost of a non-zero minimum allowable echo time, which varies depending on the particular sequence of choice. Minimizing the echo time is appealing for a variety of reasons. Firstly, it reduces the J-evolution of coupled metabolites. Secondly, there is increased signal-to-noise ratio (SNR) due to lessened T2 relaxation. Lastly, absolute quantification requires knowledge of the T2 value for all metabolites, which are not typically measured but taken from the literature2. The larger the echo time the greater the introduced uncertainty due to imperfect knowledge of the true T2 values. Reducing the echo time is particularly beneficial for measuring chemical compounds with short T2, for instance macromolecules. Short echo time is also important for J-resolved methods such as JPRESS3–5, as a range of echo times must be spread and the utilization of high SNR short echo times can replace long echo times for which SNR is low. MRS localization methods also have other important sequence-specific characteristics1, such as chemical shift displacement error (CSDE), sensitivity to B1 inhomogeneity (i.e., the utilization of adiabatic pulses6 or not), and anomalous J-modulation7 (i.e., signal cancellation from the borders of the voxel for J-coupled metabolites).
It was recently recommended in a consensus paper to use the shortest TE achievable for general-purpose spectroscopy8. To date, STimulated Acquisiton Mode9 (STEAM) has achieved the shortest minimum echo time for any single-shot 3D localized technique, with echo times as low as 1 ms in the rat brain on a pre-clinical scanner10 and 4–6 ms in the human brain11–13. Although STEAM is appealing due to its very short minimum echo time, it has the major drawback of only refocusing approximately ½ of the signal, which poses a major limitation for MRS due to its inherently low SNR. To obtain both a short echo time and full signal recovery a sequence referred to as SPin ECho, full Intensity Acquired Localized14 (SPECIAL) was developed. SPECIAL is a hybrid of Image-Selected In vivo Spectroscopy15 (ISIS) and Point RESolved Spectroscopy16 (PRESS). Conventional SPECIAL obtains spatial localization in one dimension through a pre-inversion pulse (the “ISIS dimension”), and in the other two dimensions through a slice-selective excitation and a slice-selective refocusing pulse. To the best of the authors’ knowledge the shortest echo time achieved with full signal intensity is TE = 3.5 ms with SPECIAL on a clinical scanner, although the typically used echo time was TE = 6.0 ms17. Although SPECIAL provides a very short echo time it still employs a slice-selective refocusing pulse in a single spatial dimension, which introduces anomalous J-modulation1,7 and CSDE. As such SPin ECho, full Intensity Acquired Localized semi-Localization by Adiabatic SElective Refocusing14 (SPECIAL-sLASER) was developed which replaced the amplitude-modulated 180° refocusing pulse with an adiabatic refocusing pulse pair, which reduces B1 sensitivity, anomalous J-modulation and CSDE, but comes at the cost of a minimum TE of 19 ms at 3T18.
In this manuscript a novel method was developed19, referred to as Ultrashort echo TimE SPECIAL (UTE-SPECIAL). UTE-SPECIAL provides adiabatic localization in two of the three spatial dimensions, an ultrashort minimum echo time of 4 ms on a clinical 3T scanner, minimal CSDE while completely avoiding anomalous J-modulation. This method is similar to conventional SPECIAL, in that it is a two-shot technique, however UTE-SPECIAL obtains spatial localization via preinversion (the so-called “ISIS dimensions”) in two spatial dimensions, and the localization in the third dimension is achieved through a slice-selective excitation pulse, and thus uses no slice-selective refocusing pulses. UTE-SPECIAL can be used for improved estimation of coupled spin systems or to leverage the ultrashort minimum echo time to allow for longer editing pulses thereby increasing spectral selectivity for J-difference editing experiments, for instance, of γ-aminobutyric acid20, glutathione21 or 2-hydroxyglutarate22. Here we demonstrate the efficacy of UTE-SPECIAL in healthy volunteers, and obtain three-dimensionally localized spectra with an echo time of 4 ms.
Methods
The UTE-SPECIAL sequence operates by employing a two-dimensional selective adiabatic inversion pulse23 followed by a slice-selective excitation pulse and a hard refocusing pulse (Figure 1). The 2D inversion pulse consists of 30 spiral jinc subpulses with 5-turn spiral, and the amplitude and phases of the consecutive subpulses are modulated according to a hyperbolic secant envelope24 with a total duration of 40 ms and a center frequency of 2.7 ppm. The peak amplitude of the 2D inversion pulse was 550 Hz (12.9 μT), which was verified through a Bloch simulation to be sufficient to be within the adiabatic regime. Increasing the RF amplitude provides an increasingly sharp spatial and spectral profile, however side bands also become more pronounced, thus this value was chosen as an adequate tradeoff. The 2D inversion pulse is toggled “on” and “off” (i.e., the amplitude is set to zero) every other TR and the acquired traces from the two cycles are subtracted to provide full three-dimensional localization, similar to SPECIAL. The voxel can be arbitrarily positioned in space by adjusting the phase profile of the 2D inversion pulse and the offset frequency of the excitation pulse. The 2D inversion pulse provides >99% inversion over 2.0 to 4.0 ppm and >97% inversion over 1.0 to 4.5 ppm (Figure 2a). The excitation pulse was a minimum phase Shinnar-Le Roux25 (SLR) pulse with a duration of 1.80 ms and a bandwidth of 2300 Hz. A rectangular pulse was used for the refocusing pulse to minimize the echo time, at the cost of the frequency-dependent inversion profile. The hard refocusing pulse had a duration of 600 μs, amplitude of 833 Hz (19.6 μT), and provided >95% inversion over 2.0 to 4.0 ppm, and >80% inversion over 1.0 to 5.0 (Figure 2b). This refocusing pulse, although not strictly necessary, eliminates the need for a first-order phase correction and enables the sequence to have arbitrary echo times. An optimized crusher and 32-step cogwheel phase cycling scheme26 were designed with Dephasing Optimization Through Coherence Order Pathway Selection27,28 (DOTCOPS) and implemented to minimize the effects of spurious echoes.
Figure 1:

Pulse sequence for UTE-SPECIAL. VAPOR and OVS in all three spatial dimensions are applied prior to the 2D adiabatic inversion pulse (dotted blue box). The 2D adiabatic inversion pulse is cycled “on” and “off” (i.e., the amplitude is set to zero) every other TR, and the signal from the two cycles are subtracted to provide full 3D spatial localization. An additional OVS module in the same dimensions as the 2D inversion pulse is applied in between the 2D inversion pulse and the excitation pulse. The hatched gradients are crushers and the rephase gradient is giving in grey which has its area subtracted from the crusher immediately following the excitation pulse. A non-selective rectangular refocusing pulse is employed to provide a spin echo, thereby enabling the measurement of arbitrary echo time spectra. Optimized crushers and a cogwheel phase cycling scheme were used to minimize the effects of spurious echoes. To obtain J-resolved spectra 100 echo times were acquired by incrementing the time prior to the refocusing pulse by 1 ms (i.e., 2 ms steps with maximum echo sampling).
Figure 2:

Inversion profile of the 2D adiabatic pulse, a), and rectangular refocusing pulse, b) at the center of the voxel obtained via Bloch simulation. The 2D inversion pulse obtains >99% inversion over the range of 2.0 to 4.0 ppm, and the rectangular pulse provides >95%. The center frequency of the rectangular pulse is about creatine (3.0 ppm), whereas the 2D inversion pulse was slightly shifted upfield to 2.7 ppm to provide greater inversion over the macromolecule region.
All experiments were performed at the New York State Psychiatric Institute (NYSPI) on a Signa Premier MRI system (GE Healthcare, WI, USA) with a standard 48-channel RF head coil. All spectra were acquired with a TR of 2.0 s, 64 excitations and a cylindrical voxel with size of 5.8 × 5.8 × 2.0 cm3 (5.8 cm diameter in the inversion dimensions), and used VAPOR10 for water suppression, as well as outer-volume suppression (OVS) for additional sideband suppression. A water reference was acquired with identical parameters but setting VAPOR pulse amplitudes to zero and shifting the 2D adiabatic pulse to be centered about water for coil-weighting and eddy current correction29. The phantom experiments were performed on the GE MRS “braino” phantom30 which contains 12.5 mM N-Acetyl-L-aspartic acid, 10.0 mM creatine hydrate, 3.0 mM choline chloride, 7.5 mM myo-inositol, 12.5 mM L-Glutamic acid and 5.0 mM DL-lactic acid.
A total of 7 male subjects were scanned, with multiple experiments being performed in some subjects. All subjects provided free and informed consent and all studies were approved by the Institutional Review Board at Columbia University. Voxels were placed in either the frontal or parietal lobe. A representative voxel placed in the parietal lobe is shown in Figure 3. J-resolved spectra were acquired with 100 echo times with 2 ms steps and maximum-echo sampling3, with 8 excitations per echo time and an 4-step optimized cogwheel phase cycling scheme. Linear combination modeling quantification was performed with INSPECTOR31 using a basis set simulated with MAgnetic Resonance Spectrum Simulator32 (MARSS) that utilized realistic RF pulses, gradients and timings. Concentrations were calculated assuming a total creatine concentration of 8.0 mmol/kg17, and because quantification was to demonstrate consistency no corrections for relaxation were performed.
Figure 3:

Sagittal, a), and coronal, b), anatomical images of a subject with voxel placed in parietal lobe overlaid. The projection of the cylindrical voxel onto these planes appears as a rectangle.
To demonstrate reproducibility three subjects were scanned four times to test the both inter- and intra-session repeatability with voxels being placed in the parietal lobes. In between all sessions the voxels were autoprescanned (i.e., tuning of the center frequency, transmit/receive gain and shimmed). For inter-session scans the subject was removed from the magnet bore and the voxel was repositioned.
Images of the voxel were made by increasing the echo time to 40 ms and appending a phase-encode and frequency-encode module to the sequence, as well as reducing the TR to 1.5 s and turning the VAPOR water suppression pulses off. Images of both the “on” and, for comparison, the “off” conditions were acquired in both a phantom and in vivo. Hankel Lanczos singular value decomposition (HLSVD) was used for post-acquisition water removal.
Results
Bloch simulation of the 2D adiabatic inversion pulse demonstrates the high uniformity within the voxel with minimal sidebands (Figure 4 a), aside from large side bands at about 25 cm distance radially from the center of the voxel, which are outside the subject’s head for all volunteers. This was similarly demonstrated experimentally by imaging the voxel for both the “on” condition in a phantom (Figure 4 b/d) and in vivo (Figure 4 f). Small side bands can be observed closer to the voxel (Figure 4 a and Figure 5); however, they were further suppressed by the use of OVS bands surrounding the voxel (Figure 4 d–g). It is worth mentioning that some decrease in amplitude can be observed in the in vivo “on” conditions over the in vivo “off” conditions due to relaxation losses, which can be explained/corrected for, as explored in the discussion. These images also demonstrate the ability to place the voxel arbitrarily in space. In addition to the Bloch simulations it was verified with MARSS that the inversion pulse inverted coupled spin systems. Due to the subpulses being of very short duration (and thus high bandwidth) there is negligible CSDE in these two spatial dimensions, although some distortion of voxel profile as a function of spectral frequency can be observed (Figure 5), which is consistent with other adiabatic pulses33.
Figure 4:

Bloch simulation of voxel inversion profile in two spatial dimensions, a), as well as images obtained with the 2D inversion pulse on, b), d) and f) and the 2D inversion pulse off, c), e) and g). Outer-volume suppression was used in images d), e), f) and g), whereas it was not used for b) and c). The images obtained in b), c) d) and e) were obtained in GE’s braino phantom, whereas the images obtained in f) and g) were obtained in a healthy volunteer. To generate images, the echo time was increased to 40 ms to accommodate the gradient read out for imaging purposes, and the repetition time was 1500 ms; no water suppression was employed. High uniformity across the voxel can be observed, however it is worth mentioning that some decrease in amplitude can be observed in the “on” conditions compared to the corresponding “off” conditions, which can be explained due to relaxation losses as explored in the discussion.
Figure 5:

Voxel profile simulated from Bloch equations along x for three different resonance frequencies: 0 Hz (resonance frequency equal to the center frequency of the 2D inversion pulse) and ± 150 Hz from the center frequency corresponding to ± 1.2 ppm offset at 3T. Negligible chemical shift displacement error can be observed due to the short duration of the sub pulses, however there is some spatial distortion of the voxel profile comparing the resonance frequency of 0 Hz to ± 150 Hz. The 0 Hz profile is identical to a line through the 2D profile shown in Figure 4 a.
High spectral quality was demonstrated in all volunteers (Figure 6), however large macromolecule signals can be observed in all volunteers, particularly for Experiment 2. This is not, however, believed to be artefactual, as subjects do not demonstrate any spurious echoes in the macromolecule region, as evident by the lack of increased deviation in this region. Experiment 6, however, did suffer from poor water suppression which lead to spurious echoes near the shoulder of water, but this was effectively removed via phase cycling. High quality fits were obtained, with a representative fit shown in Figure 7, indicating that the increased macromolecule signals can be well modeled by known macromolecule resonances34. The mean ( ± standard deviation) concentrations over the 8 voxels shown in Figure 6 were measured to be 3.10 ± 0.29 mmol/kg, 2.74 ± 0.34 mmol/kg, 7.63 ± 0.82 mmol/kg, 10.56 ± 1.40 mmol/kg and 4.87 ± 0.56 mmol/kg, for total choline (tCh), glutathione (GSH), glutamate + glutamine (Glx), N-acetylaspartic acid (NAA) and myo-inositol (mI), respectively. The J-resolved experiment demonstrated well-maintained cross peaks (Figure 8) due to the lack of anomalous J-modulation particularly observable by the lack of unresolved (i.e., along the f1 = 0 Hz line) spectral peaks of lactate at 1.3 ppm.
Figure 6:

Spectra obtained from five different healthy volunteers with TE = 4 ms. Voxels were placed in the parietal lobe or frontal lobe. The voxel in the frontal lobe of volunteer 4 demonstrated spurious echoes in individual spatially localized traces (particularly noticeable near the should of water), however these were rectified by phase cycling.
Figure 7:

Representative linear combination modeling fit from the parietal lobe of volunteer 5 shown in Figure 6.
Figure 8:

J-resolved spectra measured in “braino” metabolite phantom, a), and parietal lobe of healthy volunteer, b) as well as the respective 1D projections plotted above. Well-maintained cross peaks can be observed with no anomalous J-modulation, particularly observable by the lack of unresolved (i.e., along the f1 = 0 Hz line) spectral peaks of lactate at 1.3 ppm.
For all scans consistent spectra were observed for the four scans in each of the volunteers for the test-retest experiments, with representative spectra from Test-retest Volunteer 1 shown in Figure 9. Notably, somewhat higher consistency for the within-session test-retest was observed than the between-session test-retest (Table 1). All metabolites are within the typically observed physiological concentrations35.
Figure 9:

Spectra obtained within Test-retest Volunteer 1 to demonstrate repeatability. The dotted black lines indicate the first scan in the session, and the red line indicates the second. Between the two sessions the subject was removed from the scanner and repositioned. Spectra were frequency and phase aligned to one-another.
Table 1:
Measured concentration (mmol/kg) of the 5 quantified metabolites for a test-retest involving three subjects, referenced to an assumed creatine concentration of 8.00 mmol/kg. Subjects were scanned twice within the same session, then removed from the scanner and repositioned. Values reported are the means (± standard deviation) over the two intra-session scans.
| Metabolite | Test-retest Volunteer 1 | Test-retest Volunteer 2 | Test-retest Volunteer 3 | |||
|---|---|---|---|---|---|---|
| Session 1 | Session 2 | Session 1 | Session 2 | Session 1 | Session 2 | |
| tCho | 2.77 ± 0.07 | 2.90 ± 0.14 | 3.42 ± 0.53 | 2.89 ± 0.01 | 2.80 ± 0.10 | 2.48 ± 0.08 |
| GSH | 1.88 ± 0.04 | 1.96 ± 0.07 | 0.67 ± 0.27 | 1.10 ± 0.20 | 1.84 ± 0.06 | 1.74 ± 0.01 |
| Glx | 9.66 ± 0.51 | 10.96 ± 0.25 | 13.03 ± 1.48 | 11.16 ± 0.80 | 11.45 ± 0.89 | 11.47 ± 1.96 |
| NAA | 10.38 ± 0.25 | 10.57 ± 0.31 | 10.29 ± 1.25 | 10.02 ± 0.00 | 10.60 ± 0.60 | 9.47 ± 0.22 |
| ml | 3.55 ± 0.55 | 3.71 ± 0.14 | 6.21 ± 0.58 | 5.42 ± 0.11 | 5.84 ± 0.55 | 4.99 ± 0.17 |
Discussion
A novel double-shot technique was developed which provides full-intensity signal at an echo time as short as 4 ms. The measured spectra were of high quality and although they exhibited strong macromolecule signals it is not believed that they are artefactual, with the exception of possibly volunteer 2 (Figure 6), which may have signal from outside the voxel (scalp). The macromolecule signals do not demonstrate the typical signs of spurious echoes, such as being out of phase with the rest of the spectrum18,27, or large variations between phase cycling steps (Figure 6). These macromolecule signals may be increased due to the relatively long duration of the 2D adiabatic inversion pulse used here (40 ms), which creates a mismatch between the “on” and “off” traces due to relaxation differences. The utilization of parallel transmit methods23 could be used to reduce the duration of the 2D adiabatic inversion pulse, thereby potentially reducing this issue. Alternatively, with knowledge of the macromolecule T1 this effect could be corrected. The measured concentrations of the investigated metabolites are within the physiological range35, and coefficient of variations were below 15% for all measured metabolites.
The large voxel size in the 2D inversion dimensions (5.8 cm diameter radius) is not an inherent limitation of the technique, as the gradients can be scaled to create a voxel of arbitrary radius. The gradient waveforms of the 2D inversion pulse were designed at the maximum allowable slew rate for the system used (200 T/m/s). Thus, although the gradients can be scaled up the excitation k-space trajectory must be redesigned accordingly. For example, by reducing the number of spiral turns from 5 to 4 and increasing the gradient amplitude the voxel size can be reduced to a more typical size of 3.4 cm in diameter (Figure 10), although this results in increased sidelobes. The method is even capable of generating elliptic cylindrical voxels, i.e. non-equal radii along the two dimensions, including rotated versions thereof, and arbitrary planar selection by multiplying the gradient waveforms by a rotation matrix. The latter could be used, for instance, to selectively excite the human brain corresponding to an elliptical outer volume suppression. This could be appealing for spectroscopic imaging to exclude lipid signals from the scalp, which poses a major limitation and requires dedicated hardware to address36. It should also be mentioned that although the gradient waveforms are applied at the maximum slew rate peripheral nerve stimulation (PNS) was not reported for any subjects. The use of head-only gradient systems have been shown to provide slew rates of 500 T/m/s without PNS37, could be further improved to reduce voxel size or improve the profile. If PNS became an issue on systems with higher slew rates it could be alleviated through optimized spiral trajectories designed to minimize PNS38. Furthermore, it was recently demonstrated that for systemic metabolic changes it is superior to utilize a large voxel39 thus for some studies a large voxel does not pose a limitation.
Figure 10:

2D inversion profile with a 4-turn spiral and increased gradient amplitude to reduce the size of the voxel to a more typical diameter of 3.4 cm. This comes at the tradeoff of increased sidelobes as compared to the pulse used in experiments (Figure 4).
The relaxation weighting from the “on” and “off” cycles are not identical, which is also true for SPECIAL. In particular, the signal for the “on” condition of UTE-SPECIAL can be expressed as
| (1) |
where TI is the time from the center of the 2D inversion pulse to the isoflip time of the excitation pulse. The value for TI here was 50 ms, 20 ms due to half the duration of the 2D inversion pulse and 30 ms to accommodate the OVS in the corresponding two spatial dimensions. The signal for the “off” condition can be expressed as
| (2) |
Thus the difference between the “off” and “on” condition does not provide complete constructive interference but cancels the term proportional to . For a T1 of (1530 ± 20) ms in NAA40 this term evaluates to approximately (3.22 ± 0.04)%, which is relatively small, but nevertheless should be corrected. The noticeable amplitude difference in Figure 4 b–g inside the voxel between the “on” and “off” conditions can be explained due to the differences in this relaxation term as well. Using the measured water T1 of the braino phantom of (388 ± 43) ms the ratio of the “off” and “on” signal can be evaluated to , which is in excellent agreement with the calculated value from the images shown in Figure 4 b and c of 1.36 ± 0.02. Similarly for in vivo, using T1 = (1084 ± 45) ms for white matter water41, , which again is in excellent agreement with the calculated value from the images shown in Figure 4 f and g of 1.15 ± 0.01.
It should be mentioned that the short echo time afforded by UTE-SPECIAL can be leveraged in other ways. For example, it could be used to increase diffusion weighting, which would make this particularly appealing for DW-MRS methods5,42; or to increase the duration of the editing pulses for J-difference editing experiments, thereby reducing macromolecular contamination of γ-aminobutyric acid signal, similar to what has previously been achieved with MEGA-SPECIAL43. This method could be modified to investigate short-T2 downfield resonances44 by shifting the frequency window of the 2D-inversion pulse and by swapping the excitation and refocusing pulse for spectrally selective pulses. Additionally, the sequence could be modified by removing the refocusing pulse, which would enable sub-1 ms echo times while still providing 3D spatial localization, at the cost of a linear phase in the resulting spectra. This modification may be particularly appealing for MR spectroscopic imaging. To facilitate adoption and improvements on the sequence, readers who wish to obtain the scripts used to generate the 2D inversion pulses are encouraged to contact the authors.
Conclusion
A novel sequence was developed, referred to as UTE-SPECIAL, which allows for an ultrashort echo time of 4 ms on a clinical 3T MR scanner, full intensity signal, adiabatic localization in two of the three spatial dimensions, no anomalous J-modulation and minimal CSDE. UTE-SPECIAL could be used for improved estimation of coupled spin systems either alone or in combination with J-resolved or editing techniques. Although strong macromolecule signals were observed they are not believed to be artefactual. Consistent measured concentrations were observed between experiments.
A novel sequence was developed for in vivo magnetic resonance spectroscopy, which provides 3 dimensional spatial localization at an echo time as short as 4 ms on a clinical scanner
The method provides full intensity signal and adiabatic localization and negligible chemical shift displacement error in two of the three spatial dimensions and
High quality spectra were obtained in both phantom and in vivo experiments
Acknowledgements
Special thanks to New York State Psychiatric Institute (NYSPI) and Feng Liu, PhD, for their facilities and technical support and Martin Gajdošík, PhD, for fruitful discussions and input. This work was supported by the National Multiple Sclerosis Society (NMSS, RG-5319) and by NIH grant P41 EB027061.
Footnotes
Declaration of interests
The authors declare that they have no known competing financial interests or personal relationships that could have appeared to influence the work reported in this paper.
Publisher's Disclaimer: This is a PDF file of an unedited manuscript that has been accepted for publication. As a service to our customers we are providing this early version of the manuscript. The manuscript will undergo copyediting, typesetting, and review of the resulting proof before it is published in its final form. Please note that during the production process errors may be discovered which could affect the content, and all legal disclaimers that apply to the journal pertain.
References
- 1.Landheer K, Schulte RF, Treacy MS, Swanberg KM & Juchem C Theoretical description of modern 1H in Vivo magnetic resonance spectroscopic pulse sequences. JMRI [Epub ahead of print] (2019). doi: 10.1002/jmri.26846 [DOI] [PubMed] [Google Scholar]
- 2.Wyss PO et al. In Vivo Estimation of Transverse Relaxation Time Constant (T2) of 17 Human Brain Metabolites at 3T. Magn Reson Med 80, 452–461 (2018). [DOI] [PubMed] [Google Scholar]
- 3.Schulte RF, Lange T, Beck J, Meier D & Boesiger P Improved two-dimensional J-resolved spectroscopy. NMR Biomed 19, 264–70 (2006). [DOI] [PubMed] [Google Scholar]
- 4.Thomas MA, Hattori N, Umeda M, Sawada T & Naruse S Evaluation of two-dimensional L-COSY and JPRESS using a 3 T MRI scanner: from phantoms to human brain in vivo. NMR Biomed 16, 245–51 (2003). [DOI] [PubMed] [Google Scholar]
- 5.Landheer K et al. Diffusion-Weighted J-Resolved Spectroscopy. Magn Reson Med 1245, 1235–1245 (2017). [DOI] [PubMed] [Google Scholar]
- 6.Garwood M & DelaBarre L The Return of the Frequency Sweep: Designing Adiabatic Pulses for Contemporary NMR. J Magn Reson 153, 155–177 (2001). [DOI] [PubMed] [Google Scholar]
- 7.Lange T, Dydak U, Roberts TPL, Bjeljac M & Boesiger P Pitfalls in Lactate Measurements at 3T. Am J Neuroradiol 27, 895–901 (2006). [PMC free article] [PubMed] [Google Scholar]
- 8.Wilson M et al. Methodological consensus on clinical proton MRS of the brain: Review and recommendations. Magn Reson Med 1–24 (2019). doi: 10.1002/mrm.27742 [DOI] [PMC free article] [PubMed] [Google Scholar]
- 9.Frahm J, Merboldt K-D & Hänicke W Localized Proton Spectroscopy using Stimulated Echoes. J Magn Reson 72, 502–508 (1987). [DOI] [PubMed] [Google Scholar]
- 10.Tkáč I, Starcuk Z, Choi IY & Gruetter R In vivo 1H NMR spectroscopy of rat brain at 1 ms echo time. Magn Reson Med 41, 649–56 (1999). [DOI] [PubMed] [Google Scholar]
- 11.Tkáč I & Gruetter R Methodology of 1H NMR spectroscopy of the human brain at very high magnetic fields. Applied Magnetic Resonance 29, 139–157 (2005). [DOI] [PMC free article] [PubMed] [Google Scholar]
- 12.Oz G & Tkac I Short-echo, Single-shot, Full-indensity 1H MRS For Neurochemical Profiling at 4T: Validation in the Cerebellum andd Brainstem. Magn Reson Med 65, 1–19 (2011). [DOI] [PMC free article] [PubMed] [Google Scholar]
- 13.Tkáč I, Andersen P, Adriany G, Merkle H & Gruetter R In Vivo 1H NMR Spectroscopy of the Human Brain at 7 T. Magn Reson Med 46, 451–456 (2001). [DOI] [PubMed] [Google Scholar]
- 14.Mlynárik V, Gambarota G, Frenkel H & Gruetter R Localized short-echo-time proton MR spectroscopy with full signal-intensity acquisition. Magn Reson Med 56, 965–970 (2006). [DOI] [PubMed] [Google Scholar]
- 15.Ordidce RJ & Connelly A Image-Selected in Vivo Spectroscopy (ISIS ). A New Technique for Spatially Selective NMR Spectroscopy. Jour Magn Reson 66, 283–294 (1986). [Google Scholar]
- 16.Bottomley PA Spatial Localization in NMR Spectroscopy in Vivo. Ann N Y Acad Sci 508, 333–348 (1987). [DOI] [PubMed] [Google Scholar]
- 17.Mekle R, Gambarota G, Hergt M, Krueger G & Gruetter R MR Spectroscopy of the Human Brain With Enhanced Signal Intensity at Ultrashort Echo Times on a Clinical Platform at 3T and 7T. Magn Reson Med 61, 1279–1285 (2009). [DOI] [PubMed] [Google Scholar]
- 18.Fuchs A, Luttje M, Boesiger P & Henning A SPECIAL semi-LASER with lipid artifact compensation for 1H MRS at 7 T. Magn Reson Med 69, 603–612 (2013). [DOI] [PubMed] [Google Scholar]
- 19.Landheer K, Noeske R, Garwoodd M & Juchem C Double-Shot Semi-Adiabatic Localization for Ultra Short Echo Time Magnetic Resonance Spectroscopy. 2019 Proc ISMRM Abstract Number 1061 [Google Scholar]
- 20.Rothman DL, Petroff OAC, Kevin L & Mattson RH Localized 1H NMR measurements of y-aminobutyric acid in human brain in vivo. Proc Natl Acad Sci USA 90, 5662–5666 (1993). [DOI] [PMC free article] [PubMed] [Google Scholar]
- 21.Terpstra M, Marjanska M, Henry P, Tka I & Gruetter R Detection of an Antioxidant Profile in the Human Brain In Vivo Via Double Editing With MEGA-PRESS. Magn Reson Med 56, 1192–1199 (2006). [DOI] [PubMed] [Google Scholar]
- 22.Choi C et al. 2-hydroxyglutarate detection by magnetic resonance spectroscopy in IDH-mutated patients with gliomas. Nat Med 18, 624–629 (2012). [DOI] [PMC free article] [PubMed] [Google Scholar]
- 23.Jang A, Wu X, Auerbach EJ & Garwood M Designing 3D Selective Adiabatic Radiofrequency Pulses With Single and Parallel Transmission. Magn Reson Med 79, 701–710 (2018). [DOI] [PMC free article] [PubMed] [Google Scholar]
- 24.Silver MS, Joseph RI, Chen CN, Sank VJ & Hoult DI Selective population inversion in NMR. Nature 310, 681–683 (1984). [DOI] [PubMed] [Google Scholar]
- 25.Pauly J, Le Roux P, Nishimura D & Macovski A Parameter Relations for the Shinnar-Le Roux Selective Excitation Pulse Design Algorithm. IEEE Trans Med Imag 10, 53–65 (1991). [DOI] [PubMed] [Google Scholar]
- 26.Levitt MH, Madhu PK & Hughes CE Cogwheel phase cycling. J Magn Reson 155, 300–306 (2002). [DOI] [PubMed] [Google Scholar]
- 27.Landheer K & Juchem C Dephasing optimization through coherence order pathway selection (DOTCOPS) for improved crusher schemes in MR spectroscopy. Magn Reson Med 81, 2209–2222 (2019). [DOI] [PubMed] [Google Scholar]
- 28.Landheer K & Juchem C Simultaneous optimization of crusher and phase cycling schemes for magnetic resonance spectroscopy: an extension of dephasing optimization through coherence order pathway selection. Magn Reson Med 83, 391–402 (2020). [DOI] [PubMed] [Google Scholar]
- 29.Klose U In Vivo Proton Spectroscopy in Presence of Eddy Currents. Magn Reson Med 30, 26–30 (1990). [DOI] [PubMed] [Google Scholar]
- 30.Schirmer T & Auer DP On the reliability of quantitative clinical magnetic resonance spectroscopy of the human brain. NMR Biomed 13, 28–36 (2000). [DOI] [PubMed] [Google Scholar]
- 31.Prinsen H, de Graaf RA, Mason GF, Pelletier D & Juchem C Reproducibility measurement of glutathione, GABA, and glutamate: Towards in vivo neurochemical profiling of multiple sclerosis with MR spectroscopy at 7T. J Magn Reson Imag 45, 187–198 (2017). [DOI] [PMC free article] [PubMed] [Google Scholar]
- 32.Landheer K, Swanberg KM & Juchem C Magnetic Resonance Spectrum Simulator (MARSS), A Novel Software Package for Fast and Computationally Efficient Basis Set Simulation. NMR Biomed e4129 (2019). [DOI] [PubMed] [Google Scholar]
- 33.Deelchand DK et al. Across-vendor standardization of semi-LASER for single-voxel MRS at 3 Tesla. NMR Biomed In press [DOI] [PMC free article] [PubMed] [Google Scholar]
- 34.Birch R, Peet AC, Dehghani H & Wilson M Influence of Macromolecule Baseline on 1 H MR Spectroscopic Imaging Reproducibility. Magn Reson Med 77, 34–43 (2017). [DOI] [PMC free article] [PubMed] [Google Scholar]
- 35.de Graaf RA In Vivo NMR Spectroscopy -- 2nd Edition: Principles and Techniques. (2007).
- 36.de Graaf RA, Brown PB, De Feyter HM, McIntyre S & Nixon TW Elliptical localization with pulsed second-order fields (ECLIPSE) for robust lipid suppression in proton MRSI. NMR Biomed. 31, 1–8 (2018). [DOI] [PMC free article] [PubMed] [Google Scholar]
- 37.Lee S et al. Brain imaging with a Dedicated Asymmetric Head-only Gradient Coil without Peripheral Nerve Stimulation at 500 T/m/s. Proc Intl Soc Mag Reson Med 22, 0310 (2014). [Google Scholar]
- 38.Schulte RF & Noeske R Peripheral Nerve Stimulation-Optimal Gradient Waveform Design. Magn Reson Med 74, 518–522 (2015). [DOI] [PubMed] [Google Scholar]
- 39.Hoefemann M, Adalid V & Kreis R Optimizing acquisition and fitting conditions for 1 H MR spectroscopy investigations in global brain pathology. NMR Biomed e4161 (2019). doi: 10.1002/nbm.4161 [DOI] [PubMed] [Google Scholar]
- 40.Landheer K et al. A rapid inversion technique for the measurement of longitudinal relaxation times of brain metabolites: application to lactate in high-grade gliomas at 3 T. NMR Biomed. 29, 1381–1390 (2016). [DOI] [PubMed] [Google Scholar]
- 41.Stanisz GJ et al. T1, T2 relaxation and magnetization transfer in tissue at 3T. Magn Reson Med 54, 507–12 (2005). [DOI] [PubMed] [Google Scholar]
- 42.Posse S, Cuenod C & Bihan D, Le. Human Brain: Proton Diffusion MR Spectroscopy. Radiology 188, 719–725 (1993). [DOI] [PubMed] [Google Scholar]
- 43.Gu M et al. GABA editing with macromolecule suppression using an improved MEGA-SPECIAL sequence. Magn Reson Med 79, 41–47 (2018). [DOI] [PMC free article] [PubMed] [Google Scholar]
- 44.Gonçalves SI, Ligneul C & Shemesh N Short echo time relaxation-enhanced MR spectroscopy reveals broad downfield resonances. Magn Reson Med 1266–1277 (2019). doi: 10.1002/mrm.27806 [DOI] [PubMed] [Google Scholar]