Abstract
We investigate the properties of a single-view fluorescence microscope in a 4 f geometry when imaging fluorescent dipoles without using the monopole or scalar approximations. We show that this imaging system has a spatio-angular band limit, and we exploit the band limit to perform efficient simulations. Notably, we show that information about the out-of-plane orientation of ensembles of in-focus fluorophores is recorded by paraxial fluorescence microscopes. Additionally, we show that the monopole approximation may cause biased estimates of fluorophore concentrations, but these biases are small when the sample contains either many randomly oriented fluorophores in each resolvable volume or unconstrained rotating fluorophores.
1. Introduction
In the first of this pair of papers we developed a new set of transfer functions that can be used to analyze spatio-angular fluorescence microscopes [1]. In this work we will demonstrate these transfer functions by analyzing a single-view fluorescence microscope in a 4 f geometry.
The central goal of this work is to understand how much angular information an unmodified 4 f microscope transmits to the detector. Fluorescence microscopists know that without structured illumination or single molecule techniques they can only hope to recover spatial frequencies up to the spatial band limit of the optical system 2NA/λ. In this work we will find a similar limit for angular frequencies and understand what design factors affect this limit.
A secondary goal of this work is to examine the validity of the monopole approximation in fluorescence microscopy. Although many works implicitly apply the monopole approximation, we have encountered two explicit justifications: (1) the sample contains many randomly oriented fluorophores within a resolvable volume or (2) the sample contains unconstrained rotating fluorophores. While both of these situations yield monopole-like emitters, neither yields emitters that are perfectly described by the monopole model. We investigate the dipole model of fluorophores in detail and find the conditions under which the monopole approximation is justified.
We begin in section 2 by specifying the imaging geometry and defining pupil functions for imaging systems with and without the monopole approximation. We explicitly relate the pupil functions to the coherent transfer functions to establish a connection between physical calculations and the transfer functions. Next, in section 3 we calculate the monopole and dipole transfer functions in closed form, and we use these transfer functions to perform efficient simulations with four numerical phantoms. Finally, in section 4 we discuss the results and expand on how the pupil functions can be used to develop improved models for spatio-angular microscopes.
2. Theory
During our initial modeling [1] we considered an aplanatic optical system imaging a sample of fluorescent emissions—either a monopole emission density, , or a dipole emission density, —by recording the scaled irradiance on a two-dimensional detector, g(rd). A central result was that we could express the relationship between the object (the emission densities) and the data (the irradiance) as a linear Hilbert-space operator, and we showed that these operators took the form of an integral transform in a delta function basis. In this paper we will restrict our attention to in-focus objects, so we will split into and and set . For in-focus monopole emissions the integral transform takes the form
| (1) |
where is the monopole point spread function. For dipole emissions the integral transform takes the form
| (2) |
where is the dipole point spread function. Note that we have written Eqs. (1) and (2) in their demagnified forms. We will use primes to denote the unscaled detector coordinate, , and unscaled point spread functions, h′.
After expressing the operators in a delta function basis we explored the form of the operators with several other choices of basis functions. Tables 1 and 2 summarize our results.
Table 1.
Summary of relevant quantities for in-focus fluorescence microscopy under the monopole approximation—see [1] for derivations. denotes a two-dimensional Fourier transform.
| Quantity | Symbol | Relationships |
|---|---|---|
| Monopole emission density | — | |
| Monopole spectrum | F(v) | |
| Monopole coherent spread function | — | |
| Monopole coherent transfer function | C(τ) | |
| Monopole point spread function | ||
| Monopole transfer function | H(v) |
|
| Scaled irradiance | g(rd) | |
| Scaled irradiance spectrum | G(v) | |
Table 2.
Summary of relevant quantities for in-focus spatio-angular dipole imaging—see [1] for derivations. denotes a two-dimensional Fourier transform, and denotes a spherical Fourier transform.
| Quantity | Symbol | Relationships |
|---|---|---|
| Dipole emission density | — | |
| Dipole spatial spectrum | ||
| Dipole angular spectrum | ||
| Dipole spatio-angular spectrum | ||
| Dipole coherent spread function | — | |
| Dipole coherent transfer function | ||
| Dipole point spread function | ||
| Dipole spatial transfer function |
|
|
| Dipole angular transfer function | ||
| Dipole spatio-angular transfer function | ||
| Scaled irradiance | g(rd) |
|
| Scaled irradiance spectrum | G(v) |
|
Our task is to calculate the form of the monopole and dipole transfer functions for a specific imaging geometry. In this work we will consider an aplanatic optical system in a 4 f configuration with an arbitrary first lens (the objective lens) and a paraxial second lens (the tube lens) as shown in Fig. 1. A lens can be considered paraxial if the angle α between the optical axis of the lens and the marginal ray is small enough that sin α ≈ α. As a rule of thumb, non-paraxial effects only become significant when the numerical aperture of a lens exceeds 0.7 [2, ch. 6], but this is only a rough guideline. Commercial microscopes with infinity-corrected objectives can almost always can be modeled by considering the tube lens as paraxial.
Fig. 1.
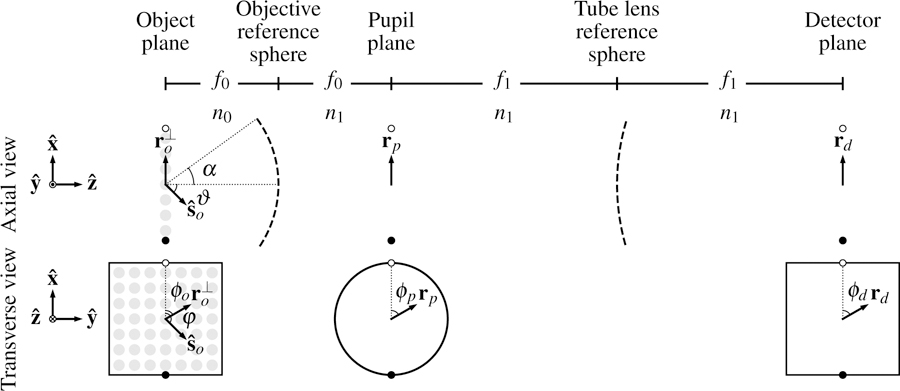
Schematic of an aplanatic imaging system in a 4 f geometry with a paraxial tube lens. We are considering an aplanatic optical system, so we only need to consider the image created by on-axis objects. The fluorescent object consists of ensembles of monopoles or dipoles embedded in a medium with index of refraction n0. An objective with focal length f0 and numerical aperture NA = no sin α is trained on the object. A paraxial tube lens with focal length f1 and a detector complete the 4 f geometry, and all components except the object are embedded in a medium with index of refraction n1. The object, pupil, and detector planes are parameterized by vectors , rp, and rd with polar coordinates (ro, ϕo), (rb, ϕb), and (rd, ϕd), respectively. At each position in the object there is a sphere parameterized by a unit vector with spherical coordinates (ϑ, φ).
2.1. Monopole pupil functions
We define the monopole pupil function p(rp) of the imaging system as the field immediately following the pupil plane created by an on-axis monopole, where rp is an unscaled two-dimensional coordinate in the pupil plane. In this section we will relate the monopole pupil function to the monopole transfer functions by adapting the treatment in Barrett and Myers [3, ch. 9.7].
Since monopoles emit scalar fields, the monopole pupil function is a scalar-valued function. The optical system is aplanatic, so we can write the field, , created at a point in the pupil plane rp by a monopole at position as
| (3) |
where λ is the emission wavelength, and f0 is the focal length of the objective. Equation (3) is a restatement of the aplanatic condition for a 4 f optical system—the fields in the pupil plane can be written as the pupil function multiplied by a linear phase factor that encodes the position of the object.
Since the second lens is paraxial, we can model the relationship between the field in the pupil plane and the field on the detector with a scaled Fourier transform [4–6]:
| (4) |
where is an unscaled detector coordinate, and f1 is the focal length of the tube lens.
If we define P(τ) as the two-dimensional Fourier transform of the pupil function then we can rewrite Eq. (4) as
| (5) |
which we can simplify further by writing in terms of the magnification :
| (6) |
The irradiance on the detector is the absolute square of the field so
| (7) |
If we demagnify the coordinates with and demagnify the irradiance with , we find that the monopole point spread function is related to the Fourier transform of the monopole pupil function by
| (8) |
The monopole point spread function is the absolute square of the monopole coherent spread function so
| (9) |
Finally, the monopole coherent transfer function is the Fourier transform of the monopole coherent spread function so
| (10) |
Equation (10) is the key result of this section—the monopole coherent transfer function is a scaled monopole pupil function.
2.2. Dipole pupil function
We define the dipole pupil function of the imaging system as the electric field immediately following the pupil plane created by an on-axis dipole oriented along . Since dipoles emit vector-valued electric fields, the dipole pupil function is a vector-valued function. Almost all of the arguments in the previous section carry over to the dipole case. Briefly, we can write the electric field created at a point in the pupil rp by a dipole at oriented along as
| (11) |
The second lens is paraxial, so we can find the field on the detector with a Fourier transform
| (12) |
Note that the Fourier transform of a vector field is the Fourier transform of its scalar-valued orthogonal components, so Eq. (12) specifies three two-dimensional Fourier transforms. We follow the same manipulations as the previous section and find that the dipole coherent transfer function is a scaled dipole pupil function
| (13) |
We have restricted our analysis to paraxial tube lenses, but non-paraxial tube lenses (or a non-infinity-corrected objective) can be modeled with vector-valued three-dimensional pupil functions [2, 7–9].
2.3. Special functions
We adopt and generalize Bracewell’s notation [10] for several special functions which will simplify our calculations. First, we define a rectangle function as
| (14) |
We also define the nth-order jinc function as
| (15) |
where Jn+1 (r) is the (n + 1)th-order Bessel function of the first kind.
Although the rectangle and jinc functions are defined in one dimension, we will usually apply them in two dimensions. In Appendix A we derive the following two-dimensional Fourier transform relationships between the jinc functions and the weighted rectangle functions
| (16) |
where the entries inside the curly braces are to be taken one at a time and {r, ϕr}/{ν, ϕν} are conjugate sets of polar coordinates.
Finally, we define the nth-order chat function as the two-dimensional Fourier transform of the squared nth-order jinc function
| (17) |
In Appendix A we show that the zeroth- and first-order chat functions can be written in closed form as
| (18) |
| (19) |
3. Results
3.1. Monopole transfer functions
Our first step towards the monopole transfer functions is to calculate the monopole pupil function and coherent transfer function. Several works [11, 12] have modeled an aplanatic fluorescence microscope imaging monopole emitters with the scalar pupil function
| (20) |
where
| (21) |
The function models the radial dependence of the field and ensures that power is conserved on either side of an aplanatic objective, and the rectangle function models the aperture stop of the objective. Applying Eq. (10) and collecting constants we find that the coherent monopole transfer function is
| (22) |
where NA = no sin α and νc = 2NA/λ. This coherent transfer function models objectives with an arbitrary numerical aperture, but for our initial analysis we restrict ourselves to the paraxial regime. We drop second- and higher-order radial terms to find that
| (23) |
where (p) indicates that we have used the paraxial approximation for the objective lens.
We can find the monopole coherent spread function by taking the inverse Fourier transform of the monopole coherent transfer function
| (24) |
The monopole point spread function is the (normalized) absolute square of the monopole coherent spread function so
| (25) |
which is the well-known Airy disk.
Finally, we can calculate the monopole transfer function as the two-dimensional Fourier transform of the monopole point spread function (or the autocorrelation of the coherent transfer function) and find that
| (26) |
3.2. Dipole transfer functions
To calculate the dipole transfer function we proceed similarly to the monopole case—we find the pupil function, scale to find the coherent dipole transfer function, then calculate the remaining transfer functions.
Several works [6, 13, 14] have calculated the dipole pupil function for a high-NA objective. Using Backer and Moerner’s notation we find that the dipole pupil function is given by
| (27) |
where c(x) and s(x) are shorthand for cos(x) and sin(x), {sx, sy, sz} are the Cartesian components of when is aligned with the optical axis, and
| (28) |
| (29) |
| (30) |
Similar to the monopole case, the dipole pupil function conserves power and has a cutoff at the objective aperture, but the dipole pupil function is vector-valued to model the complete electric field in the pupil plane.
Scaling the dipole pupil function using Eq. (13) yields the dipole coherent transfer function
| (31) |
We restrict our analysis to the paraxial regime of the objective lens by dropping second- and higher-order radial terms to find that
| (32) |
Under the paraxial approximation applied to the objective lens the transverse components of the dipole {sx, sy} create purely parallel fields in the pupil plane and the axial component of the dipole {sz} creates purely radial fields in the pupil plane. Applying the paraxial approximation to the objective lens may seem crude compared to Backer and Moerner’s numerical results, but the approximation will allow us to calculate the transfer functions in closed form so that we can build an intuition for the limits of the microscope. We also note that many existing works in ensemble polarized fluorescence microscopy make stronger approximations than ours. For example, Fourkas only considers the total irradiance in the pupil plane while ignoring the propagation of fields to the detector [15].
The dipole coherent spread function is the inverse Fourier transform of the dipole coherent transfer function. Applying Eq. (16) in reverse yields
| (33) |
Notice that the radial component of the dipole coherent spread function has a π/2 phase shift relative to the parallel component. This phase factor arises because the Fourier transform of a real and odd function is purely imaginary.
3.2.1. Paraxial dipole point spread function
The dipole point spread function is the (normalized) absolute square of the coherent dipole spread function
| (34) |
Plugging in the paraxial dipole coherent spread function and normalizing yields
| (35) |
where , , and the normalization factor is
| (36) |
As discussed above, the parallel and radial fields are out of phase on the detector, so the total irradiance is the sum of the contributions from the parallel and radial components. In Fig. 2 we plot the dipole point spread function for several dipole orientations and numerical apertures, and in Fig. 3 we compare the monopole point spread function to the dipole point spread function. The paraxial monopole and dipole models are only equivalent when the sample consists of transverse dipoles, which is clear if we notice that Eq. (35) reduces to an Airy disk when ϑ = π/2—see Novotny and Hecht for a similar observation [16, ch. 4].
Fig. 2.
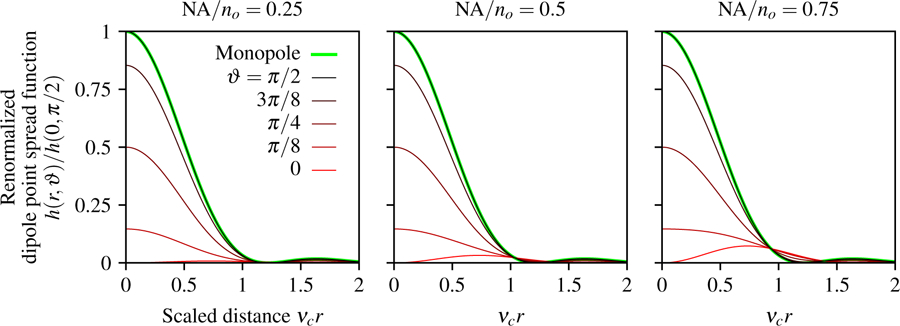
Renormalized paraxial dipole point spread function as a function of the scaled radial coordinate νcr, the dipole inclination angle ϑ, and NA/no. For small numerical apertures (left) the irradiance pattern created by axial dipoles (red) is small compared to transverse dipoles (black), but the relative contribution of axial dipoles increases with the numerical aperture (see red lines from left to right). Additionally, we plot the monopole point spread function (green) and observe that the paraxial monopole and dipole models are identical for transverse dipoles (the green and black lines are coincident).
Fig. 3.
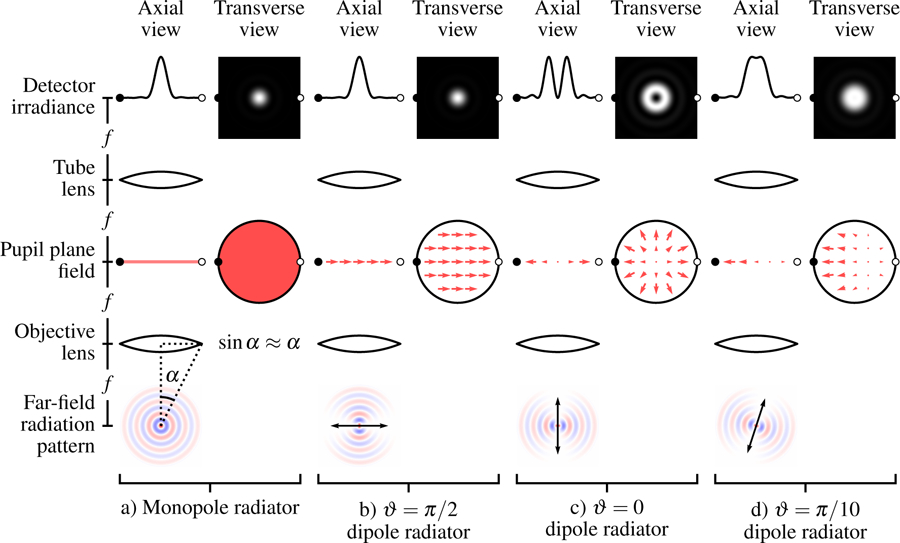
Comparison of paraxial models for monopole radiators a) and dipole radiators b)–d). a) Monopole radiators fill the pupil plane with a uniform scalar field which gives rise to an Airy disk on the detector. b) A transverse dipole radiator also creates an Airy disk, but the pupil plane is filled with a uniform vector field. c) An axial dipole radiator creates a radial electric field pattern in the back focal plane that creates a pattern on the detector. d) Dipoles that are not transverse or axial still create radially symmetric irradiance patterns under the paraxial approximation. Fields from transverse dipoles are real and even while fields from axial dipoles are real and odd, which causes a relative π/2 phase shift for the fields on the detector. This phase shift means that the fields from transverse and axial components of the dipole do not interfere, which causes radially symmetric irradiance patterns.
All of the figures in this paper use the paraxial approximation applied to the objective lens. We estimated the error introduced by this approximation by numerically calculating the dipole point spread function using the exact pupil function in Eq. (27) and comparing the result to the analytic dipole point spread function in Eq. (35). We found that the maximum irradiance error (root mean square irradiance error) in the image plane for NA/no = 0.25, 0.5 and 0.75 was 1%(0.02%), 5%(0.05%), and 12%(0.12%), respectively. Although the paraxial approximation introduces relatively large errors in the fields near the edge of the pupil function, the irradiance errors are modest for NA/no < 0.75 because the paraxial pupil function is accurate near the optical axis, every point in the pupil contributes to the irradiance, and the irradiance is the absolute square of fields. However, note that the paraxial approximation introduces increasingly large errors as NA/no approaches 1. Additionally, the paraxial approximation on the objective imposes radial symmetry on the dipole point spread function. This radial symmetry is approximate, and the symmetry disappears for high-NA objectives.
To demonstrate the paraxial dipole point spread function we simulate a set of equally spaced dipoles with varying orientation:
| (37) |
where , , the subscript (ph1) indicates that this is the first phantom, and the spatial coordinates are expressed in µm. To find the irradiance pattern created by the phantom we plug Eq. (37) into Eq. (2) and use the sifting property to find that
| (38) |
In Fig. 4 we plot the phantom and scaled irradiance for an imaging system with NA = 0.75, λ = 500 nm, and no = 1.33. For these parameters the maximum irradiance error introduced by the paraxial approximation is 6%. We sample and plot the scaled irradiance at 20× the Nyquist rate, ∆x = 1/20[(2νc)], so the irradiance patterns are free of aliasing. The output demonstrates that the irradiance pattern depends on the dipole inclination, but not its azimuth.
Fig. 4.
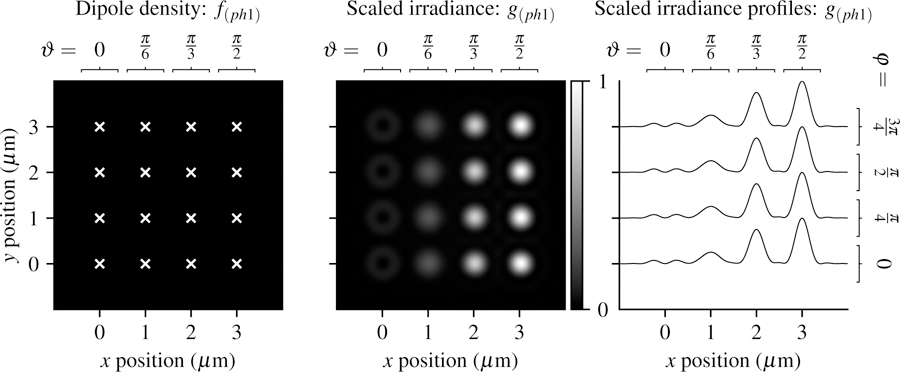
Left: A spatially and angularly sparse phantom—uniformly spaced single dipoles with varying orientations (increasing ϑ from left to right and increasing φ from bottom to top). White crosses mark the positions of the dipoles. Center: Scaled irradiance for an imaging system with NA = 0.75, λ = 500 nm, and no = 1.33 sampled at 20× the Nyquist rate. Right: x profiles through the scaled irradiance. The response is independent of the azimuth angle and strongly dependent on the inclination angle.
3.2.2. Paraxial dipole spatial transfer function
The dipole spatial transfer function is the spatial Fourier transform of the dipole point spread function (or the complex autocorrelation of the dipole coherent transfer function). Applying the Fourier transform to Eq. (35) we find that
| (39) |
In Fig. 5 we plot the dipole spatial transfer function for several dipole orientations and numerical apertures. We find that the dipole spatial transfer function is negative for axial dipoles at high spatial frequencies, especially for larger numerical apertures. The negative dipole spatial transfer function corresponds to a contrast inversion for high-frequency patterns of axial dipoles because the irradiance minimum corresponds to the position of the dipole.
Fig. 5.
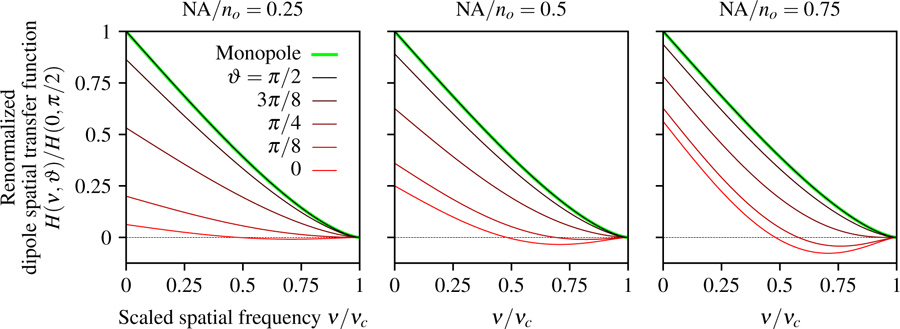
Dipole spatial transfer function as a function of the scaled spatial frequency ν/νc, the dipole inclination angle ϑ, and NA/no. For small numerical apertures (left) the dipole spatial transfer function for axial dipoles (red) is small compared to transverse dipoles (black), but the relative contribution of axial dipoles increases with the numerical aperture (see red lines from left to right). The spatial dipole transfer function of axial dipoles is negative at high spatial frequencies because the central minimum of the axial dipole point spread function corresponds to the position of the dipole. Equivalently, a high-spatial-frequency pattern of axial dipoles will generate an irradiance pattern where the minimum irradiance corresponds to the peak of the axial dipole emission density. Additionally, we plot the monopole transfer function (green) and observe that the paraxial monopole and dipole models are identical for transverse dipoles (the green and black lines are coincident).
To demonstrate the dipole spatial transfer function we simulate a set of equally spaced disks with varying diameter containing fluorophores with varying orientation
| (40) |
where Dk = 0.15(1 + k) µm and . Notice that we have scaled the disks so that the total number of fluorophores in each disk is constant. Also notice that the disk can model a spatial distribution of many fluorophores or a single molecule undergoing spatial diffusion within a well.
We can calculate the scaled irradiance by taking the spatial Fourier transform of each orientation in the phantom, multiplying the result with the dipole spatial transfer function, summing over the orientations, then taking the inverse spatial Fourier transform
| (41) |
In Fig. 6 we plot the phantom and scaled irradiance with the same imaging parameters as the previous section. The small disks create irradiance patterns that are similar to the point sources in the previous section, while larger disks create increasingly uniform irradiance patterns that hide the orientation of the fluorophores.
Fig. 6.
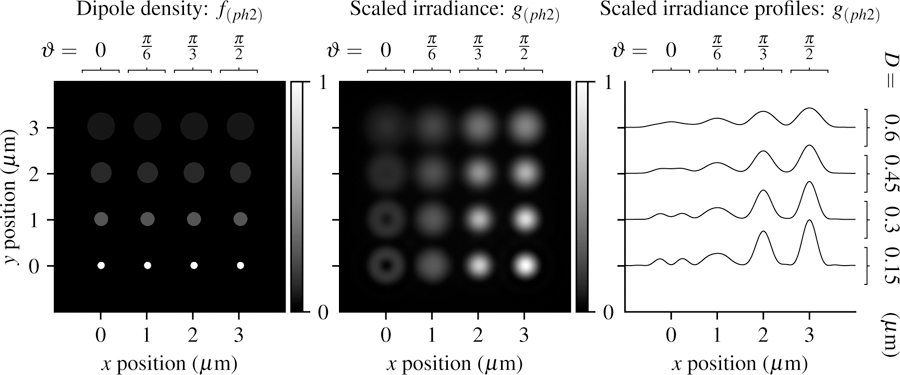
Left: A spatially dense and angularly sparse phantom—uniformly spaced disks with varying size (increasing D from bottom to top) and dipole orientation (increasing ϑ from left to right) Center: Scaled irradiance for an imaging system with NA = 0.75, λ = 500 nm, and no = 1.33 sampled at 20× the Nyquist rate. Right: x profiles through the scaled irradiance. Larger disks generate increasingly uniform irradiance patterns with fewer details that may indicate the orientation of fluorophores.
3.2.3. Paraxial dipole angular transfer function
To calculate the angular dipole transfer function we take the spherical Fourier transform of the dipole point spread function
| (42) |
After evaluating the integrals and normalizing, the angular dipole transfer function is
| (43) |
where . Notice that the dipole angular transfer function only has two non-zero terms that correspond to m = 0 spherical harmonics. These spherical harmonics are rotationally symmetric about the optical axis, and this symmetry is imposed by the paraxial approximation. When the paraxial approximation is not applied to low-NA imaging systems, the higher-order m terms will be very small. As the NA increases, the relative size of the higher-order m terms increases. The root mean square error introduced by the paraxial approximation is conserved under a change of basis, so the paraxial approximation introduces a 0.02%, 0.05%, 0.12% RMS error for NA/no = 0.25, 0.5 and 0.75, respectively.
In Fig. 7 we plot the dipole angular transfer function for both spherical harmonic terms and several numerical apertures. Note that the dipole angular transfer function can be negative because the spherical harmonics can take negative values. The ℓ = 0 term shows that angularly uniform distributions of dipoles create spatial irradiance patterns that are similar but not identical to the Airy disk, while the ℓ = 2 term shows a negative pattern because of the large contribution of the transverse negative values in the spherical harmonic.
Fig. 7.
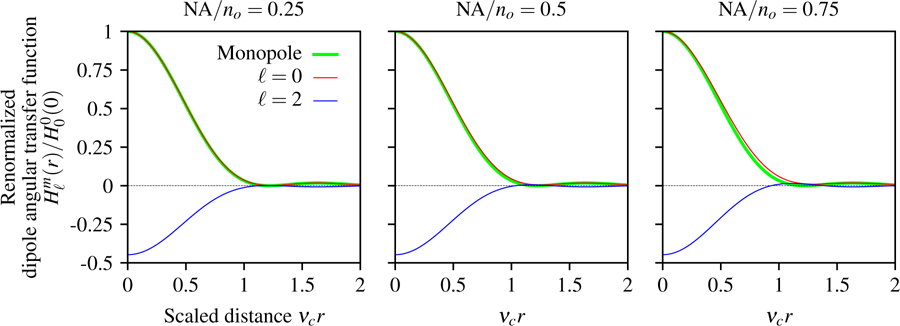
Paraxial dipole angular transfer function in terms of a scaled radial detection coordinate νcr, the spherical harmonic degree ℓ, and NA/no. Angularly uniform distributions of dipoles ℓ = 0 generate a spatial pattern that is similar but not identical to the Airy disk created by a monopole (green), and this discrepancy increases with the numerical aperture. ℓ = 2 distributions have a negative response because is negative for transverse directions. As the numerical aperture increases, the relative contribution of positive axial dipoles in the ℓ = 2 distribution increases.
To demonstrate the dipole angular transfer function we simulate a set of equally spaced fluorophore distributions with varying orientation and angular distributions
| (44) |
where
| (45) |
is an angular double cone distribution with central direction and cone half-angle ∆; ; and . Notice that when ∆ = 0 the angular double cone reduces to a single direction, and when ∆ = π/2 the angular double cone reduces to an angularly uniform distribution. Also notice that the double cone can model angular diffusion or the angular distribution of many fluorophores within a resolvable volume.
Our first step towards the irradiance pattern is to calculate the dipole angular spectrum of the phantom. In Appendix B we calculate the spherical Fourier transform of the double cone distribution which we can use to express the dipole angular spectrum as
| (46) |
To calculate the scaled irradiance we multiply the dipole angular spectrum by the dipole angular transfer function and sum over the dipoles and spherical harmonics
| (47) |
In Fig. 8 we plot the phantom and scaled irradiance with the same imaging parameters as the previous sections. For small cone angles the irradiance patterns are similar to the point sources in the previous sections, while larger cone angles create increasingly uniform irradiance patterns that hide the angular information about the distributions.
Fig. 8.
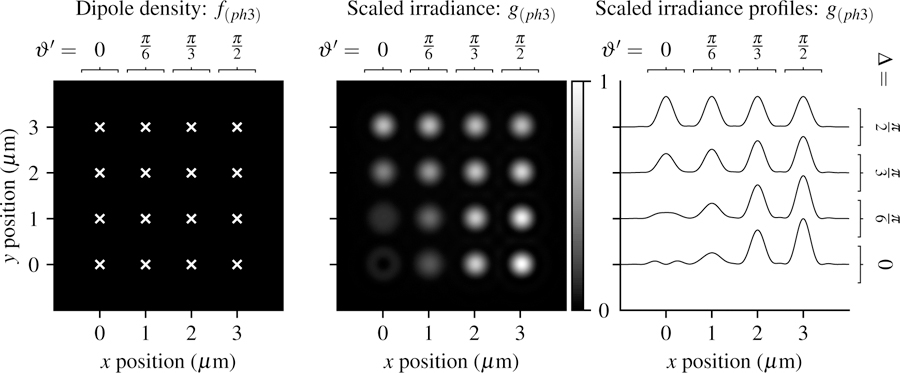
Left: A spatially sparse and angularly dense phantom—uniformly spaced double cone distributions of fluorophores with varying central direction (increasing ϑ′ from left to right) and varying cone half-angle (increasing ∆ from bottom to top). Center: Scaled irradiance for an imaging system with NA = 0.75, λ = 500 nm, and no = 1.33 sampled at 20× the Nyquist rate. Right: x profiles through the scaled irradiance. Small cone angles have irradiance patterns that vary with the central direction, while larger cones angles have increasingly uniform irradiance patterns that hide angular information.
3.2.4. Paraxial dipole spatio-angular transfer function
We can calculate the dipole spatio-angular transfer function by taking the spatial Fourier transform of the dipole angular transfer function (or the spherical Fourier transform of the dipole spatial transfer function) to find that
| (48) |
In Fig. 9 we plot the dipole spatio-angular transfer function for both spherical harmonic terms and several numerical apertures. The ℓ = 0 term shows that an angularly uniform distribution of dipoles has a transfer function that is similar but not identical to the monopole transfer function with high frequencies increasingly suppressed as the numerical aperture increases. The ℓ = 2 term shows a negative pattern because of the large contribution of the transverse negative values in the spherical harmonic. As the numerical aperture increases the relative contribution of the positive axial values increases and the ℓ = 2 term becomes less negative.
Fig. 9.
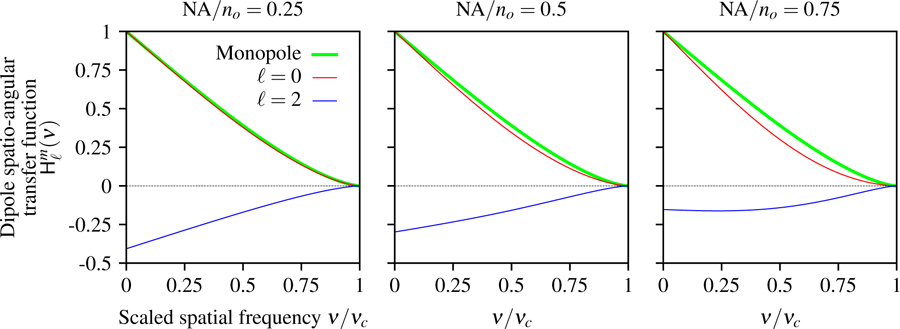
Spatio-angular dipole transfer function as a function of the scaled spatial frequency ν/νc, the spherical harmonic degree ℓ, and NA/no. When the numerical aperture is small the transverse dipoles contribute the most to the signal which gives rise to a positive ℓ = 0 component and a negative ℓ = 2 component. As the numerical aperture increases, the relative contribution of axial dipoles increases and the ℓ = 2 component becomes less negative. Additionally, we plot the monopole transfer function (green) and observe that the ℓ = 0 term is similar but not identical to the monopole transfer function, and this discrepancy increases with the numerical aperture.
To demonstrate the spatio-angular transfer function, we simulate a set of equally spaced disks of fluorophores with varying radius and angular distributions
| (49) |
where Dk = 0.15(1 + k) µm, and .
Our first step towards calculating the irradiance pattern is to calculate the dipole spatio-angular spectrum given by the spatial Fourier transform of the dipole angular spectrum
| (50) |
To calculate the scaled irradiance we multiply the dipole spatio-angular spectrum by the dipole spatio-angular transfer function, sum over the spherical harmonics, then take an inverse Fourier transform
| (51) |
In Fig. 10 we plot the phantom and scaled irradiance with the same imaging parameters as the previous sections. Small cone angles and small disks create relatively unique irradiance patterns, while increasing the cone angle or disk size creates increasingly similar irradiance patterns.
Fig. 10.
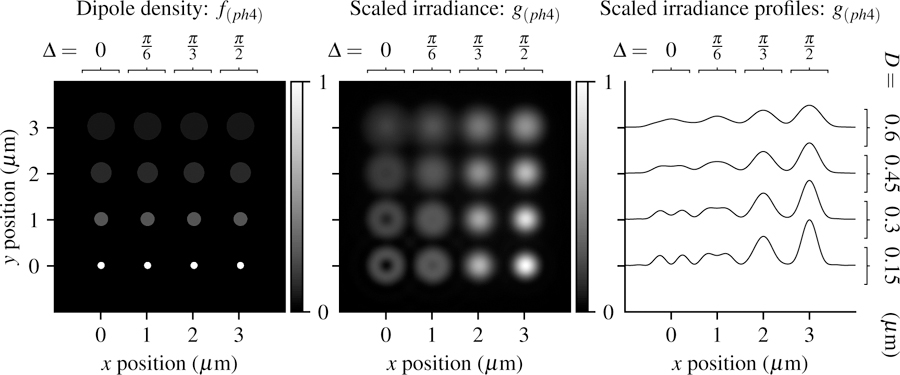
Left: A spatially and angularly dense phantom—uniformly spaced disks with varying size (increasing D from bottom to top) and double cone half angle (increasing ∆ from left to right) Center: Scaled irradiance for an imaging system with NA = 0.75, λ = 500 nm, and no = 1.33 sampled at 20× the Nyquist rate. Right: x profiles through the scaled irradiance.
4. Discussion
4.1. Interpreting the spherical harmonics
Before we interpret the spherical harmonics it is worthwhile to review the interpretation of complex exponentials in monopole fluorescence imaging. We can think of complex exponential functions as functions on the plane with coordinates indexed by spatial frequencies ν. Complex exponentials with small spatial frequencies |ν| can be used to build smooth functions, and complex exponentials with higher spatial frequencies can be added to build sharp edge-like functions. Note that the complex exponentials themselves do not have a direct physical interpretation—they are purely a mathematical convenience for efficiently describing and interpreting imaging systems. A direct physical interpretation would require us to interpret negative- and complex-valued “densities”. However, each complex exponential component of the emission density creates a single physically interpretable plane wave that propagates through the imaging system. This indirect physical interpretation of the complex exponentials is valuable for building an intuition for the effects of pupil apertures and phase masks.
Similarly, the spherical harmonics are functions on the sphere with coordinates indexed by angular frequencies ℓ and m. Spherical harmonics with small ℓ can be used to build smooth spherical functions (for example the ℓ = 0 spherical harmonic is a constant function), and spherical harmonics with higher ℓ can be added to build sharp edge-like spherical functions. Spherical harmonics with m = 0 (the zonal harmonics) can be used to build spherical functions that are rotationally symmetric about the optical axis, and spherical harmonics with non-zero m can be used to build non-rotationally symmetric functions. Once again, the spherical harmonics do not have a direct physical interpretation, but they are useful for efficiently describing and interpreting angular imaging systems.
A single spatio-angular component of the dipole emission density (parameterized by a spatial frequency ν and angular frequency ℓ and m) creates a single plane wave that propagates through the imaging system along a path in accordance with its spatial frequency. When multiple angular components are present at a single spatial frequency, each angular component contributes a plane wave traveling along the same path through the imaging system. We emphasize that this interpretation is indirect—the complex exponentials and spherical harmonics do not have a direct physical interpretation.
4.2. What determines the angular bandwidth?
Spatial imaging systems have a spatial bandwidth that characterizes the highest spatial frequency that the system can transfer between object and data space. Similarly, angular imaging systems have an angular bandwidth that characterizes the highest angular frequency that the system can transfer, but in the angular case there are two different types of angular bandwidths that we call the ℓ- and m-bandwidth. The ℓ-bandwidth can be interpreted in a similar way to the spatial bandwidth—it characterizes the smallest angular features that the imaging system can measure. The m-bandwidth does not have a direct analog in the spatial domain—it characterizes the angular uniformity of the imaging system. If the ℓ- and m-bandwidths are equal then the imaging system can be said to have an isotropic angular bandwidth.
The spatial bandwidth of a fluorescence microscope is well known to be νc = 2NA/λ. In other words, we can increase the spatial resolution of a fluorescence microscope by increasing the NA of the instrument or by choosing a fluorophore with a shorter emission wavelength. Similarly, the angular bandwidth of a fluorescence microscope depends on both the instrument and the choice of fluorophore.
The paraxial microscope we considered in this work has an ℓ-bandwidth of ℓc = 2 and an m-bandwidth of mc = 0, so it does not have an isotropic angular bandwidth. The ℓ-bandwidth of the imaging system is constant for dipole imaging systems because dipole radiators only emit in the ℓ = 0 and ℓ = 2 bands. Increasing the ℓ-bandwidth requires us to use quadrupole/higher-order emitters [17], structured/polarized illumination [18, 19], or multi-photon excitation [20]. The m-bandwidth of the imaging system is 0 for paraxial microscopes because these imaging systems are only sensitive to the inclination angle of dipoles. Therefore, paraxial microscopes only transfer information about dipole emission distributions that are rotationally symmetric about the optical axis. Increasing the m-bandwidth requires a non-paraxial optical system or polarizers in the illumination/detection path.
4.3. Comparing monopole and dipole models
The only case when the dipole and monopole transfer functions match exactly is when the sample consists of dipoles that are completely constrained to the transverse plane of a paraxial imaging system. Dipole radiators that do not lie in the transverse plane are not well described by the monopole approximation, and the monopole approximation is worst for axial dipoles (see Fig. 3).
Applying the monopole approximation to dipoles that are not constrained to the transverse plane can lead to biased estimates of the fluorophore concentrations. To see how these biases manifest, consider the irradiance pattern created by a disk of dipoles oriented along the optic axis—see Figs. 6 or 10. Any reconstruction scheme that uses the monopole approximation would attribute the irradiance pattern created by a disk of axially oriented dipoles to a lower concentration of monopoles, which is a clear example of a biased estimate caused by model mismatch.
However, the common justifications for the monopole approximation—that the fluorophores are rotationally unconstrained or that there are many randomly oriented fluorophores in a resolvable volume—are good approximations. In both of these cases the irradiance contribution from axial dipoles is small compared to the contribution from transverse dipoles, and the irradiance patterns are very similar to the pattern created by a monopole (within 5% at NA/n0 = 0.75—compare the ℓ = 0 line to the monopole line in Fig. 7).
4.4. Towards more realistic models
The theoretical model we presented in this work is an extreme simplification of a real microscope. We have ignored the effects of thick samples, refractive-index mismatch, aberration, scattering, and interactions between fluorophores among others. Because of this long list of unconsidered effects, real experiments will likely require extensions of the models developed here.
The dipole pupil function provides the simplest way to create more realistic models from the simple model in this paper. Phase aberrations can be added to the dipole pupil function with Zernike polynomials, and refractive index boundaries can be modeled by applying the work of Gibson and Lanni to the dipole pupil function [21]. These additions will model phase aberrations, but modeling polarization aberrations will also be necessary, and we anticipate that vector Zernike polynomials and the Jones pupil [22–24] will be essential tools for modeling dipole imaging systems. We plan to use the dipole pupil function to include the effects of non-paraxial objectives, polarizers, and defocus in future papers of this series.
The dipole pupil function also provides an enormous set of design opportunities. The dipole imaging problem may benefit from spatially varying diattenuating and birefrigent masks [25,26]— a much larger set of possibilities than the well-explored design space of amplitude and phase masks [6,26–31]. The dipole pupil function is a step towards Green’s tensor engineering [32], and the dipole transfer functions provide a strong framework for evaluating dipole imaging designs.
In the simple case considered here we focused on the emission path of the microscope, but the excitation path is equally important. Complete models will need to consider the spatio-angular dependence of excitation. Zhenghao et. al. [19] have taken steps in this direction by considering polarized structured illumination microscopy. Rotational dynamics and the fluorescence lifetime are also important to consider when incorporating models of the excitation process [1, 25, 33, 34].
Finally, we have only considered incoherent dipole radiators in this work, but coherent dipole radiators have been modeled in detail by Khadir et al. [35]. We expect that extensions of the dipole transfer functions will help simplify and generalize the coherent dipole radiation point response function, especially when multiple coherent dipole radiators are considered.
5. Conclusions
We have calculated the monopole and dipole transfer functions for paraxial 4 f imaging systems and demonstrated these transfer functions with efficient simulations. We have found that dipole radiators have an angular frequency cutoff of ℓc = 2, and paraxial imaging systems have an angular frequency cutoff of mc = 0. We also found that the monopole and scalar approximations are good approximations when the sample consists of unconstrained rotating fluorophores or many randomly oriented fluorophores within a resolvable volume. Finally, we found that dipole and vector optics effects become larger as rotational order increases, and in these cases the dipole transfer functions become valuable tools.
Acknowledgments
TC was supported by a University of Chicago Biological Sciences Division Graduate Fellowship, and PL was supported by a Marine Biological Laboratory Whitman Center Fellowship. Support for this work was provided by the Intramural Research Programs of the National Institute of Biomedical Imaging and Bioengineering.
Funding
National Institute of Health (NIH) (R01GM114274, R01EB017293).
A. Relationships between special functions
Our first task is to show that
| (52) |
Writing the inverse Fourier transform in polar coordinates yields
| (53) |
The azimuthal integral can be evaluated in terms of an nth order Bessel function (for the complex case see [3, ch. 4.111]).
| (54) |
We can use the following identity [36, ch. 6.561–5]
| (55) |
with a change of variable u = 2ν to find the final result
| (56) |
Fig. 11.
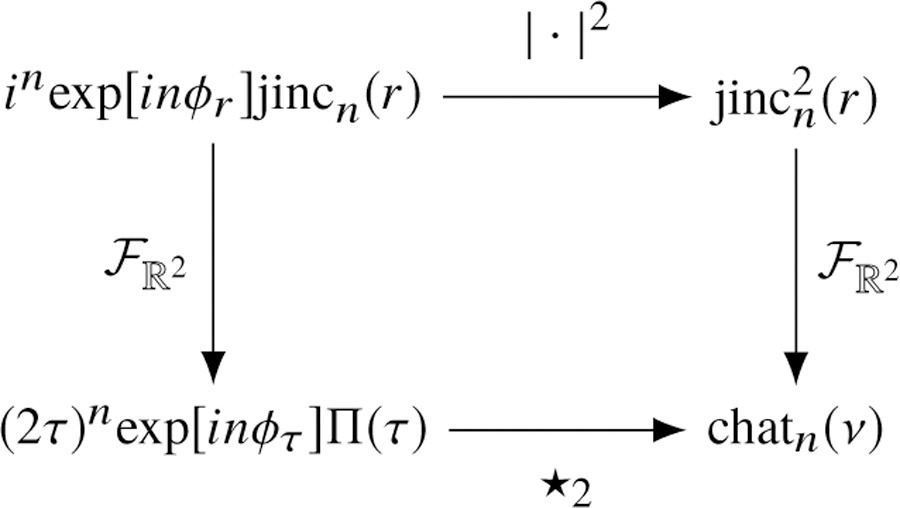
The relationships between special functions. The chat functions are defined as the two-dimensional Fourier transform of the squared jinc functions, and they can be calculated with the two-dimensional complex autocorrelations (denoted by⋆2 ) of the complex-weighted rectangle functions.
We can use the relationship in Eq. (52) to express the chat functions in terms of a complex autocorrelation—see the diagram in Fig. 11. Starting with the definition of the nth-order chat function
| (57) |
we can rewrite the integrand in terms of the absolute square of a simpler function with a known Fourier transform
| (58) |
| (59) |
Now we can apply the autocorrelation theorem to rewrite the Fourier transform as
| (60) |
where the function to be autocorrelated can be found with the help of Eq. (52)
| (61) |
It will be more convenient to set up the autocorrelation in Cartesian coordinates
| (62) |
Plugging Eq. (62) into Eq. (60) gives
| (63) |
We can interpret the autocorrelation as an integral over a region of overlap between a circle centered at the origin and a circle shifted to the right by ν (a geometric lens). Using the construction in Fig. 12 we can express this region as
| (64) |
For n = 0:
| (65) |
| (66) |
which is a well-known result [4, 10, 37]. For n = 1:
| (67) |
| (68) |
Fig. 12.

Geometric construction for evaluating the autocorrelation. We need to integrate over the overlapping region of two circles with radius 1/2 and distance ν between their centers. The region is four times the difference in area between a sector of angle cos−1(ν) and radius 1/2 and a right triangle with base ν/2 and hypotenuse 1/2.
B. Spherical Fourier transform of a double cone
In this appendix we evaluate the spherical Fourier transform of a normalized double-cone angular distribution with central direction and cone half-angle ∆
| (69) |
The spherical Fourier transform is
| (70) |
The limits of integration will be difficult to find unless we change coordinates to exploit the axis of symmetry . Since the spherical function is rotationally symmetric about we can rotate the function so that the axis of symmetry is aligned with and multiply by to account for the rotation [38]
| (71) |
In this coordinate system the double cone is independent of the azimuthal angle, so we can evaluate the azimuthal integral and express the function in terms of an integral over ϑ:
| (72) |
The function is only non-zero on the intervals ϑ ∈ [0, ∆] and ϑ ∈ [π − ∆, π] so
| (73) |
Applying a change of coordinates with u = cos ϑ yields
| (74) |
The Legendre polynomials Pℓ(u) are even (odd) on the interval [–1, 1] when ℓ is even (odd), so the pair of integrals will be identical when ℓ is even and cancel when ℓ is odd. For even ℓ,
| (75) |
The integral evaluates to [36, ch. 7.111]
| (76) |
where is the associated Legendre polynomial with order m = −1, not an inverse Legendre polynomial. Bringing everything together
| (77) |
Footnotes
Disclosures
The authors declare that there are no conflicts of interest related to this article.
References
- 1.Chandler T, Shroff H, Oldenbourg R, and La Rivière PJ, “Spatio-angular fluorescence microscopy I. basic theory,” https://arxiv.org/abs/1812.07093 (2018). [DOI] [PMC free article] [PubMed]
- 2.Gu M, Advanced Optical Imaging Theory, Springer Series in Optical Sciences (Springer, 2000). [Google Scholar]
- 3.Barrett H and Myers K, Foundations of Image Science (Wiley-Interscience, 2004). [Google Scholar]
- 4.Goodman J, Introduction to Fourier Optics (McGraw-Hill, 1996). [Google Scholar]
- 5.Axelrod D, “Fluorescence excitation and imaging of single molecules near dielectric-coated and bare surfaces: a theoretical study.” J. Microsc 247 2, 147–60 (2012). [DOI] [PubMed] [Google Scholar]
- 6.Backer AS and Moerner WE, “Extending single-molecule microscopy using optical Fourier processing,” J. Phys. Chem. B 118, 8313–8329 (2014). [DOI] [PMC free article] [PubMed] [Google Scholar]
- 7.Sheppard CJR, Gu M, Kawata Y, and Kawata S, “Three-dimensional transfer functions for high-aperture systems,” J. Opt. Soc. Am. A 11, 593–598 (1994). [Google Scholar]
- 8.Arnison MR and Sheppard CJ, “A 3D vectorial optical transfer function suitable for arbitrary pupil functions,” Opt. Commun 211, 53–63 (2002). [Google Scholar]
- 9.Foreman MR and Török P, “Computational methods in vectorial imaging,” J. Mod. Opt 58, 339–364 (2011). [Google Scholar]
- 10.Bracewell R, Fourier Analysis and Imaging (Springer US, 2004). [Google Scholar]
- 11.Petrov PN, Shechtman Y, and Moerner WE, “Measurement-based estimation of global pupil functions in 3D localization microscopy,” Opt. Express 25, 7945–7959 (2017). [DOI] [PMC free article] [PubMed] [Google Scholar]
- 12.Backlund MP, Shechtman Y, and Walsworth RL, “Fundamental precision bounds for three-dimensional optical localization microscopy with Poisson statistics,” Phys. Rev. Lett 121, 023904 (2018). [DOI] [PubMed] [Google Scholar]
- 13.Böhmer M and Enderlein J, “Orientation imaging of single molecules by wide-field epifluorescence microscopy,” J. Opt. Soc. Am. B 20, 554–559 (2003). [Google Scholar]
- 14.Lieb MA, Zavislan JM, and Novotny L, “Single-molecule orientations determined by direct emission pattern imaging,” J. Opt. Soc. Am. B 21, 1210–1215 (2004). [Google Scholar]
- 15.Fourkas JT, “Rapid determination of the three-dimensional orientation of single molecules,” Opt. Lett 26, 211–213 (2001). [DOI] [PubMed] [Google Scholar]
- 16.Novotny L and Hecht B, Principles of Nano-Optics (Cambridge University Press, 2006). [Google Scholar]
- 17.Curto AG, Taminiau TH, Volpe G, Kreuzer MP, Quidant R, and van Hulst NF, “Multipolar radiation of quantum emitters with nanowire optical antennas,” Nat. Commun 4, 1750 EP – (2013). [DOI] [PMC free article] [PubMed] [Google Scholar]
- 18.Dale R, Hopkins S, an der Heide U, Marszałek T, Irving M, and Goldman Y, “Model-independent analysis of the orientation of fluorescent probes with restricted mobility in muscle fibers,” Biophys. J 76, 1606–1618 (1999). [DOI] [PMC free article] [PubMed] [Google Scholar]
- 19.Zhanghao K, Chen X, Liu W, Li M, Shan C, Wang X, Zhao K, Lai A, Xie H, Dai Q, and Xi P, “Structured illumination in spatial-orientational hyperspace,” https://arxiv.org/abs/1712.05092.
- 20.Brasselet S, “Polarization-resolved nonlinear microscopy: application to structural molecular and biological imaging,” Adv. Opt. Photon 3, 205 (2011). [Google Scholar]
- 21.Gibson SF and Lanni F, “Diffraction by a circular aperture as a model for three-dimensional optical microscopy,” J. Opt. Soc. Am. A 6, 1357–1367 (1989). [DOI] [PubMed] [Google Scholar]
- 22.Zhao C and Burge JH, “Orthonormal vector polynomials in a unit circle, part I: basis set derived from gradients of Zernike polynomials,” Opt. Express 15, 18014–18024 (2007). [DOI] [PubMed] [Google Scholar]
- 23.Xu X, Huang W, and Xu M, “Orthogonal polynomials describing polarization aberration for rotationally symmetric optical systems,” Opt. Express 23, 27911–27919 (2015). [DOI] [PubMed] [Google Scholar]
- 24.Chipman RA, “Polarization analysis of optical systems,” Opt. Eng 28, 28 – 28 – 10 (1989). [Google Scholar]
- 25.Lew MD, Backlund MP, and Moerner WE, “Rotational mobility of single molecules affects localization accuracy in super-resolution fluorescence microscopy,” Nano Lett 13, 3967–3972 (2013). [DOI] [PMC free article] [PubMed] [Google Scholar]
- 26.Backlund MP, Arbabi A, Petrov PN, Arbabi E, Saurabh S, Faraon A, and Moerner WE, “Removing orientation-induced localization biases in single-molecule microscopy using a broadband metasurface mask,” Nat. Photonics 10, 459 EP – (2016). [DOI] [PMC free article] [PubMed] [Google Scholar]
- 27.Sick B, Hecht B, and Novotny L, “Orientational imaging of single molecules by annular illumination,” Phys. Rev. Lett 85, 4482–4485 (2000). [DOI] [PubMed] [Google Scholar]
- 28.Patra D, Gregor I, and Enderlein J, “Image analysis of defocused single-molecule images for three-dimensional molecule orientation studies,” The J. Phys. Chem. A 108, 6836–6841 (2004). [Google Scholar]
- 29.Toprak E, Enderlein J, Syed S, McKinney SA, Petschek RG, Ha T, Goldman YE, and Selvin PR, “Defocused orientation and position imaging (DOPI) of myosin V,” Proc. Natl. Acad. Sci. U.S.A 103, 6495–6499 (2006). [DOI] [PMC free article] [PubMed] [Google Scholar]
- 30.Backer AS, Backlund MP, Lew MD, and Moerner WE, “Single-molecule orientation measurements with a quadrated pupil,” Opt. Lett 38, 1521–1523 (2013). [DOI] [PMC free article] [PubMed] [Google Scholar]
- 31.Karedla N, Stein SC, Hähnel D, Gregor I, Chizhik A, and Enderlein J, “Simultaneous measurement of the three-dimensional orientation of excitation and emission dipoles,” Phys. Rev. Lett 115, 173002 (2015). [DOI] [PubMed] [Google Scholar]
- 32.Agrawal A, Quirin S, Grover G, and Piestun R, “Limits of 3D dipole localization and orientation estimation for single-molecule imaging: towards Green’s tensor engineering,” Opt. Express 20, 26667–26680 (2012). [DOI] [PubMed] [Google Scholar]
- 33.Zhang O, Lu J, Ding T, and Lew MD, “Imaging the three-dimensional orientation and rotational mobility of fluorescent emitters using the tri-spot point spread function,” Appl. Phys. Lett 113, 031103 (2018). [DOI] [PMC free article] [PubMed] [Google Scholar]
- 34.Zhang O and Lew MD, “Fundamental limits on measuring the rotational constraint of single molecules using fluorescence microscopy,” https://arxiv.org/abs/1811.09017. [DOI] [PMC free article] [PubMed]
- 35.Khadir S, Chaumet PC, Baffou G, and Sentenac A, “Quantitative model of the image of a radiating dipole through a microscope,” J. Opt. Soc. Am. A 36, 478–484 (2019). [DOI] [PubMed] [Google Scholar]
- 36.Gradshteyn IS and Ryzhik IM, Table of Integrals, Series, and Products (Elsevier/Academic Press, Amsterdam, 2007). [Google Scholar]
- 37.Mertz J, Introduction to Optical Microscopy (W. H. Freeman, 2009). [Google Scholar]
- 38.Ramamoorthi R, “Modeling illumination variation with spherical harmonics,” in Face Processing: Advanced Modeling and Methods, (Academic Press, 2005). [Google Scholar]


