Abstract
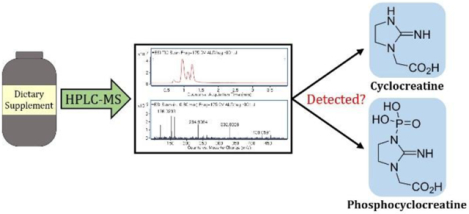
Creatine transporter deficiency (CTD) is caused by a defect in the X-linked creatine transporter SLC6A8 gene leading to severe neurologic and physiologic conditions. Cyclocreatine and phosphocyclocreatine supplementation is seen as a potential treatment, but the presence of these compounds within commercially available dietary supplements presents the risk of self-medication. High-performance liquid chromatography-mass spectrometry (HPLC-MS) is an excellent technique to assess composition of complex amino acid mixtures. Herein, we have developed a facile HPLC-MS method using a cyano column in hydrophilic interaction liquid chromatography (HILIC) mode with isocratic elution over 4 min to identify the main components of two commercially available dietary supplements. The relative standard deviation (RSD) for retention time and extracted ion integrated area are <0.3% and 4%, respectively, showing excellent reproducibility. Cyclocreatine and phosphocyclocreatine were not detectable within the dietary supplements, even at ppm levels, demonstrating the power and importance of the developed HPLC-MS method in analyzing complex mixtures.
Keywords: HPLC-MS, HILIC, creatine transporter deficiency, dietary supplement, creatine, cyclocreatine, phosphocyclocreatine
Graphical Abstract
1. Introduction
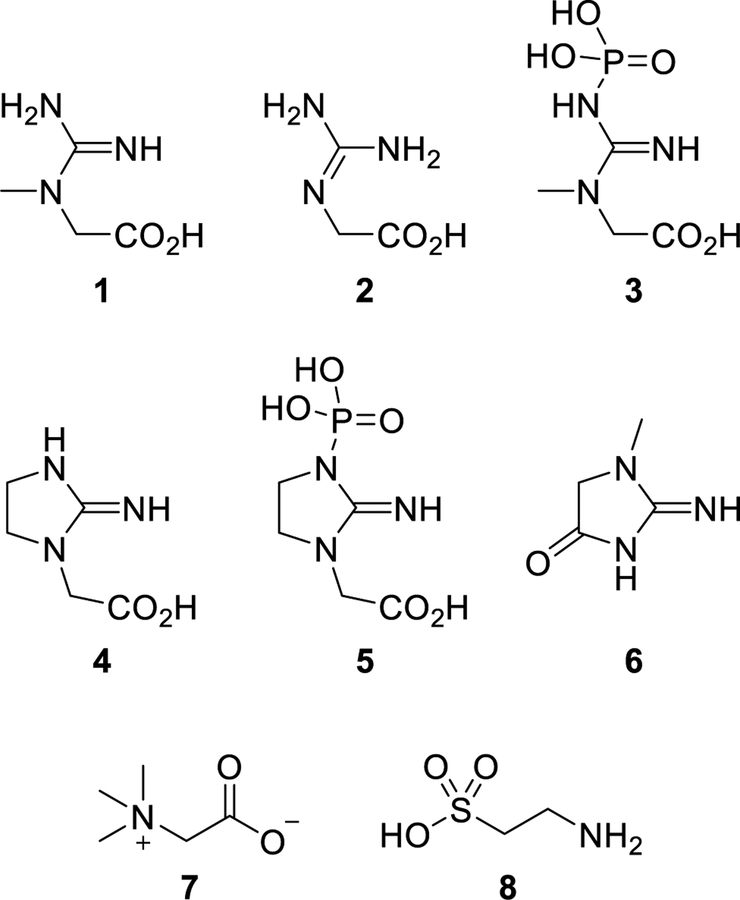
Creatine transporter deficiency (also known as CTD, Creatine Transporter Defect, and SLC6A8 deficiency) is an inborn error of metabolism caused by a defect in the X-linked creatine transporter SLC6A8 gene mapped at Xq28 (SLC6A8/CT1/CRTR).1 Creatine (1) (Figure 1), an endogenous nutrient biosynthetically produced in the liver, kidneys, and pancreas, is essential for the storage and use of energy, especially within the brain and skeletal muscle. Synthesis initiates when L-arginine: glycine amidinotransferase (AGAT) enzymatically transfers an amidino moiety from L-arginine to glycine forming glycocyamine (guanidinoacetate) (2). Subsequent methylation of 2 with S-adenosyl methionine via S-adenosylmethionine:guanidinoacetate methyltransferase (GAMT) catalysis provides creatine (1) that can be delivered to other areas of the body through the bloodstream. The sodium- and chloride-dependent creatine transporter 1 protein actively shuttles creatine into the brain where phosphorylation by creatine kinase (CK) forms phosphocreatine (PCr) (3), which is used to phosphorylate ADP in the generation of ATP. Creatine, through its phosphorylation, acts as a phosphagen, enabling the storage of energy and allowing an increased resynthesis of ATP during periods of high energy demand. Mutation of the SLC6A8 gene leads to an impairment of the necessary transporter protein, thus creating a deficiency of creatine in the brain. The disorder results in many neurological and physiological manifestations including mental retardation, severe delays in language and expressive speech, autistic behavior, epilepsy, and developmental delay.2 These profound intellectual disabilities require CTD patients to receive lifelong dependent care resulting in a poor quality of life for both the patient and the caregiver. Because of the nature of the defect, CTD does not respond to oral supplementation of creatine monohydrate. However, treatment with cyclocreatine (cCr) (4), a synthetic analogue of creatine, was reported to improve cognition in mice with CTD.3
Figure 1:
Structures of expected and observed compounds within tested dietary supplements: creatine (1), glycocyamine (2), phosphocreatine (3), cyclocreatine (4), phosphocyclocreatine (5), creatinine (6), betaine (7), and taurine (8).
As part of our program to address rare genetic diseases, we initiated an evaluation of cyclocreatine (4) as a potential treatment for CTD. Unlike creatine (1), cyclocreatine (4) is neither an endogenous nor natural compound and is being developed as a new molecular entity. We were therefore intrigued to find at least two marketed dietary supplements with labeling claims of “CycloCreatine PCr” and/or “Cyclo-Creatine Phosphate” as components. This opens the possibility that some CTD patients who could potentially benefit from eventual clinical studies with cyclocreatine (4) or phosphocyclocreatine (PcCr) (5) would not be treatment-naïve due to their previous access and exposure. It is important to note that within the literature creatine phosphate and phosphocreatine are used interchangeably, which can lead to structural confusion as creatine phosphate could denote the phosphoric acid salt of creatine rather than a covalently bound phosphate. This naming ambiguity is also seen with the synonymous use of cyclocreatine phosphate and phosphocyclocreatine. If the actual structures were the phosphoric acid salt of creatine and cyclocreatine, they would be detected as the respective parent compound due to dissociation of the phosphoric acid anion. For these reasons, we required an analytical method that would facilitate identification and quantification of cyclocreatine (4), phosphocyclocreatine (5), and creatine (1) from a complex mixture as means to determine their presence, or lack thereof, within the aforementioned dietary supplement products.
Several chemical methods exist to measure the presence of creatine (1) either indirectly with the Jaffe method after conversion of creatine to creatinine (6) or by direct means through Barritt modification of the Voges-Proskauer test or utilizing the fluorometric method.4–6 However, the influence of interfering substances is problematic,7 and these methods are time-consuming. Various analytical techniques such as HPLC,8–10 HPLC-MS,11–15 UPLC-MS,16 GC-MS,15,17,18 and capillary electrophoresis19 have more recently been utilized in the determination of creatine (1), cyclocreatine (4), and their phosphorylated analogues (3 and 5, respectively) within biological samples. However, the only method to examine the detection of all four compounds required two different ion-exchange columns, and its inability to couple with mass spectrometry is a significant limitation. Access to an improved single-run HPLC-MS method, which accounts for the similarity in hydrophilic properties of the compounds to provide better separation, and faster determination with minimized or no ion suppression are critical. As such, we investigated the development of a straightforward and facile method for the detection of cyclocreatine (4), phosphocyclocreatine (5), and other major components within a complex mixture of structurally related amino acids. We present herein a method using HPLC-TOF (TOF = time of flight) MS for analyzing the main components within commercially available dietary supplements. Utilizing a 30 mm length cyano (CN) column and isocratic separation with high organic buffer, the main components of the supplement mixture could be separated and identified while achieving a very high sensitivity at picogram levels for cyclocreatine (4).
2. Materials and Methods
2.1. Materials
The dietary supplements were purchased directly from the vendors and, for the purposes of this Article will be identified as Vendor 1 (V1) and Vendor 2 (V2). Creatine, cyclocreatine, sodium creatine phosphate dibasic tetrahydrate, creatinine, formic acid, HPLC-grade water, and acetonitrile were obtained from Sigma-Aldrich (St. Louis, MO, U.S.A.). The Agilent Eclipse Plus C18 RRHD (2.1×50 mm, particle size 1.8 μm) reversed-phase liquid chromatography (RPLC) column was purchased from Agilent Technologies (Palo Alto, CA, U.S.A.). The Phenomenex Luna CN column (30×4.60 mm, particle size 3 μm) was purchased from Phenomenex (Torrance, CA, U.S.A.). Phosphocyclocreatine was synthesized according to literature procedure.20 Identity and purity of the compound was confirmed by 1H and 31P NMR (Figures S6 and S7).
2.2. Preparation of Cyclocreatine and Phosphocyclocreatine Standards
Cyclocreatine and phosphocyclocreatine were dissolved in HPLC-grade water to prepare 10 μg/μL stock solutions, which were stored at −80 °C when not in use. For each analysis, fresh samples were prepared by serial dilution of the cyclocreatine or phosphocyclocreatine stock solution with HPLC-grade water to give working concentrations of 2 ng/μL, 10 ng/μL, 20 ng/μL, 200 ng/μL, 1 μg/μL, and 2 μg/μL for cyclocreatine and 10 ng/μL, 20 ng/μL, 200 ng/μL, 2 μg/μL, and 10 μg/μLfor phosphocyclocreatine.
2.3. Dietary Supplement Sample Preparation
Solutions of dietary supplements from V1 and V2 were prepared by dissolving a known amount of each sample in an appropriate volume of HPLC-grade water to give a concentration of 2 μg/μL for V1 and 1 μg/μL for V2. Prior to HPLC-MS analysis, the samples were centrifuged at 3000 rpm for 10 min at room temperature to remove any particulates, and the supernatant was transferred to a separate vial. Solution sets containing spiked dietary supplement samples at five concentrations for use in the HPLC-MS analysis were prepared by adding 1 μL aliquots of cyclocreatine standard (2 ng/μL, 20 ng/μL, 200 ng/μL, 1 μg/μL, and 2 μg/μL) or phosphocyclocreatine standard (10 ng/μL, 20 ng/μL, 200 ng/μL, 2 μg/μL, and 10 μg/μL) into separate 99 μL samples of V1 at a concentration of 2 μg/μL. Subsequently, HPLC-MS analysis was performed by injecting 0.5 μL of each spiked sample, which corresponded to ~1 μg of each V1 sample on column containing a known amount of cyclocreatine standard (10 pg, 100 pg, 1 ng, 5 ng, and 10 ng) or phosphocyclocreatine standard (50 pg, 100 pg, 1 ng, 10 ng, and 50 ng).
Similar procedures were applied to the V2 sample where 1 μL of cyclocreatine (10 ng/μL) or phosphocyclocreatine (10 ng/μL) was added to 99 μL samples of V2 at a concentration of 1 μg/μL. HPLC-MS analysis was performed by injecting 1 μL of each spiked sample corresponding to ~1 μg V2 samples on column containing 100 pg of cyclocreatine or phosphocyclocreatine standard.
2.4. High-Performance Liquid Chromatography
Liquid chromatography was performed on an Agilent 1290 Infinity II LC system (Agilent Technologies, Wilmington, DE, U.S.A.) equipped with a diode array detector (DAD), binary pump, multicolumn thermostat, and autosampler. The mobile phases used for the separation were HPLC-grade water with 0.1% formic acid (solvent A) and HPLC-grade acetonitrile with 0.1% formic acid (solvent B). Gradient and isocratic elutions were performed at a flow rate of 0.6 mL/min. Separations were performed at a column temperature of 40 °C with a total run time of 4 min. A varying volume of sample was injected onto the column for each experimental run.
2.5. Mass Spectrometry
All the MS experiments were conducted on an Agilent 6230 TOF system (Agilent Technologies, Wilmington, DE, U.S.A.), equipped with a DUAL AJS ESI source operating in positive or negative ion mode. MS spectra were acquired from m/z 100 to 500 at a scan rate of 1 spectrum per second. The electrospray ionization (ESI) source parameters were used as follows: gas temp, 325 °C; gas flow, 11 L/min; nebulizer, 35 psi; Vcap, 3500 V; nozzle,1000 V; fragmentor, 175 V.
2.6. Quantification of Sample Curves for Spiked Standards
The MS raw data acquired for V1 and V2 spiked with cyclocreatine or phosphocyclocreatine standards at varying concentrations were subsequently processed using Agilent MassHunter Qualitative Analysis software, version B.07.00. The extracted ion for each component used the predicted m/z at the 20 ppm tolerance, and the integrated area was used for the quantitation analysis for each component. The limit of detection (LOD) was determined by serial dilution of samples, which the signal-to-noise ratio (S/N) was indicated by the software to be at least 3, while the limit of quantification (LOQ) was determined from the S/N to be >10.
3. Results and Discussion
3.1. RPLC and CN Column Comparison
The initial purpose for our study was to investigate whether the V1 dietary supplement contained cyclocreatine (4) or phosphocyclocreatine (5). The supplement facts panel on the packaging indicated five main ingredients: cyclocreatine phosphate, betaine anhydrous (trimethylglycine) (7), creatine phosphate, taurine (8), and glycocyamine (2) (Table 1). Assuming ingredient list guidelines were followed, it was inferred that cyclocreatine phosphate was the main ingredient in dietary supplement V1. However, the previously mentioned naming ambiguity made us uncertain if the compound was phosphocyclocreatine or the phosphoric acid salt of cyclocreatine. Because RPLC is most commonly used for HPLC separations, especially for a mixture of compounds containing unknowns, an Agilent Eclipse Plus C18 RRHD column was initially used for the separation on the Agilent 1290 HPLC-TOF (6230) system, and the total ions chromatography (TIC) results are shown in Figure S1A in the Supporting Information. Unfortunately, all of the compounds eluted at the beginning of the HPLC separation, even after optimization. We used the predicted m/z for the five components (Table 1) to extract the compounds through the TIC, and three of them were found at the same retention time due to nonseparation (Figure S1B), with trimethylglycine (7) being the most abundant compound. At this point, we realized RPLC was not an optimal separation mode due to the unsatisfactory separation results and the possibility of ion suppression limiting compound detection.
Table 1.
Component List for Vendor 1 Dietary Supplement
| compoundsa | mol. formula | predicted m/z(+)b |
|---|---|---|
| cyclocreatine | C5H9N3O2 | 144.0768 |
| trimethylglycine | CsH11NO2 | 118.0863 |
| creatine | C4H9N3O2 | 132.0768 |
| taurine | C2H7NO3S | 126.0219 |
| glycocyamine | C3H7N3O2 | 118.0611 |
As listed on supplement facts label.
Calculated using MassHunter software (Agilent Technologies).
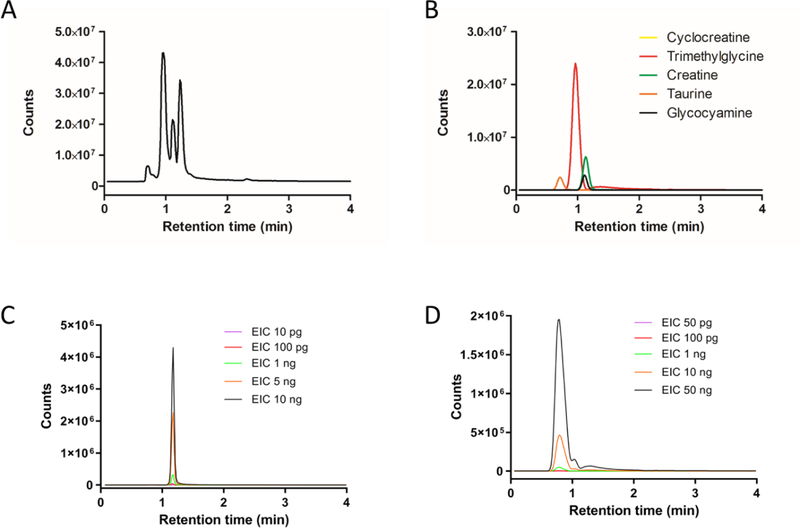
Hydrophilic interaction liquid chromatography (HILIC) is an alternative technique to RPLC that utilizes a hydrophilic stationary phase in conjunction with a highly organic mobile phase for the analysis of polar small molecules.21,22 Recently, HILIC-MS based methods have been applied to the analysis of food products, specifically the determination of creatinine, uric acid, and ascorbic acid in bovine milk and orange juice,23 as well as the analysis of metabolites within human urine.24 Additionally, the advantages of using a cyano column under HILIC conditions for determination of creatinine and hypoxanthine from urine samples were reported.25 The extremely hydrophilic nature of the main components within the dietary supplements as suggested by their structure and observed in the RPLC results led us to believe HILIC could be a potential solution for improving compound separation. After switching to a Phenomenex Luna CN column (30×4.60 mm, particle size 3 μm), we tested both HILIC mode and RPLC gradient elution mode for separation of the V1 dietary supplement with HILIC mode showing better results. After a serial optimization, we found that the best separation was achieved under isocratic conditions with 60% B and 40% A (60% acetonitrile, 40% water, and 0.1% formic acid), shown as Figure 2A. The same m/z search was performed to determine the presence of the five main components, and the improved separation enabled four of them to be observed (Figure 2B). In addition to resolving four components, the peak intensity and integrated area increased several fold as a consequence of better separation and less ionization suppression (Figures 2B and S1B). All four identified compounds were selected to evaluate the HPLC-MS system. The RSDs of retention time and integrated area were excellent across four consecutive analyses (Table 2), with all RSDs for RT being < 0.3% and the RSD for integrated area being < 1.5%, except for glycocyamine (3.9%). Creatine (1) and creatinine (6) standards were utilized to validate the compound identity by matching retention time and m/z (Figures S2 and S3). Phosphocreatine was not observed by HPLC-MS in positive mode and its absence from the V1 sample was confirmed by also running in negative mode (Figure S4). The reproducibility was confirmed by conducting the experiments on three different days. The RSDs for RT were < 2.5%, while the RSDs for integrated area were < 6%, except creatine which was 14.2% (Table 2). Interestingly, the critical components of interest, cyclocreatine (4) and phosphocyclocreatine (5), were not found within the mixture even when using the better separation of the HILIC method.
Figure 2.
HPLC-TOF MS analysis of Vendor 1 (V1) product using Cyano (CN) column analysis: (A) total ions chromatograms (TIC) of V1 product injection (1 μg); (B) extracted ions chromatograms (EIC) of the five main components listed on V1 package using the predicted m/z; (C) EIC of cyclocreatine for V1 samples, 1 μg aliquots spiked with 10 pg, 100 pg, 1 ng, 5 ng, and 100 ng of cyclocreatine standard; (D) EIC of phosphocyclocreatine for V1 samples, 1 μg aliquots spiked with 50 pg, 100 pg, 1 ng, 10 ng, and 50 ng of phosphocyclocreatine standard. The ion extraction based on the predicted m/z was at 20 ppm tolerance.
Table 2.
Analysis of Retention Time and Integrated Area for Vendor 1 Dietary Supplementa
| retention time (RT; min) | integrated area (IA) | |||||
|---|---|---|---|---|---|---|
| component | avg (n = 4) | RSD% (intraday) | RSD% (interday) | avg (n = 4) | RSD% (intraday) | RSD% (interday) |
| trimethylglycine | 0.97 | 0.21 | 1.57 | 1.89 × 10⁸ | 0.29 | 1.78 |
| creatine | 1.13 | 0.18 | 0.63 | 4.27 × 10⁷ | 1.22 | 14.18 |
| taurine | 0.72 | 0.29 | 2.18 | 1.66 × 10⁷ | 1.24 | 1.03 |
| glycocyamine | 1.11 | 0.19 | 0.63 | 1.61 × 10⁷ | 3.93 | 5.54 |
Data analysis based on four consecutive HPLC (cyano column)-TOF MS experimental runs.
3.2. Cyclocreatine and Phosphocyclocreatine Spiked in Analysis
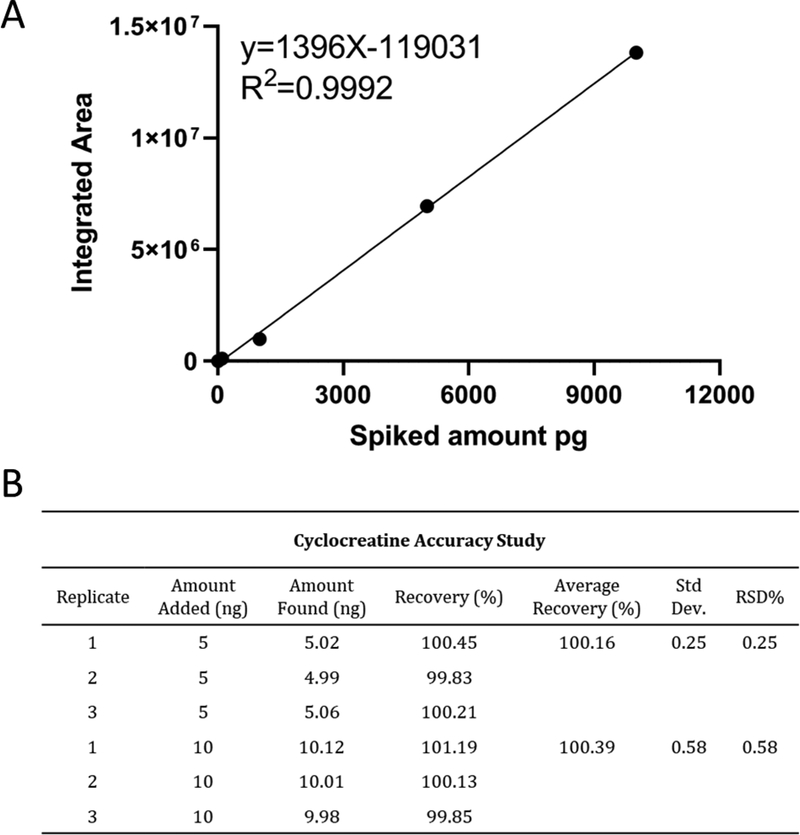
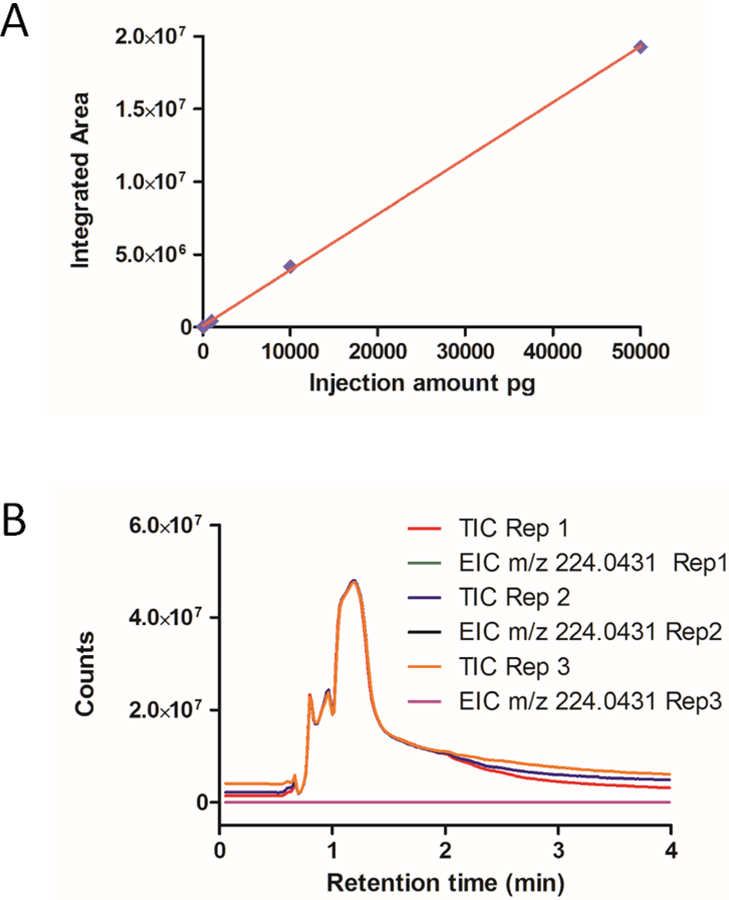
The unexpected lack of any observable cyclocreatine or phosphocyclocreatine signals when using the cyano column under optimized HPLC-TOF MS conditions prompted us to confirm the method sensitivity. This was accomplished by spiking standards of known amount into the V1 solution prior to HPLC-MS analysis in order to determine the sensitivity and linearity of the analysis. A serial dilution of cyclocreatine was spiked into aliquots of the V1 stock solution so that 1 jg injections of spiked V1 samples would contain varied but known quantities of the cyclocreatine standard (10 pg, 100 pg, 1 ng, 5 ng, or 10 ng). The extracted ions chromatograms (EIC) of cyclocreatine at 10 pg showed the emergence of a significant peak with S/N >15. We extracted the cyclocreatine peak from all five spiked V1 samples using the integrated area for quantitation curve analysis, shown in Figure 2C and Figure 3A. The results exhibited excellent linear regression from 10 pg to 10 ng of spiked cyclocreatine, and we deemed it unnecessary to test at higher concentrations. By selecting the 5 and 10 ng spiked samples, we performed three consecutive runs using the developed HILIC-MS method. The quantitation curve was used to calculate the method accuracy, and results (Figure 3B) showed that the accuracy is from 100.16% to 100.39%, with RSD% at 0.25% and 0.58%, respectively. Because no cyclocreatine peak was observed when 1 μg of the stock V1 sample was injected, we proceeded with a 40 μg injection using the same developed method to increase the potential of detecting cyclocreatine within the supplement. Even at this higher injection amount, the EIC did not show a discernible cyclocreatine peak (Figure S5), indicating that, if cyclocreatine is present in the 40 μg V1 sample, it is in an amount less than 10 pg, which is <0.25 ppm. The spiked analysis of V1 was also performed with phosphocyclocreatine at 50 pg, 100 pg, 1 ng, 10 ng, and 50 ng, demonstrating an LOQ of ~ 50 pg. The EIC provided no observable peak for phosphocyclocreatine at either 1 or 40 μg injections of the V1 product.
Figure 3.
HPLC-TOF MS analysis of cyclocreatine (4) spiked into V1 product. (A) calibration curve for cyclocreatine-spiked V1 sample; (B) accuracy study for cyclocreatine in V1 sample. The recovery amount was analyzed from injection of 1 μg of V1 sample spiked with 5 ng and 10 ng of cyclocreatine.
3.3. Application of Method to Vendor 2 Dietary Supplement Analysis
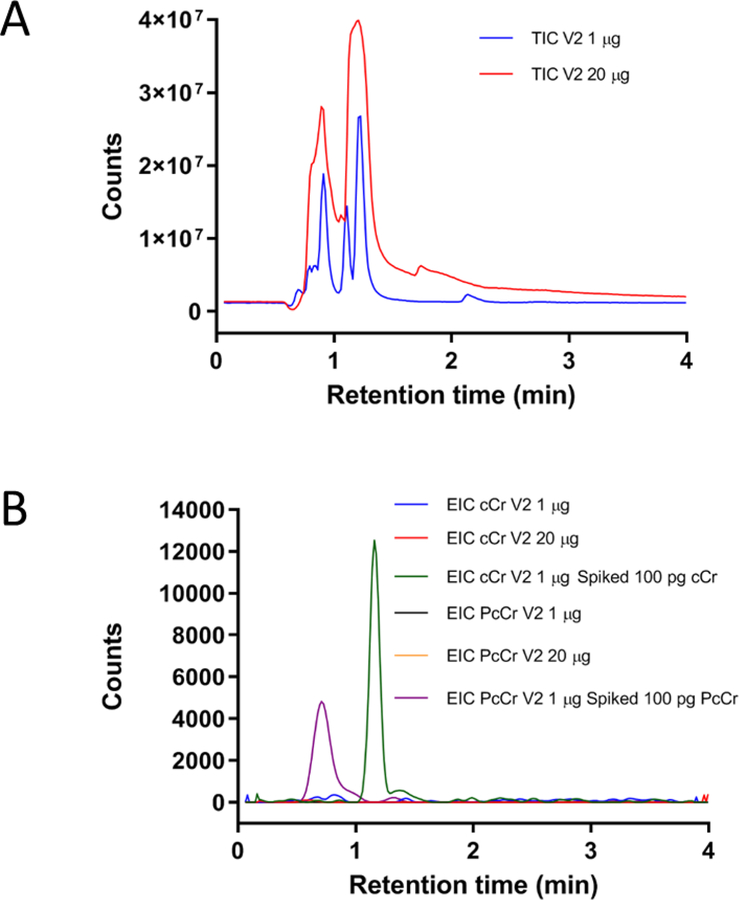
On the basis of the results obtained from analysis of the V1 dietary supplement, we considered it worthwhile to test another commercially available product from a different vendor (V2) claiming to contain 10% cyclocreatine. Using the developed method under the same analysis protocol, two different amounts of the V2 product (1 and 20 μg) were injected, but no detectable cyclocreatine or phosphocyclocreatine peak was seen for any of the experimental runs (Figure 4). Subsequent spiking analysis of the V2 product was performed to determine sensitivity. Injections of 1 μg of the V2 product spiked with either 100 pg of cyclocreatine or phosphocyclocreatine produced an observable reference peak maintaining the S/N of >750 and >52, respectively, for all four consecutive runs. Despite claims of cyclocreatine or phosphocyclocreatine as a major component, it was determined that, if either compound is present, they exist at < 5 ppm within the dietary supplements.
Figure 4.
HPLC-TOF MS analysis of Vendor 2 (V2) product. (A) TIC of V2 product injected at two different volumes: 1 μg (blue) and 20 μg (red); (B) EIC comparison of cyclocreatine (4) and phosphocyclocreatine (5) injections: 1 μg of stock V2 sample (blue, cCr; black, PcCr), 20 μg of stock V2 sample (red, cCr; orange, PcCr), and 1 μg of stock sample spiked with 100 pg of the cCr standard (green) and 100 pg of the PcCr standard (purple). The ion extraction based on the m/z of 144.0768 for cCr and m/z of 224.0431 for PcCr were within 20 ppm tolerance.
Interestingly, a major peak was found in both dietary supplements having the same m/z of 114.0662. The use of database searching and prediction software indicated that the unknown compound was creatinine (6), a cyclic derivative of creatine, which was confirmed by RT matching with a purchased standard (Figure S3). The integrated EIC peak area from the HPLC-MS analysis was used for the estimation of each component percentage. This relative quantitation is only used for an estimation because ionization efficiency varies from compound to compound. The summarized information is shown in Table 3, and apparently, the creatinine is the main component (70.97%) in V2 product while the trimethylglycine is the main component (45.8%) in V1 product.
Table 3.
HPLC-TOF MS Analysis of Two Commercial Cyclocreatine-Related Dietary Supplements
| Vendor 1 product | Vendor 2 product | |||
|---|---|---|---|---|
| compound | integrated area (IA) | ratioa (%) | integrated area (IA) | ratioa (%) |
| cyclocreatine | N/Ab | N/A | N/Ab | N/A |
| trimethylglycine | 1.89 × 10⁸ | 45.8 | 6.33 × 10⁶ | 4.2 |
| creatine | 4.33 × 10⁷ | 10.5 | 3.74 × 10⁷ | 24.8 |
| taurine | 1.68 × 10⁷ | 4.1 | 4.10 × 10⁴ | 0.02 |
| glycocyamine | 1.64 × 10⁷ | 4.0 | 1.77 × 10⁴ | 0.01 |
| creatinine | 1.47 × 10⁸ | 35.6 | 1.07 × 10⁸ | 70.97 |
Relative quantification using integrated peak area of extracted ion chromatogram (EIC) from LC-MS regardless of ionization efficiency.
Compound not detected within sample.
In summary, two commercially available dietary supplements claiming to contain “cyclocreatine” or “cyclocreatine phosphate” were analyzed to determine component composition. The primary components listed in the supplement facts are amino acids and structurally related compounds possessing similar characteristics, making content analysis challenging. Initial tests using RPLC were not successful as the hydrophilic characteristics of the compounds caused them all to elute at the start of RPLC separation. The use of a cyano column improved elution time with both RPLC and HILIC modes, but evaluation of separation capabilities showed HILIC mode had superior performance. After optimization, a final elution protocol using isocratic elution at 60% ACN/40% water with 0.1% formic acid provided good separation for four of the five main components within the V1 product. Surprisingly, none of the observed peaks corresponded with cyclocreatine (4) or phosphocyclocreatine (5). Using spiked samples, linearity for cyclocreatine signal in the presence of other components was demonstrated in the range of 10 pg to 10 ng with the LOQ of 10 pg (S/N >15). Similar results were achieved for phosphocyclocreatine with the LOQ of 50 pg, shown as Figure 5. Even with increased injection quantities of the V1 and V2 products, cyclocreatine was still not detectable; if it is present in the dietary supplements, it is at quantities less than 0.25 and 5 ppm, respectively. Additionally, similar analysis results for phosphocyclocreatine within the V1 and V2 products indicate that it exists at less than 1.25 and 5 ppm, respectively. Overall, we have developed a straightforward and practical HPLC-MS method for the separation of a complex mixture of amino acids, enabling the identification and quantitation of cyclocreatine, phosphocyclocreatine, and related compounds present within the sample.
Figure 5.
HPLC-TOF MS analysis of phosphocyclocreatine (5) spiked into V1 product. (A) calibration curve for phosphocyclocreatine-spiked V1 sample; (B) TIC and EIC results for three consecutive V1 injections of 40 μg each. The ion extraction based on the m/z of 224.0431 was within 20 ppm tolerance.
Supplementary Material
Acknowledgments
We thank Dr. Anton Simeonov for critical review of the manuscript.
Funding
This work was supported by the Intramural Research Programs of the National Center for Advancing Translational Sciences, National Institutes of Health.
Footnotes
Supporting Information
The Supporting Information is available free of charge on the ACS Publications website at DOI: 10.1021/acs.jafc.9b01878.
C18 RPLC chromatograms, single standard analysis of creatine, creatinine, and phosphocreatine, EIC of 40 μg injections of the V1 sample spiked with cyclocreatine, experimental procedure for synthesizing phosphocyclocreatine, and 1H and 31P NMR spectra of phosphocyclocreatine.
The authors declare no competing financial interest.
References
- 1.van de Kamp JM; Mancini GM; Salomons GS X-linked creatine transporterdeficiency: clinical aspects and pathophysiology. J. Inherit. Metab. Dis 2014, 37, 715–733. [DOI] [PubMed] [Google Scholar]
- 2.Salomons GS; van Dooren SJ; Verhoeven NM; Marsden D; Schwartz C; Cecil KM; DeGrauw TJ; Jakobs C X-linked creatine transporter defect: an overview. J. Inherit. Metab.Dis. 2003, 26, 309–318. [DOI] [PubMed] [Google Scholar]
- 3.Kurosawa Y; Degrauw TJ; Lindquist DM; Blanco VM; Pyne-Geithman GJ; Daikoku T; Chambers JB; Benoit SC; Clark JF Cyclocreatine treatment improves cognition in mice with creatine transporter deficiency. J. Clin. Invest 2012, 122, 2837–2846. [DOI] [PMC free article] [PubMed] [Google Scholar]
- 4.Folin O On the determination of creatinine and creatine in blood, milk and tissues. J. Biol. Chem 1914, 17, 475–482. [Google Scholar]
- 5.Eggleton P; Elsden SR; Gough N The estimation of creatine and of diacetyl. Biochem. J 1943, 37, 526–529. [DOI] [PMC free article] [PubMed] [Google Scholar]
- 6.Conn RB Jr. Fluorimetric determination of creatine. Clin. Chem 1960, 6, 537–548. [PubMed] [Google Scholar]
- 7.Greenberg N; Roberts WL; Bachmann LM; Wright EC; Dalton RN; Zakowski JJ; Miller WG Specificity characteristics of 7 commercial creatinine measurement procedures by enzymatic and Jaffe method principles. Clin. Chem 2012, 58, 391–401. [DOI] [PubMed] [Google Scholar]
- 8.Wiseman RW; Moerland TS; Chase PB; Stuppard R; Kushmerick MJ High-performance liquid chromatographic assays for free and phosphorylated derivatives of the creatine analogues beta-guanidopropionic acid and 1-carboxy-methyl-2-iminoimidazolidine (cyclocreatine). Anal. Biochem 1992, 204, 383–389. [DOI] [PubMed] [Google Scholar]
- 9.Ally A; Park G Rapid determination of creatine, phosphocreatine, purine bases and nucleotides (ATP, ADP, AMP, GTP, GDP) in heart biopsies by gradient ion-pair reversed-phase liquid chromatography. J. Chromatogr 1992, 575, 19–27. [DOI] [PubMed] [Google Scholar]
- 10.Leung EM; Chan W A novel reversed-phase HPLC method for the determination of urinary creatinine by pre-column derivatization with ethyl chloroformate: comparative studies with the standard Jaffe and isotope-dilution mass spectrometric assays. Anal. Bioanal. Chem 2014, 406, 1807–1812. [DOI] [PubMed] [Google Scholar]
- 11.Cognat S; Cheillan D; Piraud M; Roos B; Jakobs C; Vianey-Saban C Determination of guanidinoacetate and creatine in urine and plasma by liquid chromatography-tandem mass spectrometry. Clin. Chem 2004, 50, 1459–1461. [DOI] [PubMed] [Google Scholar]
- 12.Carling RS; Hogg SL; Wood TC; Calvin J Simultaneous determination of guanidinoacetate, creatine and creatinine in urine and plasma by un-derivatized liquid chromatography-tandem mass spectrometry. Ann. Clin. Biochem 2008, 45, 575–584. [DOI] [PubMed] [Google Scholar]
- 13.Boenzi S; Rizzo C; Di Ciommo VM; Martinelli D; Goffredo BM; la Marca G; Dionisi-Vici C Simultaneous determination of creatine and guanidinoacetate in plasma by liquid chromatography-tandem mass spectrometry (LC-MS/MS). J. Pharm. Biomed. Anal 2011, 56, 792–798. [DOI] [PubMed] [Google Scholar]
- 14.Wang J.-m.; Chu Y; Li W; Wang X.-y.; Guo J.-h.; Yan L.-l.; Ma X.-h.; Ma Y.-l.; Yin Q-h.; Liu C.-x. Simultaneous determination of creatine phosphate, creatine and 12 nucleotides in rat heart by LC-MS/MS. J. Chromatogr. B Analyt. Technol. Biomed. Life Sci 2014, 958, 96–101. [DOI] [PubMed] [Google Scholar]
- 15.Fernández-Fernández M; Rodríguez-González P; Añón Álvarez ME; Rodríguez F; Menéndez FV; García Alonso JI Simultaneous determination of creatinine and creatine in human serum by double-spike isotope dilution liquid chromatography-tandem mass spectrometry (LC-MS/MS) and gas chromatography-mass spectrometry (GC-MS). Anal. Chem 2015, 87, 3755–3763. [DOI] [PubMed] [Google Scholar]
- 16.Wang AQ; Hughes E; Huang W; Kerns EH; Xu X Quantification of cyclocreatine in mouse and rat plasma using hydrophilic-interaction ultra-performance liquid chromatography-tandem mass spectrometry. J. Pharm. Biomed. Anal 2017, 145, 629–633. [DOI] [PMC free article] [PubMed] [Google Scholar]
- 17.Struys EA; Jansen EEW; Ten Brink HJ; Verhoeven NM; Van der Knaap MS; Jakobs C An accurate stable isotope dilution gas chromatographic-mass spectrometric approach to the diagnosis of guanidinoacetate methyltransferase deficiency. J. Pharm. Biomed. Anal 1998, 18, 659–665. [DOI] [PubMed] [Google Scholar]
- 18.Fingerhut R Stable isotope dilution method for the determination of guanidinoacetic acid by gas chromatography/mass spectrometry. Rapid Commun. Mass Spectrom 2003, 17, 788–793. [DOI] [PubMed] [Google Scholar]
- 19.See HH; Schmidt-Marzinkowski J; Pormsila W; Morand R; Krahenbuhl S; Hauser PC Determination of creatine and phosphocreatine in muscle biopsy samples by capillary electrophoresis with contactless conductivity detection. Anal. Chim. Acta 2012, 727, 78–82. [DOI] [PubMed] [Google Scholar]
- 20.Annesley TM; Walker JB Cyclocreatine Phosphate as a Substitute for Creatine Phosphate in Vertebrate Tissues. Energetic Considerations. Biochem. Biophys. Res. Commun 1977, 74, 185–190. [DOI] [PubMed] [Google Scholar]
- 21.Alpert AJ Hydrophilic-interaction chromatography for the separation of peptides, nucleic acids and other polar compounds. J. Chromatogr 1990, 499, 177–196. [DOI] [PubMed] [Google Scholar]
- 22.Zuo Y; Zhou S; Zuo R; Shi T; Yang Y; Henegan P Hydrophilic interaction liquid chromatography: Fundamentals and applications In High-performance liquid chromatography (HPLC): Principles, procedures and practices; Zuo Y, Ed.; Nova Science Publishers Inc.: New York, 2014, pp. 1–22. [Google Scholar]
- 23.Zuo R; Zhou S; Zuo Y; Deng Y Determination of creatinine, uric and ascorbic acid in bovine milk and orange juice by hydrophilic interaction HPLC. Food Chemistry 2015, 182, 242–245. [DOI] [PubMed] [Google Scholar]
- 24.Zuo Y; Yang Y; Zhu Z; He W; Aydin Z Determination of uric acid and creatinine in human urine using hydrophilic interaction chromatography. Talanta 2011, 83, 1707–1710. [DOI] [PubMed] [Google Scholar]
- 25.Zhou S; Zuo R; Zhu Z; Wu D; Vasa K; Deng Y; Zuo Y An eco-friendly hydrophilic interaction HPLC method for the determination of renal function biomarkers, creatinine and uric acid, in human fluids. Anal. Methods 2013, 5, 1307–1311. [Google Scholar]
Associated Data
This section collects any data citations, data availability statements, or supplementary materials included in this article.


