

Abstract
Background:
There is widespread interest in programs aiming to reduce spending and improve quality among “super-utilizers,” patients with very high use of healthcare services. The Camden Coalition of Healthcare Providers’ (the Coalition) “Hotspotting” program has received national attention as a promising super-utilizer intervention and has been expanded to cities around the country. In the months following hospital discharge, a team of nurses, social workers and community health workers visit enrolled patients to coordinate outpatient care and to link them with social services.
Methods:
We randomized 800 medically and socially complex hospitalized patients, all with at least one additional hospitalization in the prior six months, to the Coalition’s care transition program or to usual care. The primary outcome was hospital readmission within 180 days post-discharge.
Results:
The 180-day readmission rate was 61.7 percent in the control group and 62.3 percent in the intervention group. The adjusted difference between the groups was not significant (0.82 percentage points, 95% CI −5.97 to 7.61). By contrast, comparing the intervention-group admissions during the six months before and after enrollment misleadingly suggested a 38 percentage point decline in admissions from the intervention, because it did not account for the similar decline in the control group.
Conclusions:
In this randomized controlled study of patients with very high use of healthcare services, readmission rates were not lower for patients randomized to the Coalition’s program compared to usual care. (Funded by the National Institute on Aging, J-PAL North America, and MIT Sloan School of Management; ClinicalTrials.gov number, and the American Economic Association registry number, AEARCTR-0000329.)
Introduction
Healthcare spending in the United States is heavily concentrated. Five percent of the population accounts for 50 percent of annual spending; one percent accounts for almost one-quarter of annual spending.1 There is therefore substantial interest in interventions that can reduce spending and improve quality by targeting “super-utilizers” of the healthcare system. Such programs have received considerable positive media attention2–7 as well as support from the federal government.8,9
Since being profiled in Atul Gawande’s seminal New Yorker article, “The Hot Spotters”,10 the Camden Coalition of Healthcare Provider’s (the Coalition’s) program has been the flagship example of a promising super-utilizer program. The Coalition’s Camden Core Model uses real-time data on hospital admissions to identify super-utilizer patients, an approach referred to as “hotspotting.” Focusing on patients with chronic conditions and complex needs, and starting with the premise that the standard system is difficult to navigate for these patients, the program uses a high-touch, face-to-face care model to engage patients and connect them to appropriate medical care, government benefits, and community services, with the aim of improving health and reducing unnecessary utilization.
The program has been heralded as a promising, data-driven, relationship-based, intensive care management program for super-utilizers, and federal funding has expanded versions of the model to other cities.7–16 To date, however, the only evidence of its impact is a pre-post analysis of the healthcare spending of 36 participants17 and an evaluation of four expansion sites comparing 149 program participants with propensity-score matched controls.18 More broadly, there are a number of promising observational studies of other super-utilizer programs.12,17,19–21 However, regression to the mean—the tendency for patients selected as exceptionally high-cost at a moment in time to move closer to average cost over time—may bias observational studies of super-utilizer programs towards spurious results.22,23
Although there is limited rigorous evidence of the effectiveness of super-utilizer programs, several randomized trials of care transition programs—which, like the Camden Core Model, start with patients in the hospital and work with them post-discharge—find substantially reduced readmissions.24–29 However, the Camden Core Model targets a much more heterogeneous population with greater social and medical complexity and substantially higher healthcare utilization. Therefore, the Coalition partnered with the investigators to design a prospective randomized evaluation of this nationally-recognized program.
Methods
Study Design
This trial was an investigator-initiated, randomized controlled study. It received IRB approval from Cooper University Hospital, the National Bureau of Economic Research, Kennedy Health, and Our Lady of Lourdes Medical Center; it was registered at clinicaltrials.gov30 () and the American Economic Association registry (AEARCTR-0000329).31 The trial protocol and planned analyses were publicly pre-specified in March 201431 in consultation with Dr. Brenner, then director of the Coalition. Minor departures from the pre-analysis plan are described in the supplemental appendix. The Coalition staff implemented the protocols and administered the intervention for the treatment group, but was blinded to results prior to trial completion.
Program
Eligibility:
The Camden Core Model is a care transition program designed to improve patient health and reduce hospital use among some of the least healthy and most vulnerable adults in the United States. Eligibility is limited to adults (ages 18 to 80) living in Camden, NJ, one of the most economically depressed and violent cities in the country;10 in 2017, 37 percent of Camden residents lived below the poverty line, compared to 15 percent nationally.32
The intervention targeted super-utilizers of the healthcare system—individuals with medically and socially complex needs who have frequent hospital admissions. The inclusion criteria were: at least one hospital admission at any of four Camden-area hospital systems in the six months prior to the index admission when patients were enrolled, at least two chronic conditions, and at least two of the following: at least five active outpatient medications, difficulty accessing services, lack of social support, a mental health comorbidity, an active drug habit, or homelessness. Patients were excluded if they were uninsured, cognitively impaired, an oncology patient, or admitted for a surgical procedure for an acute problem, for mental health care (with no comorbid physical health conditions), or for complications of a progressive chronic disease with limited treatments. The eligible population was less than one-half of one percent of the Camden population but accounted for 11 percent of Camden hospital expenditures (see supplementary appendix).
Intervention:
The time-limited intervention had intensive clinical and social components. Patients were enrolled while in the hospital. Once they returned home, they were engaged by a multidisciplinary team including registered nurses, social workers, licensed practical nurses, community health workers, and health coaches. The team conducted home visits, scheduled and accompanied participants to initial primary and specialty care visits, coordinated follow-up care and medication management, conducted blood pressure and blood sugar checks, coached participants in disease-specific self-care, and helped participants apply for social services and appropriate behavioral health programs. The intervention contained many characteristics considered important for successful care transition programs for high-cost, high-need patients.33,34 See supplemental appendix for more detail on the intervention.
The control group received usual post-discharge care, that may have included home healthcare services or other outreach; we are unable to measure such services.
Recruitment and Randomization protocols
The study added consent and randomization to the Coalition’s pre-existing protocol. Recruitment took place at the two major hospitals: Cooper University Hospital and Our Lady of Lourdes Hospital. Using the Camden Coalition Health Information Exchange database—which provided daily updates from hospital electronic medical records from Cooper, Lourdes, Virtua, and Kennedy Health (as of July 2014)—staff selected potentially eligible patients, who formed the triaged population. A Coalition recruiter approached triaged patients in the hospital, confirmed eligibility, obtained informed consent, and conducted a baseline survey. The recruiter then used a tamper-proof and externally-recorded randomization process to assign treatment or control status and informed the patient. All patients completing the baseline survey were compensated $20 for their time. See supplemental appendix for more details.
We piloted the study from March 29, 2014 to May 30, 2014. The study population was enrolled from June 2, 2014 through September 13, 2017.
Of the 1,520 patients triaged, recruiters deemed 1,442 eligible and consented 809; half were randomized to treatment. Subsequently, five consented patients were excluded at their request; the last four patients enrolled were excluded to reach the target study population of 800 (Figure 1).
Figure 1: Consort Diagram.
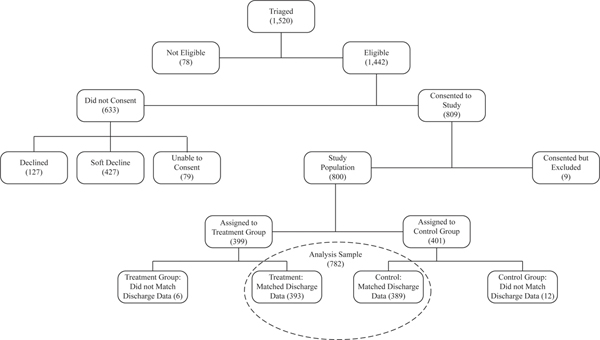
Notes: Data are from the Health Information Exchange. “Declined” indicates the patient explicitly said no to the offer of randomization. “Soft Decline” indicates that the patient did not give consent when approached, but did not decline and could be reapproached during future hospitalizations if otherwise eligible. “Unable to Consent” indicates that the patient was discharged (or died) before they were reached or that they were unable to consent for reasons such as being asleep. “Consented but Excluded” includes five patients who consented and later asked to be removed and the last 4 patients enrolled in the study who were excluded to keep the study population at the 800 person target.
Data
The primary data were hospital discharge data through March 31, 2018 from the four Camden hospital systems; these accounted for 98 percent of NJ hospital discharges for Camden residents (see supplemental appendix). The discharge data contained admission and discharge dates, diagnoses, discharge destination, charges and payments received, as well as patients’ identifying information.
We supplemented these data with several sources. The Camden Coalition Health Information Exchange database contained additional demographic information and a record of the study participant’s index admission (where recruitment occurred). We matched 782 (98 percent) to the discharge record for their index admission; match rates were balanced between treatment and control (Table 1). The baseline survey provided additional socio-economic information on consented patients. The Coalition recorded staff engagements with patients in the treatment group. NJ administrative data measured social services receipt (specifically Supplemental Nutrition Assistance Program, Temporary Assistance for Needy Families, and General Assistance) and the National Death Index provided mortality data. See supplemental appendix for additional details.
Table 1:
Summary Statistics
| Overall | Treatment | Control | |
|---|---|---|---|
| Study Population (N=800): | |||
| Index Admission Match Rate (%) | 97.8 | 98.5 | 97.0 |
| Analysis Sample (N=782): | |||
| Observations | 782 | 393 | 389 |
| Male (%) | 50.0 | 52.4 | 47.6 |
| Age at index admission (%) | |||
| <44 | 17.1 | 16.0 | 18.3 |
| 45–64 | 55.4 | 55.0 | 55.8 |
| >65 | 27.5 | 29.0 | 26.0 |
| Race (%) | |||
| African American Non-Hispanic | 54.9 | 57.8 | 51.9 |
| Hispanic | 29.5 | 26.7 | 32.4 |
| White Non-Hispanic | 15.1 | 14.8 | 15.4 |
| Asian / Multiracial / Other | 0.5 | 0.8 | 0.3 |
| Number of inpatient admissions prior to the index admission | |||
| 0–6 months prior | 1.75 | 1.72 | 1.78 |
| 7–12 months prior | 0.74 | 0.74 | 0.75 |
| Primary payer (%) | |||
| Medicaid | 44.6 | 43.0 | 46.3 |
| Medicare | 48.2 | 47.6 | 48.8 |
| Other | 7.0 | 9.2 | 4.9 |
| Employment status (%) | |||
| Currently Employed | 5.5 | 4.8 | 6.2 |
| No response | 0.5 | 0.3 | 0.8 |
| Mental health diagnoses at index admission (%) | |||
| Depression | 30.2 | 32.3 | 28.0 |
| Substance Abuse | 44.0 | 41.2 | 46.8 |
Notes: “Study Population” and “Analysis Sample” are defined in Figure 1. Within “Analysis Sample,” data on gender, age, number of admissions prior to index, and mental health diagnoses are from the hospital discharge data. Race, primary payer, and employment status come from the baseline survey. The analysis sample excluded 18 participants with missing outcome data because they could not be matched to the discharge record for their index admission.
Outcomes
The primary outcome was readmission within 180 days post discharge. Secondary outcomes were the number of readmissions, proportion of patients with 2 or more readmissions, hospital days, charges, payments received, and mortality—all measured 180 days post discharge—as well as readmission rates at other time horizons. We also analyzed the primary outcome by pre-specified subgroups. With the exception of social services receipt and mortality, all outcomes were based on hospital discharge data.
Statistical Analyses
We used linear regressions to compare outcomes for treatment and control patients. To increase precision, we included pre-specified covariates: age (in five-year bins), gender, indicators for non-Hispanic African American and for Hispanic, and measures of utilization in the 0–6 and 7–12 months prior to the index admission. We also report the unadjusted difference. We conducted sensitivity analysis using multiple imputation to account for missing outcome data for 18 participants who could not be matched to the discharge record for their index admission.35
Prior to the pilot, we calculated that a study population of 800 would provide statistical power to detect a 9 percentage point decline in the 180 day readmission rate (80% power, two-sided test size 0.05).31 Data from the pilot on the actual study population—whose readmission rate was twice what we had assumed—indicated power to detect a 9.6 percentage point decline in the primary outcome (see supplemental appendix). There was no pre-specified plan to adjust for multiple comparisons; therefore, we report p-values only for the primary outcome and report 95 percent confidence intervals without p-values for all secondary outcomes. The confidence intervals have not been adjusted for multiple comparisons and inferences drawn from them may not be reproducible.
Results
Study population
The study population averaged 1.8 hospital admissions in the six months prior to the index admission, (Table 1) compared to less than 0.1 in the general adult Camden population (see supplemental appendix). The study population was 50 percent male; 40 percent were under 55, and 30 percent were over 65; 55 percent were non-Hispanic African American, 30 percent were Hispanic, and 15 percent were non-Hispanic white. Our pre-specified covariates were balanced between treatment and control (Table S2).
Tables S1 and S2 show that three-quarters of the study population were unmarried, one-half had less than a high school degree, and three-fifths reported needing help with mobility. Almost the entire population (95 percent) was not employed, and 40 percent were diagnosed with substance abuse during the index admission. 48 percent had Medicare as their primary payer, and 45 percent had Medicaid as their primary payer.
Program implementation
Table 2 presents measures of program implementation. Ninety-five percent of the treatment group had at least three encounters with program staff after enrollment; on average, a patient received 7.6 home visits, 8.8 phone calls from staff, and was accompanied on 2.5 physician visits. Ninety percent worked with the Coalition for more than 30 days; median program duration was 92 days. The Coalition set ambitious timing goals36: a home visit from program staff within 5 days of arriving home, and a provider visit within 7 days of arriving home; 60 percent met the first goal, 36 percent met the second, and 28 percent met both. Three quarters received both a home visit within 14 days and a provider visit within 60 days.
Table 2:
Program Metrics and Benefit Participation
| Program Metrics for Treatment Group | ||||
| Number of Encounters | Mean | Median | At least 1 encounter (%) | At least 3 encounters (%) |
| Home visits | 7.6 | 5 | 88.8 | 70.7 |
| Phone calls | 8.8 | 5 | 88.0 | 65.4 |
| Primary care physician (PCP) and specialist visits | 2.5 | 2 | 84.7 | 29.5 |
| Other types of visits | 5.7 | 1 | 65.1 | 36.1 |
| Total encounters | 28.1 | 17 | 98.7 | 95.2 |
| Length of Intervention (measured from discharge home) | Greater than 30 days (%) | Greater than 90 days (%) | Greater than 180 days (%) | Median number of days |
| 89.8 | 50.5 | 17.0 | 91.5 | |
| Timing of Services (measured from discharge home) (%) | ||||
| Camden Coalition home visit within 5 days | 58.6 | |||
| Camden Coalition home visit within 14 days | 83.0 | |||
| Visited PCP/Specialist within 7 days | 36.0 | |||
| Visited PCP/Specialist within 14 days | 60.2 | |||
| Visited PCP/Specialist within 60 days | 83.3 | |||
| Both home visit within 5 days and PCP/Specialist visit within 7 days | 28.0 | |||
| Both home visit within 14 days and PCP/Specialist visit within 60 days | 76.1 | |||
| Benefit Participation during 6 months post enrollment | ||||
| Control (1) | Treatment (2) | Unadjusted Difference (95% CI) (3) | Adjusted Difference (95% CI) (4) | |
| Supplemental Nutrition Assistance Program (%) | 50.13 | 58.52 | 8.4 (1.43 to 15.36) | 4.59 (0.52 to 8.65) |
| Temporary Assistance for Needy Families (%) | 1.03 | 1.78 | 0.75 (−0.9 to 2.4) | 0.69 (−0.34 to 1.71) |
| General Assistance (%) | 6.94 | 6.87 | −0.07 (−3.63 to 3.49) | 0.68 (−1.82 to 3.18) |
Notes: Data on program metrics are from the Camden Coalition records and consist of the treatment group in the analysis sample (N=393). Data are missing for 4 participants for Timing of Services and 11 participants in Length of Intervention. Data about benefit participation are from the New Jersey Department of Human Services and consist of the analysis sample (N=782). Column (1) shows the mean value for each outcome in the control group, and column (2) shows the mean value for each outcome in the treatment group. Column (3) shows the coefficient (and 95% confidence interval in parentheses) on an indicator for treatment group from an ordinary least squares regression of the outcome with no other covariates. Column (4) shows the coefficient (and 95% confidence interval in parentheses) on an indicator for treatment group from an ordinary least squares regression of the outcome with pre-specified covariates. All confidence intervals are calculated using heteroskedasticity-robust standard errors. Pre-specified covariates include the dependent variable 0–6 months before the index admission, the dependent variable 7–12 months before the index admission, and indicators for age (in five-year bins), male, African-American non-Hispanic, Hispanic. The covariates are measured in the hospital discharge data except for race which is from the baseline survey.
Receipt of government benefits during the six months post discharge was the one metric of program implementation we observed for both treatment and control groups. Rates of participation in both Temporary Assistance for Needy Families and General Assistance were low and did not significantly change with the intervention; the adjusted difference in Supplemental Nutrition Assistance Program participation associated with the intervention was 4.6 percentage points (95% CI = 0.5 to 8.6).
Results from randomized evaluation
Table 3 shows results from the randomized evaluation. The 180-day readmission rate was 61.7 percent in the control and 62.3 percent in the treatment group. The intervention had no significant impact on this primary outcome: the adjusted difference in the probability of readmission was 0.82 percentage points higher in the treatment group relative to the control group (95% CI = −5.97 to 7.61; p-value = 0.81). This finding is robust to using multiple imputation to account for missing data (adjusted difference, 0.64 percentage points; 95% CI = −6.12 to 7.40, see Table S6). The intervention also had no impact on any of the secondary outcomes or within any of the pre-specified subgroups (Table 3).
Table 3:
Impact of Intervention, 180 days post discharge
| Control Mean (1) | Treatment Mean (2) | Unadjusted Difference (95% CI) (3) | Adjusted Difference (95% CI) (4) | |
|---|---|---|---|---|
| Analysis sample (N=782) | ||||
| Any readmission (%) | 61.70 | 62.34 | 0.64 (−6.17 to 7.46) | 0.82 (−5.97 to 7.61) |
| Number of readmissions | 1.54 | 1.52 | −0.02 (−0.29 to 0.26) | 0.01 (−0.25 to 0.27) |
| 2 or more readmissions (%) | 36.25 | 36.39 | 0.14 (−6.61 to 6.89) | 0.27 (−6.22 to 6.77) |
| Days in hospital | 9.95 | 9.36 | −0.59 (−2.49 to 1.31) | −0.32 (−2.17 to 1.53) |
| Hospital charges ($) | 114,768 | 116,422 | 1,654 (−25,523 to 28,831) | 3,722 (−23,438 to 30,882) |
| Hospital payments received ($) | 17,650 | 18,130 | 480 (−3,613 to 4,573) | 680 (−3,415 to 4,775) |
| Any readmission by subgroup (%) | ||||
| 2 admissions in prior year (N=336) | 52.12 | 52.63 | 0.51 (−10.2 to 11.22) | 0.78 (−10.35 to 11.91) |
| 3 + admissions in prior year (N=446) | 68.75 | 69.82 | 1.07 (−7.51 to 9.65) | 1.27 (−7.38 to 9.92) |
| English preferred language (N=638) | 63.11 | 62.61 | −0.49 (−8.01 to 7.02) | 0.1 (−7.42 to 7.61) |
| Other preferred language (N=144) | 56.25 | 60.94 | 4.69 (−11.58 to 20.96) | 8.49 (−9.08 to 26.06) |
Notes: Data consist of the analysis sample (N=782) and outcomes are measured in the hospital discharge data. Column (1) shows the mean value for each outcome in the control group. Column (2) displays the mean value for each outcome in the treatment group. Column (3) shows the coefficient (and 95% confidence interval in parentheses) on an indicator for treatment group from an ordinary least squares regression of the outcome with no other covariates. Column (4) shows the coefficient (and 95% confidence interval in parentheses) on an indicator for treatment group from an ordinary least squares regression of the outcome with pre-specified covariates. All confidence intervals are calculated using heteroskedasticity-robust standard errors. Pre-specified covariates include the number of admissions 0–6 months before the index admission, the number of admissions 7–12 months before the index admission, and indicators for age (in five-year bins), male, African-American non-Hispanic, Hispanic. The covariates are measured in the hospital discharge data except for race which is from the baseline survey. For three of the outcomes (days in hospital, hospital charges, and hospital payments received), we replace the number of admissions 0–6 months before index admission and 7–12 months before index admission with the values of the dependent variable over those two time periods. The p-value of the primary outcome (any readmission) for the adjusted difference is 0.81.
Results for the primary outcome were not sensitive to alternative specifications or measurement over alternative horizons. There were no significant effects of the intervention when the hazard rate of readmission (with either a Cox proportional model or competing risks model accounting for mortality), 180-day mortality, or post-hoc subgroups were analyzed; results differed slightly by hospital of index admission, but the estimates were quite imprecise (Tables S6, S8; Figure S5).
Pre-post analysis
Figure 2 shows average number of admissions per quarter. In both treatment and control groups, admissions rose sharply in the six months prior to the intervention and fell rapidly afterwards. Pre-post analysis within the treatment group is very sensitive to the definition of the pre-period. There was a 38 percentage point decline in the probability of a hospital admission in the six months post intervention compared to the six months prior to the intervention, but a 29 percentage point increase in the probability of a hospital admission in the six months post intervention compared to the period twelve to eighteen months prior to the intervention (Table S5).
Figure 2: Average Number of Inpatient Admissions per Quarter.
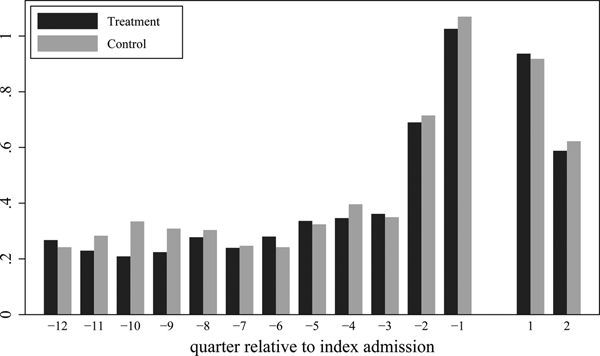
Notes: All data are from the hospital discharge data and cover the analysis sample (N=782). Treatment data (N=393) and Control data (N=389) are shown separately. The horizontal axis shows quarters relative to the index admission; quarter 1 is thus the quarter that begins with the discharge date from the index admission, while quarter −1 is the quarter ending the day before the index admission. The index admission is excluded from the figure.
Discussion
In this randomized evaluation of 800 study participants, the Camden Core Model had no significant effect on patients’ 180-day readmission rate. The 95 percent confidence intervals rule out a decline in readmission rates of more than 6 percentage points, compared to a control mean of 62 percent; this rules out the 15–45 percent reductions in readmissions in the Medicare population found in randomized evaluations of other care transition programs.24–29 The Camden Model targets a different population: younger, with more diverse medical needs, greater social complexity, and much higher healthcare utilization; prior hospital use is nearly twice that in most previous successful care transition programs.
Our results suggest challenges for super-utilizer programs aimed at medically and socially complex populations. This is consistent with randomized evaluations of care management programs of chronically ill, non-Medicare populations that have not found impacts on hospital admissions,37,38 although programs like these—which do not focus on the post-discharge transition—have also shown mixed results in a Medicare population.39 It is possible that care management approaches, designed to connect patients to existing resources, are insufficient for these complex cases. The Coalition’s model has continually adapted, and both they and others are exploring models involving more complete redesigns of care provision.6,40,41
Engagement with the program was high (95 percent had at least three encounters) and patients received an intensive intervention (averaging 7.6 home visits), but two program goals on the timing of services—home visit within 5 days and a provider’s office visit within 7 days—were achieved less than 30 percent of the time. Challenges in reaching these goals included patients without stable housing or phones, behavioral health complexities, and providers with few available appointments. The difficulties that this pioneering, data-driven organization had in achieving rapid assistance for patients may portend difficulties for achieving it at scale.
Our findings may also reflect fundamental challenges with the strategy of targeting today’s super-utilizers: many current high-cost patients will not be high-cost in the future—and this becomes even more pronounced as one goes higher in the cost distribution.22,42,43 Moreover, for those with persistent high costs, very little spending may be on potentially preventable hospitalizations.42–44
Such regression to the mean also underscores the importance of rigorous evaluation through randomized trials, as observational evaluations of super-utilizer programs will be prone to find spurious impacts.18,22,23 This danger was illustrated in our setting by the similar reduction in readmissions in both the treatment and control groups.
This study has several limitations. It was powered to detect whether this care transition program could achieve reductions in re-admissions comparable to similar programs focused on less-complex patients. But the study was not powered to detect smaller reductions that could be clinically meaningful, nor was it powered to analyze effects within specific sub-groups, where there could be differential impacts. The data did not permit evaluation of potential non-tangible benefits, such as improved relationships with providers.45 Nor did they allow comparison of outpatient care for treatment and control groups; usual care in Camden was evolving over the study period with multiple other care management programs starting46–49 and the Coalition leading a citywide campaign to connect patients to primary care within 7 days of discharge.50
Despite these limitations, this study provides rigorous evidence of the impact of a nationally recognized program aimed at super-utilizers of the healthcare system that has been expanded to other cities. The results suggest challenges in reducing readmissions in a medically and socially complex super-utilizer population, as well as the importance of randomized evaluation of interventions that, because they target high-cost patients, likely exhibit substantial regression to the mean in observational studies.
Disclosure forms provided by the authors are available with the full text of this article at NEJM.org.
Supplementary Material
Acknowledgements:
We are extraordinarily grateful to Dr. Jeffrey Brenner for making this study possible and for his input into the experimental protocol and pre-analysis plan. Martin Aragoneses, Rose Burnam, Bradley Clark, Grant Graziani, Erik James, Allyson Barnett Root, and John Tebes provided excellent research assistance, and Adam Baybutt, Mary-Alice Doyle, Laura Feeney, and Jesse Gubb provided excellent project management. We thank our excellent partners at the Camden Coalition of Healthcare Providers—and particularly Aaron Truchil, Stephen Singer, Kelly Craig, James Fisher, Alisha Patman, Itir Sonuparlak, Amadly Cruz, and Laura Buckley—for their patience, dedication, data expertise, and institutional knowledge. A particular thanks to Coalition recruiters Audrey Hendricks, Mary Pelak, Marisol Velazquez, Erica Foltz, Andrew Katz, Josie Martinez, Jason Turi and Margarita Santiago whose tireless work recruiting study participants was essential to the success of this research. This research was made possible by the individuals who agreed to participate in this study and who generously allowed us to analyze their health and social services data.
Funding: This study was funded by the National Institute on Aging of the National Institutes of Health under award number R01AG049897; J-PAL North America’s Health Care Delivery Initiative; and MIT’s Sloan School of Management. The findings and conclusions expressed are solely those of the authors and do not represent the views of their funders.
Footnotes
Publisher's Disclaimer: This file is the accepted version of your manuscript, and it shows any changes made by the Editor-in-Chief and the Deputy Editor since you submitted your last revision. This is the version that is being sent to Manuscript Editing for further editing in accordance with NEJM style. You will receive proofs of the edited manuscript, by e-mail. The proofs will contain queries from the manuscript editor, as well as any queries that may be present in this file. The proof stage will be your next opportunity to make changes; in the meantime, please do not make any changes or send any new material to us.
References
- 1.Cohen S The Concentration of Health Care Expenditures and Related Expenses for Costly Medical Conditions, 2012. Agency for Healthcare Research and Quality; 2014. [PubMed] [Google Scholar]
- 2.Weintraub K, Zimmerman R. Fixing the 5 Percent. The Atlantic [Internet] 2017;Available from: https://www.theatlantic.com/health/archive/2017/06/fixing-the-5-percent/532077/ [Google Scholar]
- 3.The Allen A. ‘Frequent Flier’ Program That Grounded a Hospital’s Soaring Costs [Internet]. Politico. 2017. [cited 2018 Sep 28];Available from: https://www.politico.com/magazine/story/2017/12/18/parkland-dallas-frequent-flier-hospital-what-works-216108 [Google Scholar]
- 4.Blumenthal SJ, Russell NS. Healing the Sickest Patients: How “Hot Spotters,” “Frequent Fliers,” and ‘Super-Utilizers” Impact Health Care in America’ [Internet]. Huffington Post. 2016. [cited 2018 Sep 18];Available from: https://www.huffpost.com/entry/healing-the-sickest-patie_b_8003826 [Google Scholar]
- 5.Sandra Boodman. Hospitals and insurers struggle to reduce costs by patients dubbed “super-utilizers” [Internet]. Wash. Post. 2013. [cited 2019 Sep 28];Available from: https://www.washingtonpost.com/national/health-science/hospitals-and-insurers-struggle-to-reduce-costs-by-patients-dubbed-super-utilizers/2013/10/07/2963b048-14ae-11e3-a100-66fa8fd9a50c_story.html?noredirect=on&utm_term=.4fde7c6c8efa [Google Scholar]
- 6.Boerner H Stanford’s Big Health Care Idea. Wash Mon 2017;10. [Google Scholar]
- 7.Gorenstein D Setting up shop where the sick are [Internet]. MarketPlace. 2013. [cited 2018 Sep 28];Available from: https://www.marketplace.org/2013/08/02/health-care/diagnosis-data/setting-shop-where-sick-are [Google Scholar]
- 8.Mann C Targetting Medicaid Super-Utilizers to Decrease Costs and Improve Quality [Internet]. Baltimore, Maryland: Centers for Medicare & Medicaid Services; 2013. [cited 2018 Sep 28]. Available from: https://www.medicaid.gov/federal-policy-guidance/downloads/cib-07-24-2013.pdf [Google Scholar]
- 9.Robert Wood Johnson Foundation. Expanding “Hot Spotting” to new Communities [Internet]. Robert Wood Johnson Foundation; 2012. [cited 2017 Sep 28]. Available from: http://forces4quality.org/node/5182.html [Google Scholar]
- 10.Gawande A The Hot Spotters. New Yorker [Internet] 2011. [cited 2018 Sep 28];Available from: https://www.newyorker.com/magazine/2011/01/24/the-hot-spotters [Google Scholar]
- 11.Crippen D, Isasi F. The Untold Story Of 2013: Governors Lead In Health Care Transformation [Internet]. Health Aff. Blog. 2013. [cited 2018 Sep 28];Available from: http://healthaffairs.org/blog/2013/12/17/the-untold-story-of-2013-governors-lead-in-health-care-transformation/ [Google Scholar]
- 12.Hong CSH, Siegel AL, Ferris TG. Caring for High-Need, High-Cost Patients: What Makes for a Successful Care Management Program? [Internet]. New York, NY United States: Commonwealth Fund; 2014. [cited 2018 Sep 26]. Available from: https://www.commonwealthfund.org/publications/issue-briefs/2014/aug/caring-high-need-high-cost-patients-what-makes-successful-care [PubMed] [Google Scholar]
- 13.Leiby R MacArthur Foundation awards 24 ‘genius grants’ [Internet]. Wash. Post. 2013. [cited 2018 Sep 28];Available from: https://www.washingtonpost.com/lifestyle/style/macarthur-foundation-awards-24-genius-grants/2013/09/24/d16de652-2555-11e3-ad0d-b7c8d2a594b9_story.html?utm_term=.468a59734490 [Google Scholar]
- 14.Vaida B For Super-Utilizers, Integrated Care Offers A New Path. Health Aff (Millwood) 2017;36(3):394–7. [DOI] [PubMed] [Google Scholar]
- 15.Center for Medicare & Medicaid Services. Health Care Innovation Awards: New Jersey [Internet]. [cited 2019 Apr 16];Available from: https://innovation.cms.gov/initiatives/health-care-innovation-awards/new-jersey.html
- 16.Center for Medicare & Medicaid Services. Health Care Innovation Awards: California [Internet]. [cited 2019 Apr 16];Available from: https://innovation.cms.gov/initiatives/health-care-innovation-awards/california.html
- 17.Green SR, Singh V, O’Byrne W. Hope for New Jersey’s City Hospitals: The Camden Initiative. Perspect Health Inf Manag 2010;Spring 2010. [PMC free article] [PubMed] [Google Scholar]
- 18.Sevak P, Stepanczuk CN, Bradley KWV, et al. Effects of a Community-Based Care Management Model for Super-Utilizers. Am J Manag Care 2018;24(11):e365–70. [PubMed] [Google Scholar]
- 19.Holahan J, Schoen C, McMorrow S. The Potential Savings from Enhanced Chronic Care Management Policies [Internet]. 2011;Available from: http://research.urban.org/uploadedpdf/412453-The-Potential-Savings-from-Enhanced-Chronic-Care-Management-Policies-Brief.pdf
- 20.Milstein A, Kothari PP. Are Higher-Value Care Models Replicable? [Internet]. Health Aff. Blog. 2009. [cited 2018 Sep 28];Available from: https://www.healthaffairs.org/do/10.1377/hblog20091020.002518/full/ [Google Scholar]
- 21.Lynch CS, Wajnberg A, Jervis R, et al. Implementation Science Workshop: a Novel Multidisciplinary Primary Care Program to Improve Care and Outcomes for Super-Utilizers. J Gen Intern Med 2016;31(7):797–802. [DOI] [PMC free article] [PubMed] [Google Scholar]
- 22.Johnson TL, Rinehart DJ, Durfee J, et al. For Many Patients Who Use Large Amounts Of Health Care Services, The Need Is Intense Yet Temporary. Health Aff (Millwood) 2015;34(8):1312–9. [DOI] [PubMed] [Google Scholar]
- 23.Katz MH. Trust but Verify (Ideally With a Randomized Clinical Trial). JAMA Intern Med 2017;177(2):162. [DOI] [PubMed] [Google Scholar]
- 24.Naylor M, Dorothy Brooten, Robert Jones, Risa Lavizzo-Mourey, Mathy Mezey, Mark Pauly. Comprehensive Discharge Planning for the Hospitalized Elderly: A Randomized Clinical Trial. Ann Intern Med 1994;120(12):999. [DOI] [PubMed] [Google Scholar]
- 25.Naylor MD, Brooten D, Campbell R, et al. Comprehensive Discharge Planning and Home Follow-up of Hospitalized Elders: A Randomized Clinical Trial. JAMA 1999;281(7):613. [DOI] [PubMed] [Google Scholar]
- 26.Naylor MD, Brooten DA, Campbell RL, Maislin G, McCauley KM, Schwartz JS. Transitional Care of Older Adults Hospitalized with Heart Failure: A Randomized, Controlled Trial. J Am Geriatr Soc 2004;52(5):675–84. [DOI] [PubMed] [Google Scholar]
- 27.Rich MW, Beckham V, Wittenberg C, Leven CL, Freedland KE, Carney RM. A Multidisciplinary Intervention to Prevent the Readmission of Elderly Patients with Congestive Heart Failure. N Engl J Med 1995;333(18):1190–5. [DOI] [PubMed] [Google Scholar]
- 28.Coleman EA, Parry C, Chalmers S, Min S. The Care Transitions Intervention. Arch Intern Med 2006;166:7. [DOI] [PubMed] [Google Scholar]
- 29.Parry C, Min S-J, Chugh A, Chalmers S, Coleman EA. Further Application of the Care Transitions Intervention: Results of a Randomized Controlled Trial Conducted in a Fee-For-Service Setting. Home Health Care Serv Q 2009;28(2–3):84–99. [DOI] [PubMed] [Google Scholar]
- 30.Finkelstein A, Brenner J, Zhou RA, Taubman S, Doyle J. Health Care Hotspotting: A Randomized Controlled Trial [Internet]. clinicaltrials.gov. [cited 2018 Oct 1];Available from: https://clinicaltrials.gov/ct2/show/NCT02090426 [Google Scholar]
- 31.Finkelstein A, Brenner J, Zhou RA, Taubman S, Doyle J. Health Care Hotspotting: A Randomized Controlled Trial [Internet]. AEA RCT Regist. [cited 2018 Oct 1];Available from: https://www.socialscienceregistry.org/trials/329/history/18781 [Google Scholar]
- 32.U.S. Census Bureau. American Community Survey, 2017. American Community Survey 5-Year Estimates, generated by the authors, using American FactFinder [Internet]. [cited 2019 Oct 23];Available from: http://factfinder.census.gov
- 33.Naylor MD, Aiken LH, Kurtzman ET, Olds DM, Hirschman KB. The Importance Of Transitional Care In Achieving Health Reform. Health Aff (Millwood) 2011;30(4):746–54. [DOI] [PubMed] [Google Scholar]
- 34.Anderson GF, Ballreich J, Bleich S, et al. Attributes Common to Programs That Successfully Treat High-Need, High-Cost Individuals. Am J Manag Care 2015;21(11):4. [PubMed] [Google Scholar]
- 35.White IR, Horton NJ, Carpenter J, Statistics R in M and S, Pocock SJ. Strategy for intention to treat analysis in randomised trials with missing outcome data. BMJ 2011;342:d40. [DOI] [PMC free article] [PubMed] [Google Scholar]
- 36.Gilman B, Hoag S, Moreno L, et al. Evaluation of Health Care Innovation Awards (HCIA): Primary Care Redesign Programs: First Annual Report. Mathematica Policy Research; 2014. [Google Scholar]
- 37.Zulman DM, Pal Chee C, Ezeji-Okoye SC, et al. Effect of an Intensive Outpatient Program to Augment Primary Care for High-Need Veterans Affairs Patients: A Randomized Clinical Trial. JAMA Intern Med 2017;177(2):166. [DOI] [PubMed] [Google Scholar]
- 38.Kangovi S, Mitra N, Norton L, et al. Effect of Community Health Worker Support on Clinical Outcomes of Low-Income Patients Across Primary Care Facilities A Randomized Clinical Trial. JAMA Intern Med 2018;9. [DOI] [PMC free article] [PubMed] [Google Scholar]
- 39.Peikes D, Chen A, Schore J, Brown R. Effects of Care Coordination on Hospitalization, Quality of Care, and Health Care Expenditures Among Medicare Beneficiaries: 15 Randomized Trials. JAMA 2009;301(6):603–18. [DOI] [PubMed] [Google Scholar]
- 40.Meltzer D Comprehensive Care Physician: Integrated Inpatient and Outpatient Care for Patients at High Risk of Hospitalization [Internet]. clinicaltrials.gov. [cited 2019 Mar 21];Available from: https://clinicaltrials.gov/ct2/show/NCT01929005 [Google Scholar]
- 41.Noonan K, Craig K. From siloed systems to ecosystem: The evolution of the Camden Coalition’s complex care model [Internet]. Camden Coalit. 2019. [cited 2019 Aug 14];Available from: https://www.camdenhealth.org/from-siloed-systems-to-ecosystem-the-evolution-of-the-camden-coalitions-complex-care-model/ [Google Scholar]
- 42.Figueroa JF, Zhou X, Jha AK. Characteristics And Spending Patterns Of Persistently High-Cost Medicare Patients. Health Aff (Millwood) 2019;38(1):107–14. [DOI] [PubMed] [Google Scholar]
- 43.Figueroa JF, Lyon Z, Zhou X, Grabowski DC, Jha AK. Persistence and Drivers of High-Cost Status Among Dual-Eligible Medicare and Medicaid Beneficiaries: An Observational Study. Ann Intern Med 2018;169(8):528–34. [DOI] [PubMed] [Google Scholar]
- 44.Joynt KE, Gawande AA, Orav EJ, Jha AK. Contribution of Preventable Acute Care Spending to Total Spending for High-Cost Medicare Patients. JAMA 2013;309(24):2572. [DOI] [PubMed] [Google Scholar]
- 45.Grinberg C, Hawthorne M, LaNoue M, Brenner J, Mautner D. The Core of Care Management: The Role of Authentic Relationships in Caring for Patients with Frequent Hospitalizations. Popul Health Manag 2016;19(4):248–56. [DOI] [PMC free article] [PubMed] [Google Scholar]
- 46.Care Coordination [Internet]. CAMcare Health Corp. [cited 2019 May 16];Available from: https://www.camcare.net/care-coordination
- 47.Care Coordination and Consultation [Internet]. Vitality. 2015. [cited 2019 May 16];Available from: https://vitality.camdendiocese.org/care/
- 48.LIFE at Lourdes [Internet]. Lourdes Health Syst. [cited 2019 May 16];Available from: https://www.lourdesnet.org/programs-and-services/life-at-lourdes/
- 49.Cooper Establishes Transitional Care Management Department to Improve Transition From Hospital to Home, Reduce Readmissions [Internet]. Cooper. [cited 2019 May 16];Available from: https://blogs.cooperhealth.org/news/2016/06/cooper-establishes-transitional-care-management-department-to-improve-transition-from-hospital-to-home-reduce-readmissions/
- 50.Wiest D, Yang Q, Wilson C, Dravid N. Outcomes of a Citywide Campaign to Reduce Medicaid Hospital Readmissions With Connection to Primary Care Within 7 Days of Hospital Discharge. JAMA Netw Open 2019;2(1):e187369. [DOI] [PMC free article] [PubMed] [Google Scholar]
Associated Data
This section collects any data citations, data availability statements, or supplementary materials included in this article.