Abstract
Background
In 2015, the Institute of Medicine Vital Signs report called for a new patient safety composite measure to lessen the reporting burden of patient harm. Before this report, two patient safety organizations had developed an electronic all-cause harm measurement system leveraging data from the electronic health record, which identified and grouped harms into five broad categories and consolidated them into one all-cause harm outcome measure.
Objectives
The objective of this study was to examine the relationship between this all-cause harm patient safety measure and the following three performance measures important to overall hospital safety performance: safety culture, employee engagement, and patient experience.
Methods
We studied the relationship between all-cause harm and three performance measures on eight inpatient care units at one hospital for 7 months.
Results
The findings demonstrated strong correlations between an all-cause harm measure and patient safety culture, employee engagement, and patient experience at the hospital unit level. Four safety culture domains showed significant negative correlations with all-cause harm at a P value of 0.05 or less. Six employee engagement domains were significantly negatively correlated with all-cause harm at a P value of 0.01 or less, and six of the ten patient experience measures were significantly correlated with all-cause harm at a P value of 0.05 or less.
Conclusions
The results show that there is a strong relationship between all-cause harm and these performance measures indicating that when there is a positive patient safety culture, a more engaged employee, and a more satisfying patient experience, there may be less all-cause harm.
Key Words: patient safety, all cause harm, safety culture, employee engagement, patient experience, harm measurement, policy implications
It is widely understood that significant numbers of patients admitted to U.S. hospitals experience some form of harm (adverse event) during their hospital stay. Recent studies1–3 demonstrate that the percentage of patients harmed is much larger than previously appreciated in the Institute of Medicine (IOM) report To Err Is Human: Building a Safer Health System, which estimated that 44,000 to 98,000 people died in hospitals every year as a result of preventable medical errors.4 In 2013, a study suggested that preventable harm may lead to as many as 440,000 deaths and more than 6 million injuries per year.5
These findings have created great interest in developing various methods to more effectively and efficiently measure all-cause harm events. Some commonly used methods for measuring harm in health care are the following: (1) morbidity and mortality reviews; (2) analysis of medical malpractice claims; (3) error or incident reporting systems; (4) analysis of administrative data, most notably the Agency for Healthcare Research and Quality Patient Safety Indicators; (5) retrospective or concurrent chart review; (6) electronic medical record review; (7) direct observation of patient care; and (8) clinical surveillance.6 All of these various measurement systems contribute toward a multitude of uncoordinated, inconsistent, and often duplicative measurement and reporting initiatives in patient safety.
In January 2012, the Office of Inspector General published the Adverse Events in Hospitals: National Incidence Among Medicare Beneficiaries report, which recommended that hospitals should report all adverse events, or as Centers for Medicare and Medicaid Services (CMS) has interpreted adverse events as “all-cause harm—any event during the care process that results in harm to a patient, regardless of cause.”7 However, this recommendation has continued to leave hospitals with increasing challenges to meet this significant reporting burden. A 2006 study identified 38 unique reporting programs, and a sample of hospitals found that each hospital reported an average of five different reporting programs.8 A 2013 analysis found that a typical major academic medical center was required to report on more than 120 quality and safety measures to regulators or payors with the cost of measure collection and analysis consuming approximately 1% of net patient service revenue.9 The CMS Measures Inventory catalogs nearly 1700 quality and safety measures in use by U.S. Department of Health and Human Services.10 The National Quality Forum’s measure database includes 630 measures with current National Quality Forum endorsement, and The National Committee for Quality Assurance’s Healthcare Effectiveness Data and Information Set, used by more than 90% of health plans, comprise 81 different measures.11
In response to this incredible reporting burden on hospitals, the IOM published a new report, Vital Signs: Core Metrics for Health and Health Care Progress,12 with the goal of streamlining and simplifying the plethora of reporting measures. The Vital Signs report has called for the development of a new patient safety composite measure. The Vital Signs report also suggested that such a composite might include several measures not included in the current and much more narrowly defined measures required by current CMS reporting programs. This new measure would reflect patient safety more broadly by incorporating related priority measures with all-cause harm patient safety events mapped against a range of patient care settings. Such a composite might include wrong-site surgeries, hospital-acquired infections, medication reconciliation, and pressure ulcers. In addition, as the IOM Vital Signs report noted, the emerging health information technology infrastructure could support an electronic real-time safety measurement system for the routine collection of information about care processes, patient needs, progress toward health goals, and individual and population health outcomes.12
Adventist Health System Patient Safety Organization (AHS PSO) and Pascal Metrics, Inc, Patient Safety Organization had developed a prospective electronic all-cause harm detection system that offered the potential to fulfill the IOM Vital Signs call for a patient safety composite measure. The system allowed for the collection of potential harm data, which could be compiled into a composite measure. This could fulfill the IOM Vital Signs call for a patient safety composite measure that could markedly reduce the reporting burden. The objective of this study is to examine the relationship between this all-cause harm patient safety measure and the following three performance measures important to overall hospital safety performance: safety culture, employee engagement, and patient experience. This will also inform policy makers of these relationships as they move forward with the recommendations in the IOM Vital Signs report.
METHODS
Study Data
The study data covered seven consecutive months in 2013. The AHS PSO studied unit-level hospital data from eight units within a single, large community hospital. These units included the following: (1) intensive care; (2) cardiovascular intensive care; (3) cardiovascular step-down; (4) medical progressive care; (5) surgical progressive care; (6) medical care; (7) surgical care; and (8) labor and delivery. The outcome measure was an all-cause harm composite measure at the unit level. The performance measures were the following: (1) patient safety culture; (2) employee engagement; and (3) patient experience.
Outcome Measure – All-Cause Harm
In 2009, AHS began using a retrospective trigger methodology to identify patient harm.1,2,13–16 This use of triggers along with a precisely defined health record review process allowed for a more comprehensive and reliable approach to harm identification than did the traditional methods of voluntary incident reporting and observational tracking. The combination of the trigger methodology and a common electronic health record (EHR) enabled AHS PSO to consistently identify and measure all-cause harm.16 This retrospective trigger harm measurement process allowed AHS to examine the impact of all-cause harm on clinical outcomes such as increased length of stay, readmission, and mortality.17 Although the awareness of harm, provided by the retrospective trigger methodology demonstrated opportunities for improvement across the system, the human and fiscal resources required to continue this methodology were unsustainable. Therefore, in 2013, we developed a prospective electronic all-cause harm trigger detection system that leveraged data from the EHR, which allowed for bedside intervention and real-time trend analysis affecting patient safety. A centralized nurse review team model for workflow was developed. Three nurse reviewers followed the automated positive trigger in the EHR to determine whether a patient harm had occurred. All harms were confirmed and approved after discharge either by nursing consensus or by a physician authenticator. We achieved a high degree of interrater reliability with this method. If no harm was found, the review ended.18
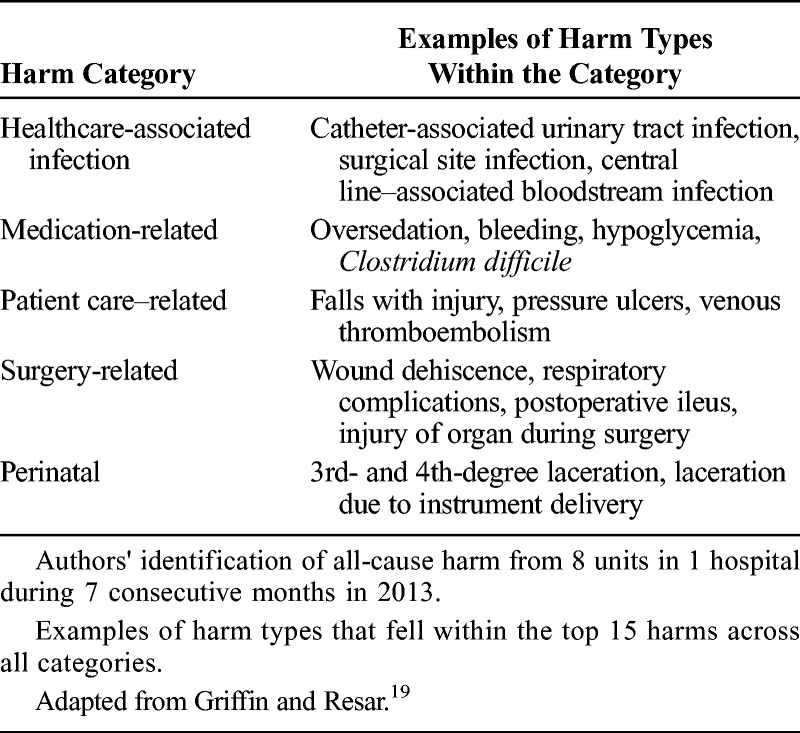
With this prospective electronic all-cause harm approach, we defined harm using the Institute for Healthcare Improvement’s (IHI) definition of harm—“unintended physical injury resulting from or contributed to by medical care… harms of commission not omission”19 and used the National Coordinating Council for Medication Error Reporting and Prevention index for severity level classification.20 We organized all-cause harm into a common set of categories well-established by the IHI: (1) healthcare-associated infection, (2) medication-related, (3) patient care–related, (4) surgery-related, and (5) perinatal harm (Table 1).19 In the eight units, among the five categories, we found a total of 1025 harms from severity levels National Coordinating Council for Medication Error Reporting and Prevention E-I. We aggregated all harms E-I and weighted them equally. The harm rate was developed by dividing the harm by the patient volume on the eight units. This harm rate was the all-cause harm safety measure used in this study.
TABLE 1.
All-Cause Harm Categories and Harm Types in Each Category
Performance Measure – Patient Safety Culture
We assessed patient safety culture in 2013 using a combination of the two most widely used safety culture surveys in healthcare—the Safety Attitudes Questionnaire (SAQ) and the Hospital Survey of Patient Safety Culture (HSOPSC)—both of which have strong kappa Cronbach α scores.21 The survey was administered to the clinical staff on each unit. The survey was not required, all responses were anonymous, and it was administered using a mix of paper-based and electronic methodologies. The SAQ portion included 24 items from the following five domains: teamwork climate, safety climate, stress recognition, perceptions of senior management, and perceptions of local management. The HSOPSC portion included 11 items from the following three domains: hospital handoffs and transitions, nonpunitive response to error, and teamwork across hospital units. Three hundred seventy-one frontline staff rated each item of the survey on a five-point Likert scale ranging from 1 (strongly disagree) to 5 (strongly agree). Unit-level measures were a percentage of the responses that were 4 (agree slightly) or 5 on the Likert scale. The average response rate across the eight units was 92%. Respondent-level data were aggregated to the unit level for each domain. Aggregated, unit-level domain scores were used in all subsequent analyses.
Performance Measure – Employee Engagement
We used the Gallup Q12 Employee Engagement Survey, administered in 2013 to the eight units in this study, to assess employee engagement and its impact on performance outcomes. The survey was administered to the staff on each unit. The survey was not required and all responses were anonymous. Employees rated each of the the following 12 survey items: overall satisfaction, know what’s expected, materials and equipment, opportunity to do best, recognition and praise, someone cares about me, encourages development, opinions count, mission and purpose, employees committed to quality, best friend at work, progress, and learn and grow using a five-point likert scale ranging from 1 (strongly disagree) to 5 (strongly agree). The eight units had a total of 1934 employees with an average response rate of 95%. Frontline respondent-level data were aggregated to the unit level, and the overall mean composite for the twelve items was used as the measure of employee engagement to calculate the correlations.
Performance Measure – Patient Experience
We assessed inpatient experience using the HCAHPS survey—a national, standardized, publicly reported survey of patients’ perspectives of hospital care. The HCAHPS survey was administered during 2013 to a random sample of discharged adult inpatients. The survey was composed of 32 items that measure a patient’s perception of their hospital experience. Related questions were combined into the following ten measures: overall hospital rating, willingness to recommend hospital, nurse communication, hospital staff responsiveness, doctor communication, hospital environment, pain management, communication about medicine, discharge information, and care transition. There were 2581 patient responses from the eight units during the study period. Unit-level analysis was performed on the ten composite HCAHPS measures. The aggregated composite measures of the patient experience survey were used to calculate the correlations.
Statistical Analysis
Statistical analysis was performed across eight units. Pearson correlations were calculated between all-cause harm and all component measures from the safety culture, employee engagement, and patient experience performance surveys. We calculated the correlation of all-cause harm against individual domain scores in each of the component measures because there was not an overall score from the safety culture, employee engagement, and patient experience surveys available. In this study, we used a P value of 0.05 or less as the threshold for determining significance.
RESULTS
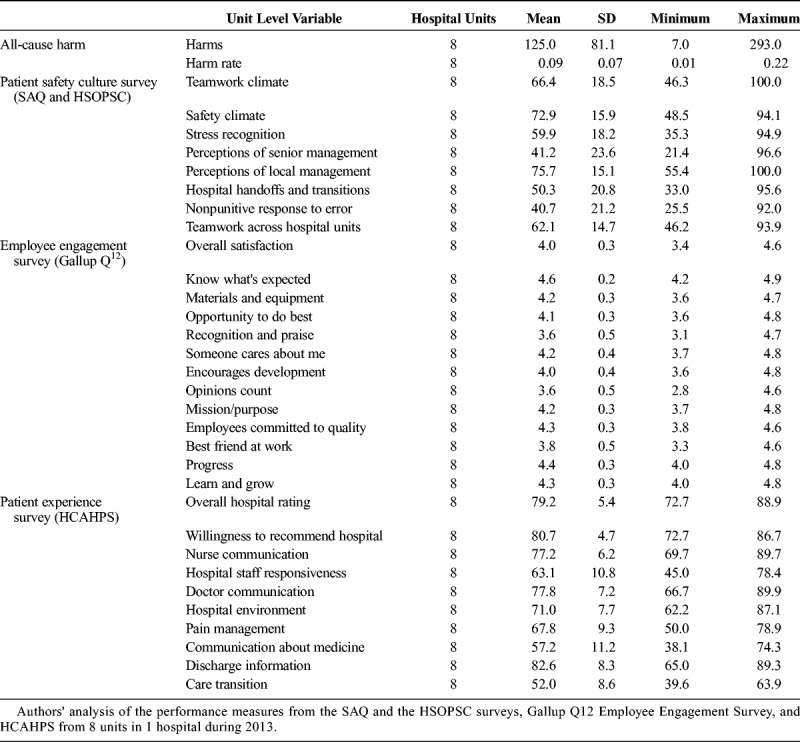
The profile of all the variables used in the analysis is provided in Table 2, with the mean, SD, minimum, and maximum of each variable. The unit level patient harm ranges from 7 to 293 harms among eight units with an average of 125. The value ranges of the three surveys are very different. There are eight domain variables for the patient safety culture survey with means ranging between 41.2 and 75.7. There are thirteen domain variables in the employee engagement survey with means ranging from 3.6 to 4.6. There are ten domain variables in the patient experience survey with means ranging from 52.0 to 82.6.
TABLE 2.
Summary Data of the Outcome Variable All-Cause Harm and Patient Safety Culture, Employee Engagement, and Patient Experience
All-Cause Harm and Patient Safety Culture
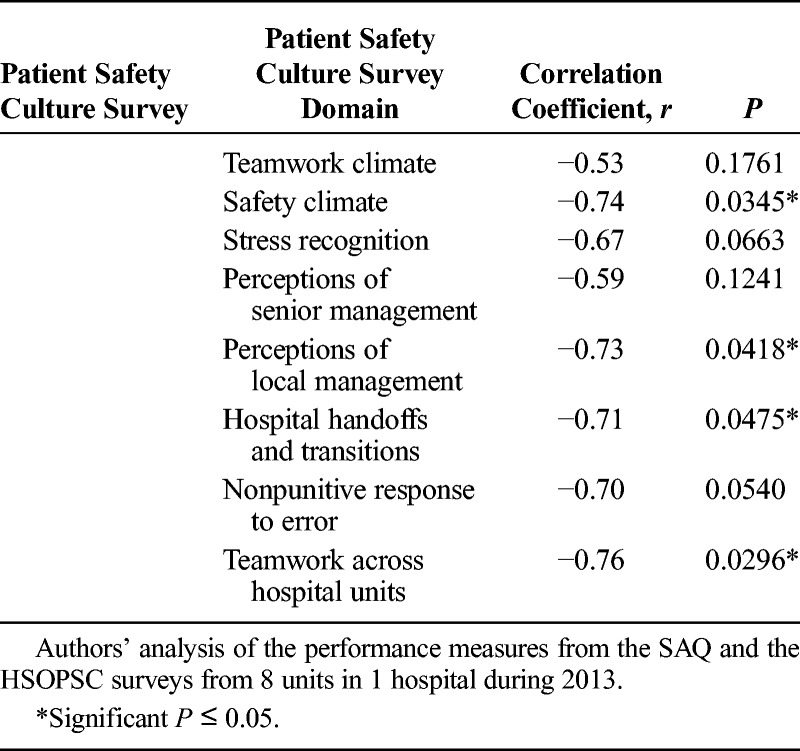
Of the eight safety culture survey domains, four domains (safety climate, perceptions of local management, hospital handoffs and transitions, and teamwork across hospital units) had significant negative correlations with all-cause harm at a P value of 0.05 or less (Table 3).
TABLE 3.
Pearson's Correlations Between All-Cause Harm and Patient Safety Culture
All-Cause Harm and Employee Engagement
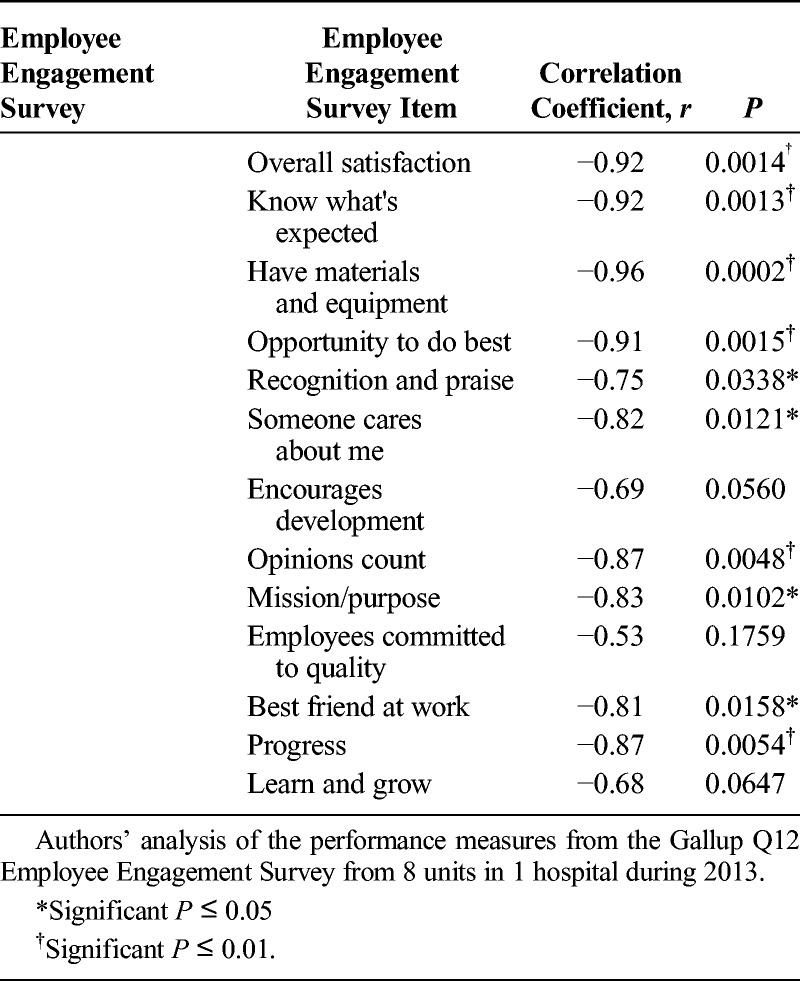
Of the 13 employee engagement domains, only three domains (encourages development, coworkers committed to quality, and learn and grow) were not significantly correlated with all-cause harm at a P value of 0.05 or less (Table 4). Four domain measures (recognition and praise, someone cares about me, and best friend at work) were significantly negatively correlated with all-cause harm at a P value of 0.05 or less. Six domain measures (overall satisfaction, know what’s expected, materials and equipment, opportunity to do best, opinions count, and progress) were significantly negatively correlated with all-cause harm at a P value of 0.01 or less, which indicates a more significant relationship. The significant correlation coefficients are large in absolute terms. This could in part be due to both their relative stronger negative correlations with all-cause harm and the relatively narrow range of employee engagement scores (3.6 and 4.6).
TABLE 4.
Pearson’s Correlations Between All-Cause Harm and Employee Engagement
All-Cause Harm and Patient Experience
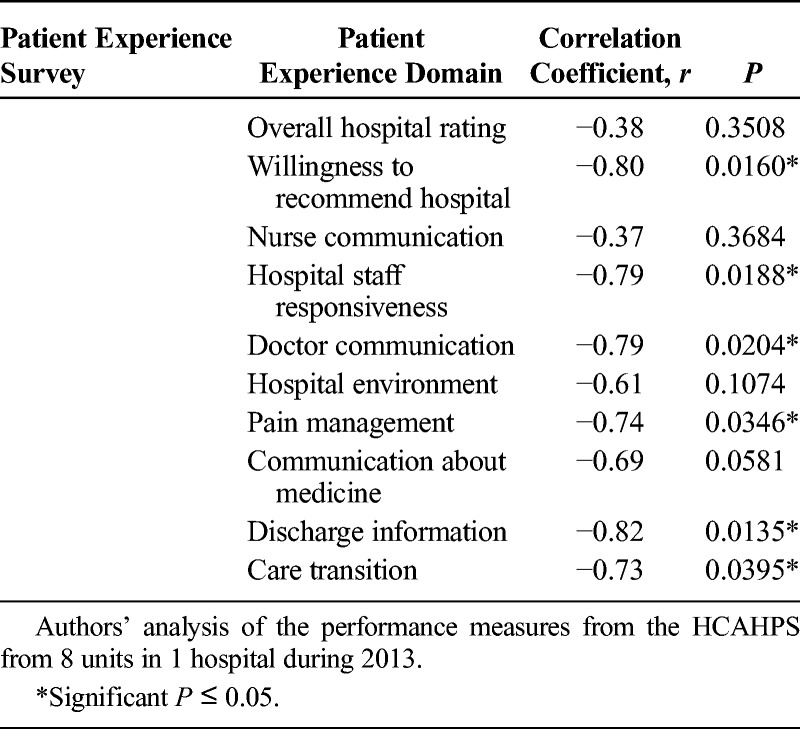
Six of the ten HCAHPS composite measures (willingness to recommend hospital, hospital staff responsiveness, doctor communication, pain management, discharge information, and care transition) were significantly correlated with the number of all-cause harm with a P value of 0.05 or less (Table 5). Four measures (overall hospital rating, nurse communication, hospital environment, and communication about medicine) were not significantly correlated with all-cause harm at a P value of 0.05 or less.
TABLE 5.
Pearson’s Correlations Between All-Cause Harm and Patient Experience
The results in this unit-level correlation analysis showed significant negative relationships with the outcome measure, all-cause harm, and the following three important performance measures: patient safety culture, employee engagement, and patient experience.
DISCUSSION
Many studies have explored the relationship between patient safety culture,22 employee engagement,23 or patient experience24 individually with quality and safety outcomes including limited adverse patient events. However, to our knowledge, there are no reported studies exploring the relationship between all-cause harm with all the following three important performance measures: patient safety culture, employee engagement, and patient experience.
All-Cause Harm and Patient Safety Culture
It is well recognized that a strong cultural environment is a critical component of organizational success. In this study, we explored the relationship between an all-cause harm measure and the frontline caregiver’s perceptions of safety culture in their clinical units. We found that all-cause harm decreased as the perceptions of unit-level safety culture increased. This association was statistically significant in the domains of safety climate, perceptions of local management, hospital handoffs and transitions, and teamwork across hospital units (correlations range from −0.71 to −0.76). These results are similar to multiple studies that found a more positive patient safety culture is associated with fewer adverse events.25–27 Additional studies have examined the relationships between patient safety culture and specific adverse event types such as medication errors, falls, pressure ulcers, urinary tract infections,28 and surgical site infections.29 Many studies have evaluated the relationship of specific adverse events such as the Agency for Healthcare Research and Quality Patient Safety Indicators or Hospital-Acquired Conditions to patient safety culture; however, no other study has used an all-cause harm composite measure to evaluate the relationship with patient safety culture.
All-Cause Harm and Employee Engagement
Interestingly, few published studies examine the relationship between adverse events, let alone all-cause harm, with employee engagement. However, of the three surveys we examined, we found the strongest correlations between all-cause harm and employee engagement—the more engaged the staff, the fewer number of patient harms. There were significantly fewer patient harms when workers felt overall satisfaction with their job, knew what was expected of them at work, had the materials and equipment to do their job, and felt as if they had the opportunity to do their best on the job (correlations range from −0.91 to −0.96). Three additional engagement items, recognition and praise, someone cares about me, and best friend at work, were correlated between −0.75 to −0.81.
All-Cause Harm and Patient Experience
For the past several years, patient experience has been an increasingly important measure of healthcare performance. The study from Sorra et al.30 found that hospitals where staff have more positive perceptions of patient safety culture tend to have more positive assessments of care from patients. Sacks et al.31 found surgical mortality, failure to rescue, and minor complication rates are lower in hospitals with higher top box HCAHPS survey scores.
We found similar results for patient experience in that patients expressed greater satisfaction on the HCAHPS survey if there were fewer patient harms (correlations range from −0.73 to −0.82). The HCAHPS survey item most tightly linked to all-cause harm was related to the patient receiving and understanding discharge or self-care instructions (r = −0.82). This is highly relevant in today’s focus on patient accountability, readmission penalties, and transitions of care.
These significant negative correlations indicate that when there is a positive patient safety culture, more engaged employees, and a more satisfying patient experience, there may be less all-cause harm.
Implications for a Patient Safety Composite Measure
A multitude of national and state safety measures have emerged for the past several years, which has resulted in uncoordinated, inconsistent, and often duplicative safety measurement and safety reporting initiatives. This is itself a health care inefficiency12; the variation of reporting measures means that results cannot be compared across geographical areas, institutions, or populations. Approaches to align and streamline safety measurement efforts between federal agencies, states, payors, employers, and providers must take into consideration the implications of an all-cause harm composite measure and an operational EHR to provide access to real-time patient safety information. Recently, CMS has begun the process of creating a patient safety composite measure using an electronic approach, which is similar to the measure described in this article.32
There are three key points for policy makers to consider as we continue to work toward developing a parsimonious and meaningful safety measure set to be used across different settings of care. First, an all-cause harm measure should be considered in the development of future composite patient safety measures. The findings of this study indicate that an all-cause harm measure correlates with improved patient safety culture, employee engagement, and patient experience measurement outcomes. Therefore, policy makers, when addressing future composite patient safety measure development, may want to consider these correlations.
Second, an all-cause harm composite measure can effectively streamline the panoply of existing measurements. As noted previously, all-cause harm is correlated with improved patient safety culture, employee engagement, and patient experience. These measures are included in multiple existing public reporting programs such as value-based purchasing and hospital-acquired condition programs and are often considered for new public reporting programs. The all-cause harm composite measure, upon further study, may provide policy makers with the opportunity to streamline and standardize safety measures across existing and emerging value programs and payment models.
Lastly, the all-cause harm composite measure may provide an opportunity to be used outside of the hospital walls and in the postacute space where there is a distinct absence of meaningful safety measures. In a previous study, it was found that thirty-two percent of harm events occurred outside of the hospital.14 This emphasizes the need for proactive partnerships and alignment of incentives between hospitals and community care providers and services as well as a fully functioning EHR. Managing patients throughout the entirety of the care continuum is critically important to ensuring that patients receive the safest, highest-quality, and cost-efficient care. Identifying and prioritizing the most appropriate and meaningful measures to best manage patient safety across the continuum are critical.
Our study had several limitations. First, it was conducted at a single community hospital, in a single region of the United States. It did not represent large academic centers, critical access, specialty, or safety net hospitals. Second, the harm data collection excluded pediatric, rehabilitation, and mental health patients as well as short stay visits (<1-day length of stay). Third, the study was conducted at a hospital with a fully integrated EHR with broad use of clinical decision support systems. Finally, eight units is a sample size, which could potentially lead to a low power test and result in a low chance of finding true effects. With a small sample, it would be expected that the correlations be either inconsistent or nonsignificant. However, our study showed consistency in direction and consistency in significance. Therefore, the results were unlikely to be due to chance alone.
CONCLUSIONS
Any national attempt to build a new patient safety composite measure requires a focused understanding of the relationships of important performance measures at the frontlines of care, which influence patient safety. We developed an all-cause harm composite measure that strongly correlates with patient safety culture, employee engagement, and patient experience. This all-cause harm composite measure fulfills the Vital Signs call for a patient safety composite measure.
ACKNOWLEDGMENTS
The authors thank Andrew Hicks, BSE, MSE, Business Systems Analyst, Product Management at Evolent Health; Natasha Scott, PhD, MSc, Director, Research and Innovation at the National Energy Board, Government of Canada; and Stanley L. Pestotnik, MS, RPh, Vice President, Patient Safety Products Health Catalyst.
Footnotes
The authors disclose no conflict of interest.
REFERENCES
- 1.Landrigan CP, Parry GJ, Bones CB, et al. Temporal trends in rates of patient harm resulting from medical care. N Engl J Med. 2010;363:2124–2134. [DOI] [PubMed] [Google Scholar]
- 2.Classen DC, Resar R, Griffin F, et al. ‘Global trigger tool’ shows that adverse events in hospitals may be ten times greater than previously measured. Health Aff (Millwood). 2011;30:581–589. [DOI] [PubMed] [Google Scholar]
- 3.Department of Health and Human Services, Office of Inspector General. Adverse events in hospitals: national incidence among Medicare beneficiaries [Internet]. Washington, DC: HHS; 2010 Nov. Available at: http://oig.hhs.gov/oei/reports/oei-06-09-00090.pdf. Accessed January 15, 2011. [Google Scholar]
- 4.Institute of Medicine (US) Committee on Quality of Health Care in America; Kohn LT, Corrigan JM, Donaldson MS. To Err Is Human: Building a Safer Health System. Washington, DC: National Academies Press; 2000. [PubMed] [Google Scholar]
- 5.James JT. A new, evidence-based estimate of patient harms associated with hospital care. J Patient Saf. 2013;9:122–128. [DOI] [PubMed] [Google Scholar]
- 6.Thomas EJ, Petersen LA. Measuring errors and adverse events in health care. J Gen Intern Med. 2003;18:61–67. [DOI] [PMC free article] [PubMed] [Google Scholar]
- 7.Department of Health and Human Services. Centers for Medicare and Medicaid Services. Ref: S&C: 13-19-HOSPITALS 15 Mar. 2013. Available at: https://www.cms.gov/Medicare/Provider-Enrollment-and-Certification/SurveyCertificationGenInfo/Downloads/Survey-and-Cert-Letter-13-19.pdf. Accessed October 28, 2015.
- 8.Pham HH, Coughlan J, O’Malley AS. The impact of quality reporting programs on hospital operations. Health Aff (Millwood). 2006;25:1412–1422. [DOI] [PubMed] [Google Scholar]
- 9.Meyer GS, Nelson EC, Pryor DB, et al. More quality measures versus measuring what matters: a call for balance and parsimony. BMJ Qual Saf. 2012;21:964–968. [DOI] [PMC free article] [PubMed] [Google Scholar]
- 10.CMS (Centers for Medicare & Medicaid Services). CMS Measure Inventory: Database With Measure Results Already Calculated. Baltimore, MD: CMS; 2014. [Google Scholar]
- 11.Chassin MR, Loeb JM, Schmaltz SP, et al. Accountability measures—using measurement to promote quality improvement. N Engl J Med. 2010;363:683–688. [DOI] [PubMed] [Google Scholar]
- 12.Institute of Medicine. Vital Signs: Core Metrics for Health and Health Care Progress. Washington, DC: The National Academies Press; 2015. [PubMed] [Google Scholar]
- 13.Office of the Inspector General. Adverse Events in Hospitals: National Incidence Among Medicare Beneficiaries. OEI-06-09-00090. Washington, DC: U.S. Department of Health and Human Services; 2010. Available at: http://oig.hhs.gov/oei/reports/oei-06-09-00090.pdf (3.5 MB). [Google Scholar]
- 14.Good VS, Saldaña M, Gilder R, et al. Large-scale deployment of the Global Trigger Tool across a large hospital system: refinements for the characterisation of adverse events to support patient safety learning opportunities. BMJ Qual Saf. 2011;20:25–30. [DOI] [PubMed] [Google Scholar]
- 15.Kennerly DA, Kudyakov R, da Graca B, et al. Characterization of adverse events detected in a large health care delivery system using an enhanced global trigger tool over a five-year interval. Health Serv Res. 2014;49:1407–1425. [DOI] [PMC free article] [PubMed] [Google Scholar]
- 16.Garrett PR, Jr, Sammer C, Nelson A, et al. Developing and implementing a standardized process for global trigger tool application across a large health system. Jt Comm J Qual Patient Saf. 2013;39:292–297. [DOI] [PubMed] [Google Scholar]
- 17.Adler L, Yi D, Li M, et al. Impact of inpatient harms on hospital finances and patient clinical outcomes. J Patient Saf. 2015. Epub ahead of print. [DOI] [PMC free article] [PubMed] [Google Scholar]
- 18.Sammer C, Miller S, Jones C, et al. Developing and evaluating an automated all-cause harm trigger system. Jt Comm J Qual Patient Saf. 2017;43:155–165. [DOI] [PubMed] [Google Scholar]
- 19.Griffin FA, Resar RK. IHI Global Trigger Tool for Measuring Adverse Events. In: IHI Innovation Series White Paper. 2nd ed Cambridge, MA: Institute for Healthcare Improvement; 2009. Available at: http://www.ihi.org. Accessed October 4, 2016. [Google Scholar]
- 20.NCC MERP. Index for categorizing medication errors. http://www.nccmerp.org/. National Coordinating Council for Medication Error Reporting and Prevention, 2015. Available at: http://www.nccmerp.org/types-medication-errors. Accessed October 4, 2016.
- 21.Colla JB, Bracken AC, Kinney LM, et al. Measuring patient safety climate: a review of surveys. Qual Saf Health Care. 2005;14:364–366. [DOI] [PMC free article] [PubMed] [Google Scholar]
- 22.Farup PG. Are measurements of patient safety culture and adverse events valid and reliable? Results from a cross sectional study. BMC Health Serv Res. 2015;15:186. [DOI] [PMC free article] [PubMed] [Google Scholar]
- 23.Daugherty Biddison EL, Paine L, Murakami P, et al. Associations between safety culture and employee engagement over time: a retrospective analysis. BMJ Qual Saf. 2016;25:31–37. [DOI] [PubMed] [Google Scholar]
- 24.Lyu H, Wick EC, Housman M, et al. Patient satisfaction as a possible indicator of quality surgical care. JAMA Surg. 2013;148:362–367. [DOI] [PubMed] [Google Scholar]
- 25.Mardon RE, Khanna K, Sorra J, et al. Exploring relationships between hospital patient safety culture and adverse events. J Patient Saf. 2010;6:226–232. [DOI] [PubMed] [Google Scholar]
- 26.Najjar S, Nafouri N, Vanhaecht K, et al. The relationship between patient safety culture and adverse events: a study in Palestinian hospitals. Saf Health. 2015;1:1–9. [Google Scholar]
- 27.Berry JC, Davis JT, Bartman T, et al. Improved safety culture and teamwork climate are associated with decreases in patient harm and hospital mortality across a hospital system. J Patient Saf. 2016. Epub ahead of print. [DOI] [PubMed] [Google Scholar]
- 28.DiCuccio MH. The relationship between patient safety culture and patient outcomes: a systematic review. J Patient Saf. 2015;11:135–142. [DOI] [PubMed] [Google Scholar]
- 29.Fan CJ, Pawlik TM, Daniels T, et al. Association of safety culture with surgical site infection outcomes. J Am Coll Surg. 2016;222:122–128. [DOI] [PubMed] [Google Scholar]
- 30.Sorra J, Khanna K, Dyer N, et al. Exploring relationships between patient safety culture and patients’ assessments of hospital care. J Patient Saf. 2012;8:131–139. [DOI] [PubMed] [Google Scholar]
- 31.Sacks GD, Lawson EH, Dawes AJ, et al. Relationship between hospital performance on a patient satisfaction survey and surgical quality. JAMA Surg. 2015;150:858–864. [DOI] [PubMed] [Google Scholar]
- 32.Centers for Medicare & Medicaid Services. Technical Expert Panels. CMS.gov Centers for Medicare & Medicaid Services. Centers for Medicare & Medicaid Services, 10 Apr. 2017. Web. 12 Apr. 2017. Available at: https://www.cms.gov/Medicare/Quality-Initiatives-Patient-Assessment-Instruments/MMS/TechnicalExpertPanels.html#855.


