

Abstract
The vascular endothelium forms the inner lining of blood vessels and actively regulates vascular permeability in response to chemical and physical stimuli. Understanding the molecular pathways and mechanisms that regulate the permeability of blood vessels is of critical importance for developing therapies for cardiovascular dysfunction and disease. Recently, we developed a novel microfluidic human engineered microvessel (hEMV) platform to enable controlled blood flow through a human endothelial lumen within physiologic 3D extracellular matrix, in which pericytes and other stromal cells can be introduced to recapitulate tissue-specific microvascular physiology. This protocol describes how to design and fabricate the silicon hEMV device master molds (~1 week) and elastomeric substrates (3 days); how to seed, culture, and apply calibrated fluid shear stress to hEMVs (1-7 days); and how to assess vascular barrier function (1 day) and perform immunofluorescence imaging (3 days).
INTRODUCTION
The blood vasculature forms a transport barrier to dynamically regulate the exchange of molecules and cells between the blood and surrounding tissue. This barrier prevents tissue edema while selectively enabling the exchange of cells and nutrients to meet metabolic and homeostatic demands of the surrounding tissue. Consequently, regulation of vascular permeability is fundamental to cardiovascular function, and barrier dysfunction is a hallmark of and contributes to a host of cardiovascular diseases1–3. Cardiovascular disease is the leading cause of death in Americans4, and thus understanding the cellular and molecular regulators of vascular barrier function is essential for the development of interventional strategies. Importantly, in diseases such as fibrosis and cancer, barrier dysfunction not only contributes to the pathogenesis of the disease but also impairs treatment due to improper drug delivery5.
Given the importance of vascular permeability in health and disease, much work has been devoted to investigating the selective nature of the endothelial barrier at the tissue and organism level. A host of chemical signals from the circulating blood and surrounding tissue have been found to increase or decrease permeability6, and importantly, blood flow is also a critical regulator of permeability7. In vitro, steady laminar flow applied to endothelial cell monolayers promotes barrier function8 (see 9 for a review of hemodynamics and effects on barrier function), and in vivo, unsteady or reduced flow in the aorta decreases arterial wall shear stress to result in locally increased vascular leak3,10. Despite identifying these regulators of barrier function, the molecular mechanisms by which endothelial cells (ECs) sense these cues and regulate cell-cell adhesions and transcytosis to modulate transport remain poorly understood. Furthermore, although the vascular endothelium forms the principal transport barrier of the microvasculature, mural cells such as pericytes that line smaller blood vessels are critical for the regulation of transendothelial transport11, yet the mechanisms by which they signal to the endothelium remain unclear.
Investigating the molecular mechanisms that regulate vascular barrier function is complicated by the lack of experimental systems that enable precise control of the mechanical and chemical endothelial microenvironments. In vivo, the ability to modulate blood pressures and flows is limited, and the mechanical effects of blood flow cannot be decoupled from changes in nutrient exchange. In vitro, despite the increased development of microfluidic vascular platforms12, standard, commercial assays that enable investigation of ECs under flow require culturing cells on flat, stiff substrates, which influences cell-matrix and cell-cell signaling pathways known to modulate permeability13. More complete understanding of the molecular mechanisms governing barrier function requires the development of platforms that enable culture of ECs in physiologic extracellular matrix (ECM) with appropriate stromal cells and precise control over blood flow.
To address these experimental needs for an in vitro platform to model the vascular transport barrier, we developed a microfluidic platform that enables culture of ECs in physiologic architectures, incorporating 3D ECM and co-culture with mural cells. The devices can be connected to various pumps and fluid handling systems to simulate blood pressure and flow. The hEMVs are designed to enable high-resolution confocal microscopy of cells within the devices, and cells can be harvested from the devices for standard biochemical assays. As a functional metric for vasculature within the devices, we developed a protocol for introducing fluorescent molecules into the vessels and measuring their transport across the vessel wall as a method for quantifying vascular permeability. The resulting parameter, the diffusive permeability coefficient, is a standard transport metric that can be measured in vivo and used to quantitatively compare barrier function across different assays. This multipurpose platform enabled studies ranging from elucidating the molecular mechanisms of barrier maintenance14,15, to drug screening for novel compounds to treat fibrosis16. Importantly, the technique described in this protocol is accessible to biological laboratories, and while basic microfabrication equipment is required for the initial steps to make the master mold, a growing number of contract organizations provide services that will generate a suitable master for a fee. The subsequent steps utilize equipment and reagents that are standard in biological laboratories, and the hEMV platform was designed to interface with common tissue culture practices and inverted confocal or widefield fluorescent microscopes.
Applications of engineered microvessels
In general, the principal use for hEMVs is to quantitatively measure the barrier function of microvessels formed from human cells and to image these microvessels with subcellular resolution. We have measured the barrier function of hEMVs formed from human ECs in response to circulating factors known to modulate permeability, such as thrombin, histamine, and S1P6, and we reported changes in permeability in response to these factors similar to what has been observed in vivo or in the clinic14. By combining these barrier function measurements with high-resolution confocal microscopy and conventional biochemical assays such as co-immunoprecipitation, qPCR, and protein expression assays, we identified a novel mechanosensory complex and non-canonical signaling mechanism for the Notch1 receptor in endothelial sensing of blood flow14. In response to shear stress, the Notch1 receptor is proteolytically activated to release its transmembrane domain, catalyzing the assembly of a novel protein complex with VE-cadherin, consisting of the Rac GEF Trio and the protein tyrosine phosphatase LAR. The assembly of this complex induces local cortical Rac1 activity and the elaboration of cortical actin, resulting in stabilized adherens junctions and reduced vascular permeability14. The small size of the hEMV platform requires little reagent use and few cells to generate functional vessels; however, biochemistry techniques for gene and protein expression require pooling of multiple devices. We further demonstrated the compatibility of the hEMV platform with CRISPR/Cas9-mediated gene editing in primary human ECs to parse the roles of single genes and proteins in regulating human vascular barrier.
We have extended the hEMV platform to enable the culture of abluminal mural cells to better mimic vascular physiology and to investigate the role of these cells in dynamically regulating permeability. Using bone marrow derived mesenchymal stem cells as a model for pericytes, we identified that pericytes promote barrier function through an N-cadherin-mediated juxtracrine signaling mechanism15. Extending this model with patient-matched kidney pericytes and ECs, we implemented hEMVs as a drug screening platform for renal reperfusion injury16. Though the bulk of our work has been performed with commercially available EC lines and tissue bank primary cells, these experiments demonstrate the ability to adapt the hEMV platform for drug screening and personalized medicine applications.
Alternative methods
Standard models for studying barrier function consist primarily of in vivo permeability assays and transwell diffusion assays. In vivo assays involve injecting dye locally or systemically in an animal, and transport of the dye into surrounding tissue can be monitored via microscopy or measured from whole tissues postmortem. These approaches are inherently variable due to differences in the injection site and difficulty of injecting small vessels. Further, they lack the ability to parse the individual contributions of hemodynamic shear stress, oxygen tension, and specific cell-types to the regulation of vascular barrier. Common approaches include fluorescein angiography, which can be used clinically due to the use of a biologically inert dye and fast clearance but suffers from high background and variability17. Intravital imaging methods have employed multiphoton microscopy in vivo to track dye transport in real-time in living animals18–20, but these assays require access to specialized imaging systems and involve geometric assumptions for vessel sizes and shapes, which can be limiting depending on vascular network topology.
The most common in vitro approach to studying the vascular barrier is the transwell assay, where a monolayer of ECs is formed on a two-dimensional, stiff, porous membrane that separates two chambers. Solute is added to one side of the porous membrane and bulk transport of molecules, through the EC monolayer, is measured via solute concentration in the opposing well over time21. These assays typically do not allow for perfusion and culture of cells under shear stress, and permeability is measured as a bulk parameter that is susceptible to artifacts due to the well geometry. In vitro assays that permit the incorporation of applied shear stresses, including parallel plate chambers22 and cone-in-plate rheometers23, are still limited by the culture of ECs on flat substrates that are much stiffer than native ECM, aberrantly influencing cell-cell and cell-matrix signaling.
In addition to methods that rely on tracking the transport of dyes, the electrical resistance of in vitro EC monolayers and in vivo vessels has been used as a metric for barrier function24–26. These methods involve culturing cells on an electrode and placing a second electrode above the monolayer and measuring the impedance between the electrodes. Limitations in electrode design and incorporation have restricted these experiments to macroscale observations in vitro27, with little information on the associated EC phenotype. Recent efforts have been made to scale down these systems28, but these platforms still require culturing cells on electrically active, stiff substrates.
The limitations in these standard methods motivated the development of microfluidic assays that better recapitulate the in vivo microenvironment. A variety of microfluidic platforms have been developed, the details of which have been recently reviewed12, that fall into two broad categories. The first are devices that use soft lithography techniques, including polydimethylsiloxane (PDMS) replica molding or microposts, to form channels of hydrogels that serve as a substrate for EC culture29–31. The devices fabricated from replica molding enable the fabrication of vascular networks with defined vessel diameter and network topology but require multiple parts for assembly32 and may not be accessible to standard biological laboratories. The micropost devices enable high-resolution imaging of transport across the endothelial barrier but involve culture of cells on stiff PDMS microposts, and the repeated PDMS-hydrogel interfaces introduce potential artifacts due to the step change in substrate stiffness. The second category of devices involves pre-seeding the hydrogel with endothelial and stromal cells to promote the formation of vascular networks by vasculogenesis33–35. Although these networks can be perfused to study barrier function, the random geometry of the structure limits the ability to define wall shear stresses, and the stromal cells which are necessary to promote network formation further complicate the role of flow in regulating permeability.
To address the limitations in standard and microfluidic assays, we developed the platform reported here, which enables the culture of human cells in physiologically relevant 3D ECM under well-controlled hemodynamic flow. This assay has enabled the development of in vitro vasculature with diffusive permeability values similar to those observed in vivo and enabled multiple molecular discoveries involving the maintenance of barrier function, including the discovery of a novel, mechanosensitive Notch signaling mechanism14.
Advantages and disadvantages of engineered microvessels
The hEMV platform enables the culture of human cells in native architectures on physiologic substrates and perfusion at physiologic rates and shear stresses. Thus, shear stress, nutrient transport, and ECM composition and mechanical properties can be modulated independently to enable mechanistic investigation into the molecular constituents and pathways that govern barrier function. In addition, the hEMV platform enables specific targeting of ECs and mural cells to investigate the role of vascular support cells in modulating barrier function. We have used the platform with cells from various organs and human tissues, demonstrating the ability to study patient-derived cells for disease modeling, drug screening, and personalized medicine applications. Due to the microfluidic housing, the hEMV platform also requires limited reagents and cells. For example, by using a rocker to apply flow, devices can be maintained under flow conditions with less than a milliliter of total media. The 3D matrix also enables investigation into matrix remodeling and angiogenesis in response to chemical or mechanical signals, which cannot be performed with standard in vitro assays. In addition to these benefits, the overhead for experimentation is small, as once a master mold is made, hundreds to thousands of microfluidic devices can be made produced.
The hEMV devices are formed from casting a hydrogel around a steel needle that forms a lumen within the hydrogel upon removal of the needle, and therefore, the resulting vessel diameter is dependent on the geometry of the needle. We have formed vessels using this method that span from 150 μm to 300 μm14,36, and other groups have used needle-based methods to synthesize uniform vessels 60 μm in diameter or tapered vessels that achieve a 15 μm minimum diameter37. While these vessels model the size and geometry of the microvasculature, further reduction of vessel diameter to model capillaries is limited by the direct seeding process described below. Cells are introduced as a suspension into the hollow channel in the gel, and thus, channels smaller than the size of a suspended endothelial cell cannot be synthesized. In addition, due to the requirement that the needle must be removed after gel polymerization, these methods can only be used to make straight or tapered vessels as other geometries, such as convergent channels, would result in hydrogel rupture upon removal of the needles. In our previous studies, we evaluated the effects of physiologic shear stress in the dermal microvasculature (0-10 dyne/cm2), but the range of achievable flow rates and wall shear stresses is a function of the method of flow application and the specifics of the pump or rocker used (see Applying Flow below). An important distinction between the hEMV platform and traditional shear chambers is that hEMVs are sensitive to pressure in addition to shear stress due to the compliance of the surrounding 3D matrix and the application of pulsatile flow will induce pulsatile strain.
The limited number of cells used to form the hEMV platform is a disadvantage for classical biochemical assays. For example, multiple devices need to be pooled to generate sufficient material for standard protein expression assays such as Western blotting, and when applying flow via syringe pump or peristaltic pump, the reagent use per cell is higher than cone-in-plate rheometers. The platform is also dependent on cell seeding, which can vary across experiments and users. The protocol involves seeding cells in a hydrogel, and this hydrogel must be sufficiently stiff to withstand the removal of the needle needed to create the template for the vessels. We have synthesized vessels with a variety of ECM components (see BOX), but these components are only a limited subset of native basement membranes and interstitial microenvironments. Although seeding cells directly on a collagen gel does not recapitulate the native basement membrane, it should be noted that ECs deposit a basement membrane on the collagen surface after seeding and furthermore that the soft, degradable collagen I hydrogel enables remodeling by the ECs36 The permeability assay is dependent on the diffusion of fluorescently-tagged molecules, which limits the time resolution of the measurements and makes multi-day longitudinal studies difficult, though sequential experiments can be performed using optically distinct tracer molecules tagged with different fluorophores. In addition, the 3D nature of the vessels requires confocal imaging to visualize ECs with subcellular resolution. Furthermore, although the changes in permeability in response to circulating factors and hemodynamic forces are similar to what has been observed in vivo, the absolute value of the diffusive permeability coefficient is still significantly higher than what we and others have observed in vivo14,18 (5 dyne/cm2 of shear stress in hEMVs induces permeability to 70 kDa dextran on the order of 0.5-1 x 10⁻⁶ cm/s, while in vivo we reported 0.01-0.04 x 10⁻⁶ cm/s to Evans Blue dye in the dermal microvasculature14). Despite these limitations, the hEMV platform provides many benefits over conventional assays and could serve as a tool in many vascular and cell biology laboratories.
Experimental design
To create human microvessels that demonstrate physiologic barrier function, we developed a microfluidic platform that involves casting a 3D hydrogel around a stainless-steel needle. When the hydrogel has polymerized, the needle can be removed to create a cylindrical void in the hydrogel that serves as a template for seeding cells and the eventual vessel lumen. The hydrogel is confined within a microfluidic device that includes ports to access the vessel lumen and serve as the connection point for pumps or other fluid handling systems (Fig. 1). Multilayer photolithography is used to develop a master mold that enables individual devices to be fabricated from a single layer of PDMS. Therefore, hEMVs are assembled in the following sequential steps described in detail in this protocol (Fig. 2–4 3): i) fabrication of a silicon master pattern that can be used to generate thousands of disposable microfluidic devices, ii) molding individual devices from the silicon master using soft lithography and introducing 3D ECM into the devices, iii) seeding ECs and mural cells, iv) applying hemodynamic flow, v) measuring the diffusive permeability coefficient to quantify vascular permeability, vi) fixation and immunostaining.
Figure 1.

hEMV platform. The device consists of a 3D hydrogel injected into a PDMS microfluidic device bonded to glass. An engineered blood vessel is formed in the hydrogel and is surrounded by the 3D hydrogel. For full geometric details, see technical drawings in Fig. S1.
Figure 2.

Overview of process for making the hEMV platform. 1) 3-layer photolithography is required to make the silicon master mold. 2) PDMS is cured on the master mold to make microfluidic devices. 3) The PDMS devices are cut, bonded to glass, and surface treated to allow the hydrogel to stick to the PDMS surface inside the device. 4) A steel needle is introduced into the device prior to injecting a 3D hydrogel (e.g. collagen, fibrin) as a liquid and polymerizing the gel around the needle. 5) The steel needle is removed to create a channel in the gel, and endothelial cells and/or pericytes are introduced into the device in solution and allowed to adhere to the inside surface of the channel. 6) After allowing cells to adhere and spread, a pump or rocking platform is used to introduce hemodynamic flow in the platform.
Figure 4.

End-products of key steps for device fabrication. (a) Transparency masks used for photolithography to fabricate the silicon master. (b) Silicon master used as a template for hEMV devices. (c) PDMS negative mold of the silicon master. (d) Reusable plastic mold used for soft lithography to generate the hEMV microfluidic devices.
Microfluidic device design and silicon master fabrication
The silicon master serves as the overall template for the microfluidic devices, and therefore must be designed with several considerations: i) the length and diameter of the engineered vessel, ii) the volume and geometry of the 3D hydrogel, iii) connection to pumps or reservoirs for applying flow, and iv) compatibility with imaging systems. To address these considerations the microfluidic devices contain 4 principle features that can be adjusted depending on experimental parameters: 1) hydrogel region, 2) ECM ports, 3) media ports, 4) needle channel (Fig. 1). The size and geometry of the hydrogel region will determine the volume of ECM needed per chip, but also, due to the fact that the microfluidic devices are stiff (>1MPa), the distance from the microfluidic wall to the vessel will influence the apparent stiffness of the ECM38. The standard platform we developed for the barrier function assay is designed to have a total ECM volume of ~40uL (Fig. 1, technical drawings provided in the supplemental information, Fig. S1). The ECM ports serve as the access points to the gel region for introducing the hydrogel during device assembly and also serve as reservoirs or connection points to pumps to adjust the interstitial or perivascular fluid pressure. By raising or lowing the fluid pressure in these ports relative to the pressure in the media ports, transmural flow can be induced39. The media ports are used to introduce cells into the chips during the seeding process, to refresh media for cells in the device, and to connect the vessel platform to external pumps. We design these ports to be >3 mm in diameter to reduce the probability of air bubbles getting trapped when introducing media.
The needle guide holds the stainless-steel needle in place during hydrogel polymerization. This guide is designed as two stacked channels with different cross sectional areas to enable fabrication of the device from a single mold of PDMS while preventing the needle from resting on the bottom or top of the device (Fig. 5a, transparency masks for photolithography are provided in the supplemental information, Fig. S2). The bottom channel, which we refer to as the needle buffer, has a width that is 30 μm less than the needle diameter, and the height of this channel determines the distance from the coverslip to the bottom of the vessel. We design this height of the needle buffer to be 100 μm, as any larger distance makes high-resolution imaging through the coverslip difficult and a shorter distance introduces mechanical artifacts from the underlying glass surface (Fig. 5a). The needle is inserted into the device via the upper channel, which we refer to as the needle guide. To prevent the hydrogel from leaking into the media ports prior to polymerization, the needle guide must be square in cross-section with a side-length approximately equal to the diameter of the needle (Fig. 5a). This process of creating stacked needle buffer and needle guide requires 3-layer photolithography. The first layer defines the height of the needle buffer, the second is made to be the same thickness as the needle diameter, and the third layer determines the height of the gel region above the needle (Fig. 5b).
Figure 5.

Overview of geometry for photolithography. (a) Schematic of device illustrating how the stacked needle guide and needle buffer layers enable the needle to be raised from the glass surface. The thickness of the needle buffer layer determines the distance of the needle from the glass. (b) Schematic of the silicon master demonstrates that three layers of photoresist are required to fabricate an overhanging structure in the needle guide area to allow the needle to be lifted from the glass surface. This structure is required for the vessel to be surrounded by the 3D hydrogel.
Soft lithography and device functionalization
Individual microfluidic devices are made from casting polydimethylsiloxane (PDMS) on the silicon master mold. PDMS is poured onto the mold as a two-part liquid and polymerized at 60°C. The resulting elastomer negative mold is trimmed, and holes are punched to serve as the ECM and media ports (Fig. 2). Individual PDMS devices are bonded to coverslips using oxygen plasma, and the PDMS surface is functionalized to promote binding to ECM. The specific surface functionalization depends on the ECM or hydrogel material used. In general, we treat with poly-L-lysine and glutaraldehyde sequentially to promote binding of collagen. After surface functionalization and sterilization, the steel needles are introduced via the needle guides into the device prior to injecting hydrogel in the device gel region. The polymerization parameters will depend on the hydrogel, and the procedures reported here are specific to collagen I, which we use commonly as the 3D ECM in hEMVs. After polymerization, the needle is removed to create the cylindrical void in the hydrogel and the devices are washed prior to cell seeding.
Cell seeding
The gel-filled microfluidic devices are then seeded with vascular cells and cultured under shear to produce hEMVs with patent vessels. First, excess ECM is cleared from the ECM ports of the rinsed devices in order to provide a transmural pressure gradient which will aid in seeding cells along the sides of the channel. Next, pericytes and/or endothelial cells are added in suspension to the two media ports at a slight pressure gradient in order to stimulate flow through the channel. At this point the gel ports are once again emptied, to ensure that pressure gradients exist in both transmural and luminal directions. Flow should be verified on a bright field microscope, then the devices should be flipped upside down to aid in seeding the top of the channel. From here, the hEMV should be checked by eye every 1 min until there is uniform layer attached to the top channel – this layer should have cells that are close, but not touching (Fig. 6a). At this point, the devices should be kept right side up until the bottom of the channel seeds in a similar manner. Both too few cells (Fig. 6b) or too many cells (Fig. 6c) can lead to inconsistent permeability values due to the presence of holes in the channel or cells which cannot spread properly. It is important to monitor the channels regularly as they seed, some adjustments can be made to prevent common seeding inconsistencies (Table 1) in order to maximize hEMV yield. These hEMVs are then added to an incubated rocker and can be cultured and assayed for 24-72 hours.
Figure 6.

Seeding HUVEC into hEMVs. Channels seeded with HUVECS at different densities immediately after seeding (top), or after one day of shear (bottom). Examples of seeding at (a) appropriate density, (b) low density, and (c) too high density. Scale bar 150 μm.
Table 1:
Troubleshooting
| Step | Problem | Possible cause | Identification | Solution |
|---|---|---|---|---|
| 4 | Photoresist issues | Unclean silicon wafer surface | Dimples form in the surface of the photoresist prior to exposure | Use a hot piranha (sulfuric acid and hydrogen peroxide) bath to clean wafer surface prior to spinning photoresist |
| 13, 17, 21 | Thermal expansion of photoresist | Cracking of features prior to wafer development | Due to mismatch in the thermal expansion coefficients of photoresist and silicon, long UV exposures can cause cracking in patterned features. Pulsed UV allows the photoresist to cool between exposures. | |
| 5, 23 | Wafer development issues | Photoresist not adhered to silicon wafer surface | Photoresist detaches from silicon during development | Spin a thicker adhesion layer to promote thick photoresist adhesion to silicon surface, or decrease development times |
| 66, 75 | Cells attaching to collagen very slowly | Collagen not rinsed overnight | Cells collide with tube walls without sticking | May be able to save by seeding for longer times - always rinse gels overnight before seeding |
| 75 | Cell solution too dilute | Cells are flowing through channel infrequently, but at good speed | Remove cell suspension from wells and replace with more concentrated solution | |
| 75 | Cells moving through channel too fast or slow | Gel has ripped off the edge of PDMS | Examine where the gel meets the PDMS for areas of detachment | Defective device |
| Pressure gradients are off | No defects observed in gel | Take 5-10 μl of cells from one media port and add it to the opposite side | ||
| 70, 75 | Cells are not seeding on the sides of the channel | Media was not removed from gel ports | Gel ports are filled | Remove media from ports and continue |
| 75 | Gel has ripped off the edge of PDMS | Examine where the gel meets the PDMS for areas of detachment and cells flowing into gel port | Defective device | |
| 70, 75 | One side of channel seeding faster than the other | Media only removed from one gel port | Inspect gel ports | Remove media from port and continue |
| 75 | Cells are not seeding evenly | A small defect in the channel (bubble, rip, etc.) | Inspect channel uniformity | Reverse direction of seeding flow mid-way through to compensate |
| 75 | Clump of cells is disrupting flow | Cells seeding faster on one edge of the channel | Reverse direction of seeding flow mid-way through to compensate | |
| 77b | Applying flow | Tubing is not clean | Cells delaminate from vessel surface under flow | Use PharmMed tubing to reduce cytotoxicity and clean tubing with ultrasonic cleaning solution after each use |
To investigate the role of hemodynamic shear stress in regulating barrier function, we built hEMVs to model the microvasculature, with a vessel diameter of around 150 μm and seeded with human dermal microvascular endothelial cells (hMVEC-D)14. The protocol described here details the seeding of hMVEC-D, though we have also reported hEMVs formed with human umbilical vein endothelial cells (HUVECs)15,36,39 and human kidney endothelial cells16. The endothelial cell type should be chosen based on the biological questions to be investigated with the hEMV platform, though some optimization in the seeding process is required to achieve proper cell density, and the use of alternative extracellular matrix or basement membrane components might be required to promote cell adhesion and vascular function (BOX 1).
Application of flow
We describe two methods for applying hemodynamic flow to hEMVs: 1) connecting a syringe pump to apply unidirectional flow at a defined volumetric flow rate, 2) placing devices on a standard laboratory rocking platform that generates gravity-driven oscillatory flow. Although syringe pumps provide the most consistent and physiologically relevant flow, connecting devices to external pumps can be cumbersome, requires significant media and reagent use, decreases experimental throughput, and increases the probability of contamination. The rocker allows applying the same flow rate to hundreds of devices simultaneously, and although the oscillatory flow is not physiological for the microvasculature, we have demonstrated that the rocker generates sufficient shear stress to promote lower vascular permeability than devices cultured statically.
Attaching a syringe pump without introducing bubbles or causing significant mechanical strain in the hydrogel is challenging, and here we report a method where the syringe pump acts to refill a hydrostatic reservoir. This method is advantageous for multiple reasons. The reservoir dampens mechanical oscillations caused by stick-slip in the syringe40, acts as a bubble trap to prevent bubbles from damaging cells or clogging the channels, and allows the tubing to be transferred to a new syringe for long-term flow studies. We have performed syringe-pump driven flow studies for 3 days, and the assay is compatible with longer-term study with appropriate syringe and media bath exchange. To determine the appropriate flow rate for a given shear stress, we invoke conservation of momentum for fluid in a cylinder, and assume viscous dominated flow, given the flow rates and geometry for the devices reported here. Further, we assume the culture media is a Newtonian fluid, to formulate the following relationship between the volumetric flow rate and the wall shear stress41:
| (eq. 1) |
Where Q is the volumetric flow rate, r is the vessel radius, μ is the fluid viscosity, and τ0 is the shear stress at the vessel wall.
For determining the shear stress imparted by a rocker, we follow the same assumptions to formulate the following relationship between the angle of the rocker and the wall shear stress:
| (eq. 2) |
Where ρ is the fluid density, g is acceleration due to gravity and α is the angle of the rocker. This relation also assumes that the rocker is moving at sufficient speed to prevent reservoir height equilibration at the maximum deflection angle. Although the rocker and the syringe pump can generate equivalent levels of wall shear stress, the dynamics are quite different for each flow regime. The rocker induces cyclic flow while the total volume of media in each device remains constant, and the syringe pump induces steady, laminar flow while the total volume of media increases linearly with time (Fig. 9). Each flow regime promotes barrier function and cytoskeletal alignment, though the syringe pump promotes greater assembly of actin stress fibers and a less pronounced cortical actin signature (Fig. 9). While the rocker involves lower experimental overhead and enables higher throughput, the flow profile from the syringe pump is more physiologic.
Figure 9.

Expected results for flow and permeability in hEMV. a) Applying flow via syringe pump (top) continuously adds fluid to a hydrostatic reservoir, while applying flow via the rocker (bottom) tilts the device in a cyclic pattern to induce flow by holding one media port at a higher level than the other. b) The syringe pump induces unidrectional flow, but requires significant media usage over time, while the rocker uses less media and enables flow to be applied to many devices at a time but imparts oscillating flow. c) Applying flow via rocker or (d) syringe pump promotes cell alignment, though cortical actin is more pronounced in hEMVs on the rocker, while stress fiber number and alignment are increased on the syringe pump (white – phalloidin to stain F-actin, magenta – nuclei, scale bar 50 μm). e) Applying flow via syringe pump or rocker reduces the diffusive permeability of hEMVs (values plotted are PD [cm/s] x 106, and thus 8 on the y-axis indicates Pd = 8 x 10⁻⁶ cm/s, n = 3 devices per condition, mean ± SEM, **p<0.01 vs. static as determined by Student’s t-test).
Barrier function assay
To quantify the diffusive permeability, we introduce fluorescent dextran into the hEMV vessels and image the vessels over time on a confocal or epifluorescent microscope. By assuming the intensity of fluorescence is proportional to the number of molecules in solution, we can invoke the following definition to quantify the diffusive permeability coefficient42:
| (Eq. 3) |
Where J is the mass flux of dextran, cvessel is the concentration of dextran in the vessel, and cECM is the concentration of dextran in the perivascular ECM. The intensity of dextran in the vessel determines cvessel, and for early time points, we assume cECM is negligible. Therefore, by tracking the change in intensity of dextran in the ECM over time, we can determine the mass flux, and calculate the diffusive permeability coefficient with Eq. 3 (See Supplementary Methods for detailed derivation and Supplemental material for sample Matlab code for quantifying diffusive permeability from timelapse images). This formulation is independent of the molecular weight of the dextran, and the experimental and computational protocols described here can be used with dextrans of varying molecular weight. By co-injecting blue 10 kDa dextran and red 70 kDa dextran, we have quantified the diffusive permeability as a function of molecular weight15. We most commonly use 70 kDa dextran due to the similarity in size to albumin and Evans blue dye, which provides physiologic relevance and enables quantitative comparison between the hEMV platform and vascular permeability measured via intravital microscopy in vivo14.
Visualization of vascular cell-cell adhesions and cytoskeleton by immunofluorescence staining
The adherens and tight junctions that couple neighboring endothelial cells, along with the associated molecular cytoskeleton, are master chemo-mechanical regulators of vascular barrier function43. hEMVs further function as a discovery platform by which these cytoskeletal structures can be analyzed in a native 3D vessel architecture embedded within physiologic, compliant ECM and enables mechanistic understanding into molecular processes regulating vascular barrier. Using this approach, we identified non-canonical Notch1 signaling as a critical regulator of VE-cadherin cell-cell adhesions and the cortical actin cytoskeleton in response to shear stress14. The permeabilization/fixation and subsequent immunofluorescence staining protocol described here is optimized for preserving and visualizing cell-cell adhesions and the associated cytoskeleton in hEMVs. Devices can be processed for immunofluorescence staining at any desired time point during device culture, allowing for the precise interrogation of the effects of both acute chemo-mechanical stimuli and long-term genetic perturbation on vessel cytoskeletal architecture. The inherently low microfluidic volumes in hEMVs allow minimal consumption of key antibody reagents. Additionally, hEMVs are compatible with high resolution confocal imaging, as the described microfabrication protocols generate vessels within a working distance of approximately 250 microns, which is compatible with water immersion and silicon oil objectives.
MATERIALS
REAGENTS
COMMON REAGENTS USED IN MULTIPLE STEPS
- Ethanol (200 proof, Thermo Fisher; cat. no. 04-355-222)
- Caution – Inflammable
Deionized water (DI-H2O)
- Isopropyl alcohol (IPA, Thermo Fisher; cat. no. A416-4)
- Caution – Inflammable
Bovine serum albumin (BSA, Millipore Sigma; cat. no. A2058)
Magnesium chloride hexahydrate (Millipore Sigma; cat. no. M9272)
Calcium chloride dihydrate (Millipore Sigma; cat. no. C7902)
Phosphate buffered saline (PBS, Thermo Fisher Scientific; cat. no. BP3994)
PHOTOLITHOGRAPHY
- SU-8 2002/2010/2100/2150 Photoresist (MicroChem)
- Caution - Inflammable. Avoid prolonged exposure or inhalation. Handle in a properly vented chemical hood and wear goggles, gloves, and protective clothing.
- Critical Reagent – Although different combinations of photoresist and spin parameters can be used to generate a layer with a given thickness, we recommend the specific SU-8 photoresist formulations and spin rates that we report here, which have been optimized for the hEMV platform.
- Microposit S1813 photoresist (MicroChem)
- Caution - Inflammable. Avoid prolonged exposure or inhalation. Handle in a properly vented chemical hood and wear goggles, gloves, and protective clothing.
- Critical Reagent – This photoresist is used to formulate the blocking layer, which is critical to fabricate overhanging needle guide channels.
- Propylene glycol monomethyl ether acetate (PGMEA, Millipore Sigma; cat. no. 484431)
- Caution - Inflammable. Avoid prolonged exposure or inhalation. Handle in a properly vented chemical hood and wear goggles, gloves, and protective clothing
REPLICA MOLDING AND SOFT LITHOGRAPHY
- Smooth-Cast 310 (Smooth-ON)
- Critical Reagent – We have found that this reagent molds the small and overhanging needle guide features necessary for proper replica molding of the silicon master.
- trichloro(1H,1H,2H,2H-perfluorooctyl)silane (Fluoro silane, Millipore Sigma; cat. no. 448931)
- Caution – Toxic. Handle in a properly vented chemical hood with gloves and protective clothing.
Polydimethylsiloxane (PDMS, Dow Corning Sylgard 184)
Cover glass, 34x20mm, no.1 (VWR, cat. no. 48393-092)
Poly-L-lysine (PLL, Millipore Sigma; cat. no. P8920)
- Glutaraldehyde (Electron Microscopy Sciences; cat. no. 16310)
- Caution – Toxic. Handle in a properly vented chemical hood with gloves and protective clothing.
Vacuum grease (Millipore Sigma; cat. no. Z273554)
- Ultrasonic cleaning solution (Thermo Fisher Scientific; cat. no. 15-335-80)
- Critical Reagent – Cleaning tubing after each use greatly extends the life of the flow system, and we found this reagent prevents fouling and maintains cell viability by cleaning media components from the tubing after each use.
CELL CULTURE & DEVICE SEEDING (for hMVECs & HUVECs)
Collagen I (from Rat Tail, Corning; cat. no. 354236)
Thrombin (from bovine plasma, Sigma; cat. no. T7201-100UN)
Fibrinogen (from bovine plasma, Sigma; cat. no. F8630-5G)
- Sodium hydroxide (NaOH, Millipore Sigma; cat. no. S2770)
- Caution – Caustic. Handle with proper gloves and protective clothing.
Dulbecco’s Modified Eagle Medium, 4500 mg/L glucose and L-glutamine, without sodium bicarbonate, powder (Millipore Sigma; cat. no. D5648)
Sodium bicarbonate (NaHCO3, Millipore Sigma; cat. no. S5761)
HEPES (Millipore Sigma; cat. no. H3375)
Vaseline (Millipore Sigma; cat. no. 16415)
Lanolin (Millipore Sigma; cat. no. L7387)
Paraffin (Millipore Sigma; cat. no. 327212)
Water resistant nail polish (Thermo Fisher Scientific; cat. no. 50-949-071)
Trypsin-EDTA (0.05%), phenol red (Trypsin, Thermo Fisher Scientific; cat. no. 25-300-054)
Penicillin-Streptomycin (Pen/strep, Thermo Fisher Scientific; cat. no. 15-140-148)
Fetal bovine serum (FBS, Thermo Fisher Scientific; cat. no. 10437028)
- Endothelial cells of interest, e.g. human neonatal dermal microvascular endothelial cells (hMVEC-DBINeo; Lonza; cat. no. CC-2813) or human umbilical vein endothelial cells (HUVECs; Lonza; cat. no. CC-2517)
- Caution – The cell lines used should be regularly checked to ensure they are authentic and not infected with mycoplasma.
Endothelial cell culture medium of interest, e.g. EGM2-MV bullet kit (for hMVECs; Lonza; cat. no. CC-3202) or EGM2 bullet kit (for HUVECs; Lonza; cat. no. CC-3162)
- Stromal cells of interest, e.g. bone marrow derived mesenchymal stem cells (hMSC; Lonza; cat. no. PT-2501)
- Caution – The cell lines used should be regularly checked to ensure they are authentic and not infected with mycoplasma.
Bone marrow stromal cell culture medium of interest, e.g. DMEM, low glucose (Life Technologies, cat. no. 11885) supplemented with 10% FBS and 1% Pen/strep
FIXATION AND STAINING
- 16% paraformaldehyde (Thermo Fisher Scientific; cat. no. 28908)
- Caution - Irritant to eye and skin. Wear goggles and gloves while handling.
Triton X-100 (Millipore Sigma; cat. no. x100)
Primary antibodies (anti-VE-cadherin, Santa Cruz; SC9989)
Secondary antibodies (Alexa Fluor 647 goat anti-mouse IgG, Life Technologies; cat. no. A-21235)
DAPI (Invitrogen, cat. no. D3571)
Alexa Fluor 488-conjugated Phalloidin (Life Technologies; cat. no. A12379)
Isotype-specific serum (Donkey, Goat, etc.; dependent on secondary antibody host species)
PERMEABILITY MEASUREMENT
Fluorescent dextran (70kDa red, Life Technologies; cat. no. D1830)
EQUIPMENT
COMMON EQUIPMENT USED IN MULTIPLE STEPS
Autoclave
Microwave
Vacuum chamber (McMaster-Carr; cat. no. 2204K7)
Plasma Etcher (PlasmaEtch; cat. no. PE-25)
Compressed N2 gas (Airgas)
Aluminum foil
100mm aluminum weighing dish (Thermo Fisher Scientific; cat. no. 08-732-103)
Orbital shaker (Fisher Scientific; cat. no. 10-320-813)
Parafilm (Thermo Fisher Scientific; cat. no. 13-374-12)
Borosilicate glass scintillation vial (7mL, Thermo Fisher Scientific; cat. no. 03-337-26)
Laboratory wipes, (ex. Kimwipes, ThermoFisher Scientific; cat. no. 06-666)
Clear tape (3M; Scotch Tape)
Razor blades
Blunt tweezers
PHOTOLITHOGRAPHY
AutoCAD (Autodesk)
Illustrator (Adobe)
Film transparency masks (Fineline Imaging)
UV mask aligner (for multilayer photolithography, SUSS MicroTech)
Dissection microscope (Nikon SM1270)
Spin coater (Laurrell; cat. no. WS-400B-6NPP/LITE)
Programmable hotplate (ThermoFisher Scientific; cat. no. HP88850190)
Ultrasonic cleaner (McMaster-Carr; cat. no. 32695K38)
Glass dish (Cole-Parmer; cat. no. UX-34550-04)
Silicon wafers (3”, University Wafer; cat. no. 695). Larger wafers can be used to fabricate more devices per master.
Calipers
Dust-free wipes (ITW Texwipe; cat. no. TX312)
Low particle bottles (VWR; cat. no. EP114-125A-LP)
Heated orbital shaker (Fisher Scientific; cat. no. 8291J35)
REPLICA MOLDING AND SOFT LITHOGRAPHY
UV Hood (Certified Material Testing Products; cat. no. BCL-UVC-01)
Two laboratory ovens (60°C and 100°C, McMaster-Carr; cat. no. 3258K22)
Acupuncture needles (160 μm diameter, Lhasa Oms Seirin; cat. no. Sj10.16x30 2)
Cover glass (22x40mm #1, Thermo Fisher Scientific; cat. no. 12-545C)
Biopsy punch (2mm and 5mm, Thermo Fisher Scientific; cat. no. 12-460-399, 12-460-411)
CELL CULTURE & DEVICE SEEDING
Biosafety cabinet
Humidified cell culture incubator
Cell culture centrifuge
Analytical balance
Tissue culture microscope
Tissue culture supplies (e.g. micropipette tips, serological pipettes, micropipettes, disposable tubes; Thermo Fisher Scientific)
Hemocytometer
Petri dishes (150mm, 100mm; Thermo Fisher Scientific)
Deep dish petri dishes (100mm; Thermo Fisher Scientific; cat. no. FB0875711)
Multichannel pipette (ThermoFisher Scientific; cat. no. 03-837-309)
Gel filling pipette tips (ThermoFisher Scientific; cat. no. 02-707-138)
Beaker (150 mL, Cole-Parmer; cat. no. EW-34512-06)
Optional: Ice block (CoolSink XT96F, Flat Bottom Plate Module, Corning; cat. no. 432070)
APPLYING FLOW
- Rocker (BenchRocker 2D, Benchmark Scientific; cat. no. BR2000)
- Critical Equipment – This rocker is placed inside of a humidified cell culture incubator, and we found that his model rocker performed well for years in the high humidity and high CO2 environment of the incubator.
Syringe pump (PHD22/2000, Harvard Apparatus; cat. no. 70-2009)
Male tubing connectors (Quick-turn, barbed tube, 1/8” ID, McMaster-Carr; cat. no. 51525K271)
Female tubing connectors (Quick-turn, sockets, 1/8” ID, McMaster-Carr; cat. no. 51525K293)
Plastic barbed tube fitting (for 3/16” ID tubing, McMaster-Carr; cat. no. 5117K45)
Non-contact valve (McMaster-Carr; cat. no. 5031K11)
Tubing (PharmMed, 1/8” ID, Cole-Parmer; cat. no. EW-96880-06)
Needle (20g x 1.5”, BD; cat. no. 305176)
Syringe (10mL Luer-lock, VWR; cat. no. BD309604)
IMAGING AND PERMEABILITY ASSAY
Confocal microscope (Zeiss Axiovert 200M inverted spinning-disk microscope with 10x air objective or equivalent)
MATLAB (MathWorks)
REAGENT SETUP
PHOTOLITHOGRAPHY
Blocking layer Combine 70 mL SU-8 2010 and 30 mL S1813 in a dust free bottle. Cover with aluminum foil and shake on heated orbital shaker at 37°C overnight. Allow solution to cool to room temperature and store for >6hrs to remove bubbles from solution. Sealed solution can be stored at room temperature (20°C) for 2 months.
REPLICA MOLDING AND SOFT LITHOGRAPHY
1% glutaraldehyde Dilute 0.2 mL 50% glutaraldehyde stock in 9.8 mL H2O. Solution can be kept at room temperature (20°C) for 1year.
0.01% PLL Dilute 1 mL 0.1% PLL stock solution in 9 mL H2O. Solution can be kept at room temperature (20°C) for 1year.
CELL CULTURE AND DEVICE SEEDING
Reconstitution buffer (RB) Dissolve 1.2 NaHCO3 and 4.8 g HEPES in 50 mL DI-H2O, and filter with 0.22 μm pore size vacuum filter. Aliquot 50x 1 mL. Aliquots can be stored at 4°C for 1 month and −20°C for 1year.
10x DMEM Dissolve 10x working concentration based on manufacturer into 50 mL DI-H2O, warm to 37°C to dissolve, filter through a 0.22 μm pore sized filter. Spin down and aliquot. Aliquots can be stored at 4°C for 1 month and −20°C for 1 year.
VALAP wax Add equal amounts by mass of vaseline, lanolin, and paraffin wax to an aluminum weighing dish. Heat wax mixture to 100°C on contact hotplate and mix. Aliquot into glass scintillation vials with 2-3 mL per aliquot. Allow to cool to room temperature. Solution can be stored at room temperature (20°C) indefinitely.
IMAGING AND PERMEABILITY ASSAY
Dextran solution Specific dextran concentrations depend on the molecular weight, fluorophore, and imaging setup. For the data provided here, TexasRed-conjugated 70 kDa dextran is resuspended in sterile PBS at 12.5 mg/mL to form a stock solution that can be stored at 4°C for 1 year. Working solutions are further diluted in culture medium to 12.5 μg/mL and can be stored at 4°C under sterile conditions for 1 month.
1x PBS++ Dilute 100 mL of 10x PBS in 900 mL of DI-H2O, and dissolve 101 mg MgCl2 hexahydrate and 133 mg CaCl2 dihydrate for 1L PBS + 0.5 mM MgCl2 + 1 mM CaCl2. Solution can be kept indefinitely at room temperature (20°C).
0.1% Triton X-100 Dilute 100 μL Triton X-100 in 100 mL of PBS++. Solution can be stored indefinitely at room temperature (20°C).
4% PFA Mix 1 mL of 16% stock PFA solution with 400 μL 10x PBS++ and 2.6 mL DI-H2O. Solution can be stored at −20°C for 1 year.
1% PFA, 0.05% Triton X-100 Dilute 50 μL Triton X-100 and 6.25 mL of 16% stock PFA in 93.75 mL of PBS++.
2% BSA Dissolve 1 g BSA in 50 mL PBS++. Vortex, warm to 37°C for dissolution. Can be stored at 4°C for 1 week.
PROCEDURE
Silicon master design and fabrication {Timing 4 days}
Design and draw transparency mask using AutoDesk AutoCAD or Adobe Illustrator. See the Experimental Design section for considerations and suggestions on designing transparency masks, and see supplementary information (Fig. S1 & Fig. S2) for details on geometry and sample masks.
- Obtain high-resolution film transparency mask (Fig. 3a). We order from Fineline Imaging, a subsidiary of Thin Metal Parts, LLC, which prints and ships masks in ~24-48 hrs.
- Pause point: The transparency masks can be stored at room temperature indefinitely. One set of masks can be used to make many silicon masters.
Dehydrate silicon wafer at 200°C for 30 min on programmable contact hot plate and allow the wafer to cool to room temperature.
- Plasma treat the wafer for 5 min at full power.
- Critical Step The procedure for spin-coating photoresist, photolithography, and wafer development are dependent on the specific equipment used and the process parameters (e.g., humidity, temperature, gas pressure, UV intensity). The parameters given in Steps 5-19 of the procedure serve only as an initial guide and should be empirically optimized for each fabrication process flow.
- Position wafer at the center of the rotating chuck of the spin coater. Dispense ~5 mL of SU-8 2002 photoresist onto the center of the wafer. Spin the wafer at 500 r.p.m. for 10 s to spread photoresist evenly across wafer surface and ramp the spin rate at 252 r.p.m/s to 2000 r.p.m. and hold at 2000 r.p.m. for 60 s to create a thin, uniform adhesion layer to strengthen the adhesion of subsequent photoresist to the silicon wafer.
- Critical step this thin layer of SU-8 2002 is used to promote adhesion of the subsequent SU-8 layers.
Soft bake the wafer for 2 min at 95°C on programmable contact hotplate to evaporate photoresist solvent.
Load the wafer into the mask aligner and flood expose wafer with an exposure dose of ~100 mJ cm−2 to uniformly expose photoresist and cure a thin, uniform adhesion layer.
Post-exposure bake the wafer at 95°C for 2 min on a contact hot plate.
- Return the wafer to the spin coater and center on the rotating chuck. Dispense ~5 mL of SU-8 2100 photoresist onto the center of the wafer. Spin the wafer at 500 r.p.m. for 60 s to spread photoresist evenly across wafer surface, and ramp the spin rate at 252 r.p.m/s to 2000 r.p.m. and hold for 60 s to create an even, ~100 μm needle buffer layer.
- Critical Step The wafer should be completely and evenly coated by photoresist prior to proceeding to subsequent steps.
- Troubleshooting
Soft bake the wafer for 5 min at 65°C and 3.5 hours at 95°C on a programmable hotplate to evaporate photoresist solvent. Allow the wafer to slowly return to room temperature overnight.
Load and center the wafer on the spin coater. Dispense ~5 mL of the blocking layer onto the surface of the wafer. Spin the wafer at 500 r.p.m. for 60 s to spread photoresist evenly across wafer surface, and ramp the spin rate at 252 r.p.m/s to 1000 r.p.m. and hold for 60 s to create an even blocking layer.
Soft bake the wafer for 30 min at 95°C.
- Load the wafer and needle buffer film transparency mask into the mask aligner, and expose the wafer through the transparency mask with an exposure dose of ~600 mJ cm−2.
- Critical Step The total photoresist thickness will be >100 μm, and UV exposure will cause the photoresist to heat, which can cause the photoresist and/or wafer to crack. To minimize cracking, pulse the UV at intervals of 25 s on and 25 s off.
- Troubleshooting
- Post-exposure bake the wafer for 5 min at 65°C and 12 min at 95°C.
- Critical Step After the post-exposure bake, the thickness of the layer can be measured with a profilometer. Given the thickness of this layer and of subsequent layers, calipers can also be used to verify layer thickness.
Load and center the wafer on the spin coater. Dispense ~5 mL of SU-8 2150 onto the surface of the wafer. Spin the wafer at 500 r.p.m. for 60 s to spread photoresist evenly across wafer surface, and ramp the spin rate at 252 r.p.m/s to 2000 r.p.m. and hold for 60 s to create an even, ~180-200 μm needle guide layer.
Soft bake the wafer for 5 min at 65°C and 80 min at 95°C.
- Load the wafer and needle guide film transparency mask into the mask aligner and align the needle guide mask with the needle buffer layer on the silicon wafer. Expose the wafer through the transparency mask with an exposure dose of ~300 mJ cm−2.
- Critical Step Alignment of the needle guide layer mask to the wafer is critical for the needle guide to align with the needle buffer and thus necessary for the functionality of the resulting device. To facilitate alignment of the mask with the wafer, alignment features are printed on the transparency mask. These features include open and closed crosses (see transparency masks in Fig. S2) to the left and right of the device features printed on the mask. Aligning the open cross on the needle guide layer to the closed cross patterned on the needle buffer layer is important to ensure device features are aligned between the layers.
Post-exposure bake the wafer for 5 min at 65°C and 12 min at 95°C.
Load and center the wafer on the spin coater. Dispense ~5 mL of SU-8 2150 onto the surface of the wafer. Spin the wafer at 500 r.p.m. for 60 s to spread photoresist evenly across wafer surface, and ramp the spin rate at 252 r.p.m/s to 1400 r.p.m. and hold for 60 s to create an even, ~200-250 μm gel top layer.
Soft bake the wafer for 5 min at 65°C and 80 min at 95°C.
- Load the wafer and gel top film transparency mask into the mask aligner, and align the gel top mask to the needle guide layer on the silicon wafer. Expose the wafer through the transparency mask with an exposure dose of ~300 mJ cm−2.
- Critical Step Alignment of the gel top layer mask to the wafer is critical for the gel top to align with the needle guide and buffer. Alignment features similar to those used to align the needle guide layer with the needle buffer layer are included on the mask (see transparency masks in Fig. S2). Aligning the open cross on the gel top layer to the closed cross patterned on the needle guide layer is important to ensure device features are aligned between the layers.
Post-exposure bake the wafer for 5 min at 65°C and 12 min at 95°C.
- Develop the wafer with PGMEA. Add wafer to PGMEA bath and agitate on an orbital shaker for 5-10 min, wash with IPA, and dry with compressed air or N2 gas. Inspect features on dissection microscope, and if further development is required, repeat PGMEA bath cycles until features are fully developed (Fig 3b).
- Troubleshooting
- Pause point Developed wafers can be stored indefinitely at room temperature.
Figure 3.

Device fabrication procedure. (a) Needles are inserted through the PDMS needle guide. (b) Device with needle inserted. (c) Collagen gel is added sequentially through the gel ports of each device and (d) fills the entire gel region without bubbles. (e) Tweezers are used to hold down the PDMS while another tweezer set is used to remove the needle steadily. After removing the needle (f) a faint channel is visible in the collagen (scale bar 100 μm), then (g) the needle guide is filled with vacuum grease in order to seal the media reservoir.
Fabrication of PDMS master negative mold {Timing 2 days}
-
24.
Plasma treat wafer at 100 W for 30 seconds at a pressure of 6x10⁻¹ mbar.
-
25.Add wafer to a vacuum chamber, features up. Add several drops (~3 μl) of trichloro(1H,1H,2H,2H-perfluorooctyl)silane to a glass coverslip and place next to wafer in the chamber. Connect chamber to house vacuum and allow vapor deposition to coat wafer with trichloro(1H,1H,2H,2H-perfluorooctyl)silane for at least 3 hours.
- Critical Step Silane treatment passivates the surface of the silicon wafer and photoresist to aid in the release of PDMS from the master mold in subsequent steps.
- Pause point: Wafer can be left in vacuum chamber overnight if needed.
-
26.
Use clear tape to secure silicon wafer to the center of a 100 mm diameter aluminum weighing dish.
-
27.
Ensure wafer is clean – use a pressurized air gun to clean off dust particles.
-
28.
Weigh ~ 50 grams of PDMS elastomer base in a disposable plastic cup. Add 5 grams curing agent (1:10 ratio of crosslinker to elastomer base). Mix thoroughly with a disposable plastic pipette and degas to remove excess bubbles.
-
29.
Pour PDMS mixture over the wafer to a height of approximately 5 mm. Degas again to remove any additional air bubbles.
-
30.
Cure the solution in a 60°C oven 4 hours to overnight, or at 100°C for > 1 hour.
-
31.Add ethanol to the weigh dish, and use a scalpel to cut around the wafer, allowing ethanol to reach the wafer while cutting. Carefully remove the PDMS from the wafer, using additional ethanol to help remove the PDMS ‘master’.
- Note: Due to overhanging features on silicon wafer, removing PDMS can crack or delaminate photoresist from silicon wafer surface, so ethanol is used to lubricate the PDMS-photoresist interface and facilitate PDMS removal from silicon wafer.
(Optional) Create a reusable plastic mold {Timing 1 day}
-
32.
Plastic copies of the silicon master can be generated to increase throughput in fabricating microfluidic devices and to allow simple replica molding of the silicon master if the plastic mold degrades or breaks over time. Without the plastic mold, new silicon masters need to be fabricated if a feature breaks, which is common with repeated removal of PDMS from the master due to the overhangs fabricated with the photoresist (Fig. 5a). We often fabricate 4-6 plastic copies (Fig. 3d) of the silicon master mold after successful master fabrication.
-
33.
Secure the PDMS ‘master’ (Fig. 3c) to the bottom of a 100 mm aluminum dish using a few drops of uncured 1:10 PDMS.
-
34.
Heat dish at 100°C for 10 minutes to cure the PDMS droplets and secure PDMS ‘master’ to the dish.
-
35.
Once secure, retrieve Smooth-Cast 310 A & B reagents. Mix 1:1 to a total of 100 mL in a disposable plastic cup. Mix thoroughly with a disposable pipette and pour over the PDMS ‘master’.
-
36.
Use a 10 μl pipette tip to dislodge visible small bubbles from surface of PDMS. Work quickly, as full plastic will polymerize within 30 minutes. As time elapses, the solution will get more viscous and increase the chances of bubble formation upon surface disruption. Allow to polymerize, checking for bubbles every 5 minutes until the solution becomes opaque. Leave at room temperature to polymerize fully overnight.
-
36.
Remove master from plastic mold. Use a razor to cut away the aluminum dish. Use blunt tweezers to clean around the top edges of plastic until PDMS master is fully visible. Remove carefully, using blunt tweezers to go around the edges of PDMS while directing an excess ethanol spray between edges of plastic and PDMS in order to make removal easier.
PDMS molding {Timing 1 day}
-
37.Mix PDMS 1:10 and degas. Pour mixture onto smooth cast mold and polymerize at 60°C overnight.
- Note: Melting temperature of Smooth-Cast is 80°C, so this process cannot be performed >80°C.
PDMS device assembly {Timing 1 hour}
-
38.
Allow mold to cool to RT. Remove PDMS using blunt tweezers and ethanol. Remove PDMS in the direction parallel to channels in order to avoid damage to small features.
-
39.
Cut PDMS into individual devices using a razor.
-
40.
Use biopsy punches to cut desired media ports (5 mm) and ECM ports (2 mm).
-
41.
Clean the surface of the PDMS using scotch tape, ensuring the channel side is free of particles.
-
42.Clean cover glass with isopropanol. Spray surface, then wipe thoroughly with Kimwipe. Use pressurized air to clean away any excess particles, and ensure the glass is thoroughly dried.
- Critical step: Insufficient wiping of coverslip may leave a residue that may prevent devices from bonding properly.
-
43.Place coverslips and PDMS (channel side up) into plasma asher. Plasma treat for 30 seconds at 100 W.
- Note: Plasma time and power are dependent on plasma generating equipment, gas, and pressure. Plasma treatment parameters should be empirically tested by measuring the contact angle of PDMS after treatment and bond strength between PDMS and glass.
-
44.
Bond PDMS to glass – press firmly and evenly with gloved fingers in order to avoid air bubbles between the PDMS and glass, but not break the coverslip. Hold the device up to a light in order to ensure no bubbles are left between the two surfaces.
-
45.Add the device to 100°C oven for at least 15 minutes in order to permanently bond the materials.
- Heat is used to promote bonding between glass and PDMS, but also lowers the hydrophobic recovery time for PDMS. Therefore, if heated for too long (>15 min), the PDMS will be hydrophobic, and subsequent surface treatments will be ineffective.
Surface treatment of devices {Timing 1 day, 15 minutes active}
-
46.
Once cooled to RT, add the devices, glass side down, to the plasma asher. Once again, plasma treat for 30 seconds at 100 W.
-
47.
Remove devices and bring to bench. Fill ECM ports with 0.1% Poly-L-Lysine (PLL), ensuring the entire gel region is wet and does not dry out. Leave for at least 4 hours or overnight to coat surface.
-
48.
Aspirate PLL and rinse thoroughly by filling the ECM and media ports with DI-H2O then aspirating water fully. Repeat this twice more.
-
49.Add 1% glutaraldehyde to the ECM port and treat for 15 minutes.
- Critical step: Add just enough to fill the ECM port, and time carefully, glutaraldehyde will diffuse into the PDMS, and in subsequent steps, leach from the PDMS into the media and hydrogel, which can be cytotoxic.
-
50.Rinse glutaraldehyde thoroughly with water 3x as before, then soak devices overnight in excess water on an orbital shaker to fully clean of any excess glutaraldehyde.
- Critical step: Soaking the devices overnight is critical to reduce the amount of absorbed glutaraldehyde. The most frequent source of cytotoxicity is insufficient washing of glutaraldehyde.
Preparing collagen gel {Timing 2 hours}
-
51.
Prepare 20 mL of a 0.01% BSA solution. Sterilize needles in 70% ethanol for at least 20 minutes, then wipe thoroughly with a Kimwipe and add to BSA solution for 30 minutes.
-
52.
Remove devices from the water bath and dry. Rinse devices with 70% ethanol then dry with an air gun.
-
53.
Remove one needle from the BSA solution. Tap on the edge of the needle on the tube to remove excess BSA, but do not dry the needle. Carefully add needle through the needle channel into the device (Fig. 4a,b), then place the device in a clean 150 mm dish.
-
54.
Once all needles have been added, UV sterilize the dish of devices for 15 minutes.
-
55.
While devices are sterilizing, prepare the collagen solution. Thaw on ice a stock of 10X DMEM and a stock of 10X reconstitution buffer (RB buffer). Also, prepare a sterile 1 N stock of NaOH and retrieve Collagen I bottle, keeping all solutions on ice.
-
56.Calculate the exact amounts of collagen needed using the stock solution density. In a microcentrifuge tube, add 10X RB and 10X DMEM at a ratio of 1/10th of necessary collagen volume. Then add NaOH, PBS and finally the collagen solution. Mix thoroughly and carefully to prevent forming air bubbles. Measure the pH using a pH strip for a desired pH of 7.4. Quickly vortex and spin (<5 s) before adding collagen to devices in order to allow air bubbles to reach the surface.
- For our stock solution (3.76 mg ml−1) we added 24 μl 10X RB, 24 μl 10X DMEM, 6 μL 1 N NaOH, 6 μl PBS and 240 μl of collagen I in order to prepare 300 μl of a 3 mg ml−1 collagen solution.
-
57.Bring sterile devices into a laminar flow hood. Working quickly, fill a 200 μl pipette with collagen, careful to avoid bubbles in the tip. Add collagen through the upper ECM port steadily until the collagen is visibly coming up into the bottom ECM port. Once full, immediately move to the next device and begin filling until all devices are full. This should take about 30 μl and 30 seconds (Fig. 4c).
- Critical Step: Working quickly ensures that collagen gels with polymerize uniformly. For this reason, limit quantities of devices that are prepared at a time. A portable ice block can also optionally be used underneath the devices to prevent the initiation of polymerization.
- Critical Step: Both pH and temperature vastly affect collagen structure upon polymerization44. Consistency here is key to reproducible results.
-
58.As soon as gels have been filled, add the dish to a 37°C, 5% CO2, humidity-controlled incubator to polymerize for 30 minutes.
- Critical Step: Be sure to add media after 30 minutes. Collagen should be left dry until it is polymerized, but extended periods without media can cause the gels to dry out irreversibly.
-
59.
Inspect devices by eye to ensure that collagen has gelled and to determine if bubbles formed around edges of PDMS (Fig. 4d)
-
60.Add ~50 μl of media to each media port. Add additional media on top of the PDMS around the two ECM ports to prevent drying, then return to the incubator.
- Pause point: Gels should be incubated for 2 hours before removing needles or can be left overnight.
Removing needles & rinsing gels {Timing 30 minutes}
-
61.
Return devices to sterile laminar hood. Bring vacuum grease, 200 μl pipette tips and tweezers to the hood.
-
62.
Using two pairs of tweezers – one placed on the PDMS to steady the device and the other to grasp the needle – carefully remove the needle (Fig. 4e). Removal is best when done steadily and slowly.
-
63.
Use vacuum grease to block off the exterior needle guide. Use a pipette tip to push grease along the edge of the PDMS-glass interface in order to fill the guide and prevent media leakage (Fig. 4g).
-
64.
Inspect the gels after removing needles – a faint channel should be visible within the collagen (Fig. 4f). Take note of if the gel has separated from the PDMS borders, or if there are divots in the channel due to air bubbles during polymerization, as these devices may not seed with cells evenly.
-
65.
Add the devices into a new 10 cm dish. Use a small amount (~5 μl) of PBS to secure the cover glass to the bottom of the dish. Carefully fold two Kimwipes together so that they are approximately the same height as the tissue culture dish. Wet these with PBS and add them vertically to the border of the dish. Repeat this until each dish has two sets. This maintains humidity within the devices, as evaporation effects can be significant with such small media volumes.
-
66.Remove and replace the media with fresh media.
- Pause point: Devices should be left in media overnight to rinse - if cells are not ready the next day, switch out media for PBS. PBS should be replaced daily and the gels can be kept for up to two weeks. If devices are stored in PBS, the PBS should be exchanged for culture medium prior to cell seeding.
Cell preparation {Timing 10 minutes}
-
67.Aspirate media from cells to be seeded in the device and rinse once with PBS. Add warm trypsin (0.05% + EDTA) and incubate until cells detach, about 1.5 minutes.
- Critical step: Cells should be 70–80% confluent before seeding in the device.
- Critical step: Trypsin can affect cell seeding, so times and concentrations should be optimized for different cell types.
-
68.
Rinse the dish with 5x volume of media containing FBS and add the solution to a fresh 15 ml conical tube. Count the cells, then centrifuge.
-
69.
Resuspend cells for seeding. For HUVECs in a 160 μm channel, typically 0.5 million cells per ml is sufficient. This concentration will need to be optimized for different cell types or different channel sizes and can be altered to change seeding rate. Higher cell densities will seed channels more rapidly, but can also increase the risk of cell clumps, while slower seeding rates can be beneficial for channel homogeneity, seeding must be rapid enough to prevent extended periods of storing the cells in suspension.
Channel seeding {Timing 1-1.5 hours}
-
70.Remove devices from the incubator. Use a 10 μl pipette with 10 μl pipette tips to gently clean the gel out of the ECM ports. Insert pipette tip into gel port and gently swirl in a circular motion, then aspirate up to remove dislodged gel and excess media.
- Troubleshooting: Be gentle during this step – you want to clear gel out of the port without dislodging it from the sides of the PDMS in the main gel region.
-
71.Aspirate media from the reservoirs. Use the 10 μl pipette to remove any excess media from the gel ports.
- Tip: Channels can be seeded individually or in multiples – seeding more than 3 devices at once is not recommended.
-
72.
Add cell suspension to the channels using a gradient – 40 μl on one side and 50 μl on the other should be sufficient to induce flow.
-
73.
Quickly verify via brightfield microscope that the cells are flowing through the channel, then flip the devices upside down.
-
74.
Allow the channel to seed for 1 minute before flipping and checking on the microscope. Cells should be attaching evenly through the channel. Focus the microscope up and down to visualize different cell densities on the top and bottom of the channel. The channel should be lined with cells – ideally with 1 or greater cell widths between cells to allow room for cells to spread.
-
75.Once the top of the channel has the appropriate density, seed the device right-side-up to allow cells to adhere to the channel bottom. Seeding times will vary due to various factors (trypsin times, collagen batch, cell type, passage number, etc.), but should take between 4-8 minutes total.
-
76.As soon as channel reaches the appropriate density, remove cell suspension and replace with fresh endothelial cell media. The fresh media will remove non-adherent cells and any cell debris from the microvessels.
- Tip: A 200 μl multi-channel pipette can be used to remove media from both media ports at once in order to minimize shear stress from pulling weakly adherent cells off the channel walls at this stage. The same multi-channel pipette can be used to add media back to the ports.
-
77.If you are investigating static conditions, follow option A. If you are using a rocker to maintain flow in the vessels, follow option B, and if you are using a syringe pump to apply flow at a defined flow rate, follow option C.
- Static culture {Timing 5 min}
- Place 2-3 devices in a 10 cm dish in an incubator with a damp dust-free wipe to maintain humidity in the dish.
- Change media once per day while culturing. Cells can be fixed or used in a permeability assay 14-72 hours after seeding. It is recommended to use the multi-channel pipette to simultaneously remove and add media to reduce shear stress in the channel.
- Gravity-driven oscillatory flow {Timing 5 min}
- Place the devices in an incubator on a rocker with the channels parallel to the direction of rocking (Fig. 7a). This promotes media exchange between the media ports and ECM region, and allow the cells to spread overnight.
- Change media once per day while culturing. Cells can be fixed or used in a permeability assay anywhere from 14–72 hours after seeding depending on the application.
- Syringe-pump driven unidirectional flow {Timing 2 hours}
- Fill a small beaker with water and heat to boiling in microwave. Add vial of VALAP wax to boiling water bath to melt the wax.
- Aspirate any fluid from the top of the ECM ports. Be careful not to aspirate the gel and remove just enough fluid to form a meniscus in the port.
- Using a 1 mL micropipette, cover each ECM port with a small drop of wax. The drop should cover the gel filling port but not obstruct the light path through the gel region. Allow wax to cool to RT and harden.
- Using water-resistant nail polish, seal the wax to the PDMS surface, and allow nail polish to dry in biological safety cabinet (Fig. 7b).
- Critical step: This process of using wax and nail polish to seal the gel filling ports is necessary to prevent large transmural pressure gradients when applying flow via syringe pump. If transmural or interstitial pressures and flows are an object of investigation, this step can be neglected.
- Return devices to incubator for the duration of the remaining device setup, and incubate in static conditions or on the rocker overnight prior to applying flow.
- Clean tubing and connectors with sonicating solution, and wash thoroughly with water.
- Autoclave tubing, connectors, and PDMS cap to sterilize.
- Fill tubing and syringe with perfusion media and connect tubing to syringe at one end via male Luer-lock connector, and to needle at the other end via female luer-lock connector.
- Critical step In the subsequent steps, syringe pump-driven flow is used to maintain a pressure head that drives flow into an open bath. See Experimental design for details on the advantages and drawbacks of this technique and a discussion of alternatives.
- Load syringe with tubing on syringe pump.
- Move 2-3 devices to deep dish 100 mm petri dish.
- Press-fit plastic barbed tube fittings into one end of the device.
- Fill petri dish with PBS to just cover the top of the device, and close with PDMS cap (Fig. 7c).
- Using a gel-filling pipette tip, add enough media to reservoir to establish flow at the desired rate.
- Critical step If the pressure head is not established prior to connecting the device to the syringe pump, the effective flow through the vessel will be less than prescribed by the syringe pump flow rate and will take hours to reach steady state.
- Turn the syringe pump on at the desired flow rate.
- If the total volume of media required for an experiment is greater than the volume of the syringe (for example, if high flow rates are used or if long-term experiments are performed), it will be necessary to change syringes during an experiment. To do so, fill a syringe, and remove the needle connected to the used syringe from the reservoir. Remove the syringe from the pump, reset the drive panel, add the new syringe to the pump, and the new needle to the device reservoir.
- Tip We have used this method to maintain flow for 3 days, and longer-term experiments are possible.
- Critical step If the total volume required exceeds the volume of the petri dish containing the devices, either use a larger petri dish or remove PBS and media from the petri dish with a serological pipette at regular intervals to avoid overflow.
Figure 7:
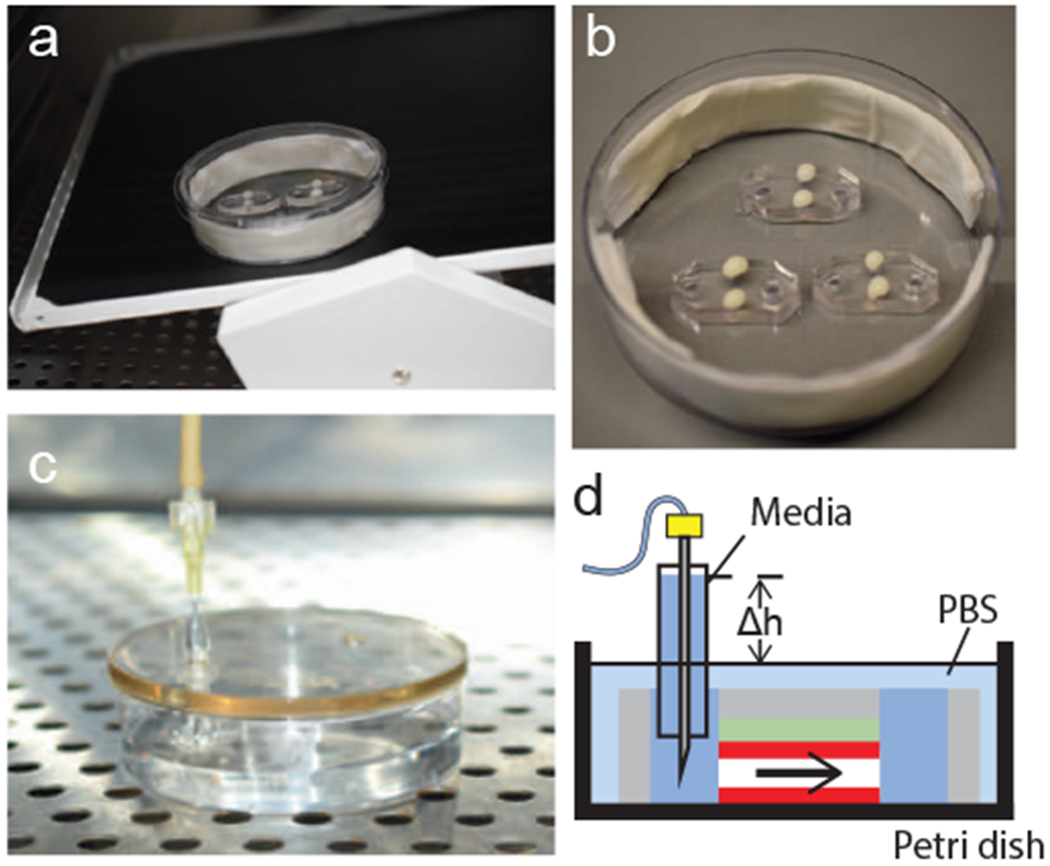
Applying flow to hEMVs. (a) An incubated rocker platform can be used to induce oscillatory flow. (b) VALAP wax and nail polish are used to seal gel ports before applying syringe-pump driven flow. (c) A well adapter is added to one media port, the dish is filled with PBS, and a PDMS cap is used to cover the device. The tubing is then fed into an incubator, the needle is added to the well, and the pump is started. (d) Schematic of the flow pattern for a device connected to a syringe pump for unidirectional flow.
Permeability assay {Timing 5 min per device}
-
78.Remove media from both ports.
- Critical step For the permeability assay, it is best to proceed one device at a time to ensure the devices do not dry out and there are no changes to the vascular permeability due to leaving the cells under static conditions after applying flow.
-
79.Position the device on the confocal microscope stage, and align the 10x objective with phase contrast. Position the vessel such that the whole vessel diameter is within the field of view and there is gel visible on both sides of the vessel. This ensures accurate calculation of vessel diameter. Image as much of the gel region as possible to ensure accurate imaging of dextran transport (Fig. 8).
- Critical step The parameters for the permeability assay will depend on the equipment (e.g., microscope, objective, media port size, dextran concentration) and the permeability magnitude (e.g., higher permeability values might require more frequent imaging, while lower permeability values might require less frequent imaging over longer total duration). The below parameters are based on our experience with hMVEC-DBlNeo cells imaged at 10x on a spinning disk confocal microscope and should serve only as an initial guide. All parameters should be optimized empirically for a given setup, and it is important that the mathematical analysis for quantification of permeability takes into account the correct parameter values. The response to circulating or physical cues can cause non-uniform changes in permeability, and thus it is critical to examine the vessel at low magnification to ensure that the imaged area is representative of the whole vessel response. The algorithm and MATLAB code (see supplemental information) compute one permeability value for a section of the vessel based on fluorescence intensity changes of the dextran over time, so resolution over local changes in permeability is determined by the imaging parameters.
-
80.Add 50 μL of fluorescent dextran solution to one media port
- Critical step Add enough solution to ensure a roughly constant perfusion rate for the duration of imaging to support the assumption that the concentration of dextran in the vessel is constant.
-
81.Acquire images every 10 s for 1-5 min.
- Critical step We quantify permeability by measuring the mass flux of dextran at the midplane of the vessel. If alternative imaging parameters are used, it’s fine, just be sure to adjust the parameters in the analysis MATLAB code (see supplemental material).
-
82.
To analyze and quantify the diffusive permeability, see Fig. 8 for the general algorithm and supplementary methods for the derivation of relevant formulas and for the MATLAB code.
Figure 8.
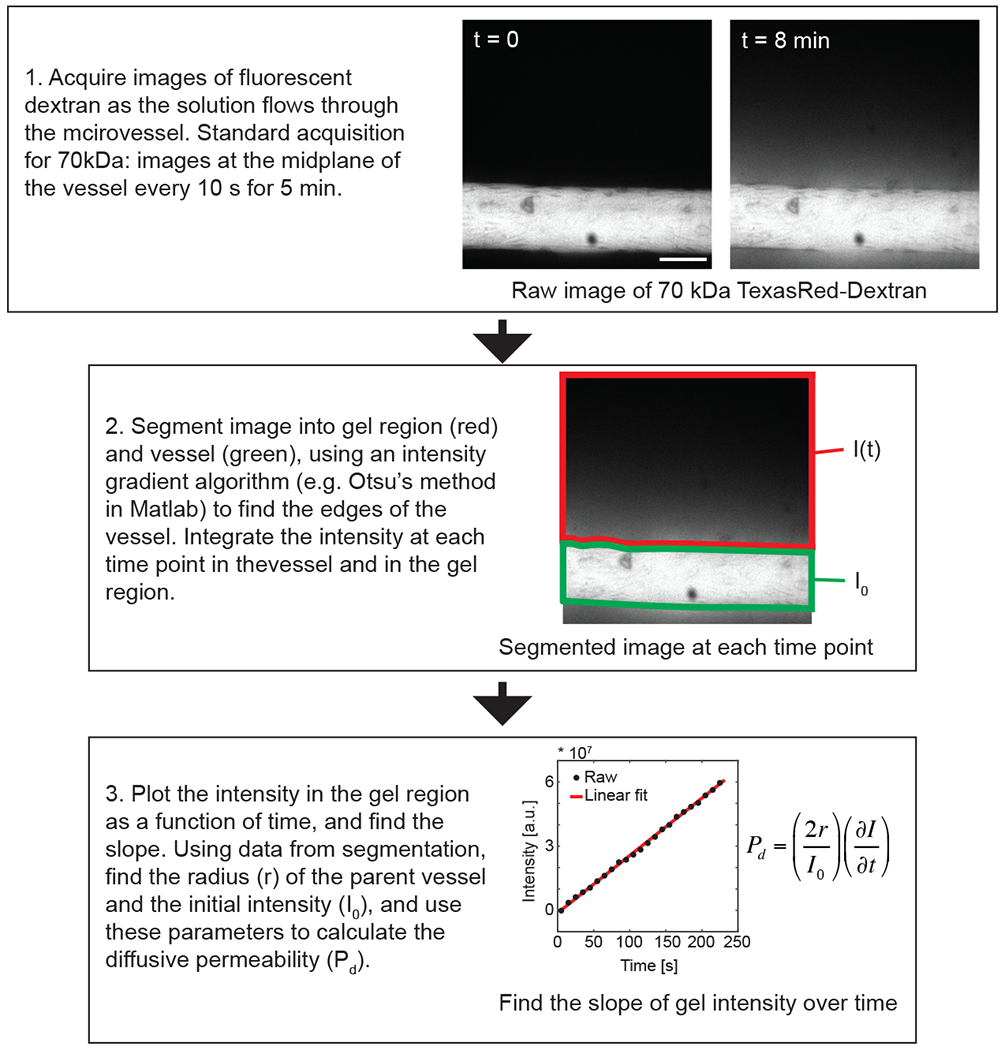
Process for quantifying diffusive permeability of vessels in the hEMV platform. Time-lapse images of dextran flux are taken at the mid-plane of the vessel. For hEMVs formed with hMVEC-D cells, 5 min is sufficient to quantify the difference in diffusive permeability to 70 kDa dextran, but in the Step 1 subpanel, an image at 8 min is included to clearly show diffusion of the dextran into the collagen gel region.
Visualization of cellular junctions and cytoskeleton via immunofluorescence staining {Timing 2-3 days)
-
83.
Prepare a buffer solution of phosphate buffered saline with calcium and magnesium (PBS++, 1mM CaCl2, 0.5 mM MgCl2).
-
84.Prepare working solutions:
- Permeabilization/Fixation: 1% paraformaldehyde, 0.05% Triton X-100 in PBS++.
- Post-fixation: 4% paraformaldehyde in PBS++.
- Post-permeabilization: 0.5% TX-100 in PBS++.
- Blocking buffer: 10% Isotype-specific serum (ex. Donkey, Goat), 2% IgG-free bovine serum albumin in PBS++.
-
85.Warm all solutions to 37°C prior to adding to devices.
- Critical step: Ensure proper solution and incubation temperatures, along with solute concentrations in the basal buffers, to preserve vessel adhesive and cytoskeletal integrity.
-
86.
Using a multi-channel pipette with two pipette tips fitted such that they span the length of the device ports, slowly remove the culture media from the device. Add 100 μl of pre-warmed Permeabilization/Fixation Solution to each port and incubate at 37°C while rocking along the vessel axis for 90 seconds.
-
87.Immediately remove Permeabilization/Fixation solution using a multichannel pipette and replace with 100ul of Post-fixation solution. Incubate at 37°C while rocking along the vessel axis for 15 minutes.
- Critical step: Do not include a wash step between Permeabilization/Fixation and Post-fixation incubations.
-
88.
Remove Post-fixation solution. Wash devices three times with PBS++ by adding 100 μl to each port and gently pipetting up and down three times.
-
89.
After the third wash, remove PBS++ and add 100 μl of Post-permeabilization solution to each port using a multichannel pipette and incubate at 37°C while rocking along the vessel axis for 10 minutes.
-
90.
Remove Post-permeabilization solution. Wash devices three times with PBS++ by adding 100 μl to each port and gently pipetting up and down three times.
-
91.
After the third wash, remove PBS++ and add 100 μl of Blocking buffer to each port to block non-specific sites. Incubate at room temperature while rocking along the vessel axis for at least one hour.
-
92.Dilute primary antibodies in Blocking buffer. Add the antibody/Blocking buffer solution to each port and incubate either at room temperature for one hour or overnight at 4°C, in both cases while rocking along the vessel axis.
- Tip: Primary antibody dilutions should be empirically derived and will dependent on incubation time and temperature. For visualization of VE-cadherin (Santa Cruz sc-9989, 1:300) and actin (1:500, Rhodamine Phalloidin), incubate overnight at 4°C.
-
93.
Wash devices three times with PBS++ by adding 100 μl to each port and gently pipetting up and down three times. Then, for each wash allow devices to rock along the vessel axis for at least 10 minutes each at room temperature.
-
94.Dilute secondary antibodies in Blocking buffer. Add the antibody/Blocking buffer solution to each port and incubate either at room temperature for 45 minutes or overnight at 4°C, in both cases while rocking along the vessel axis.
- Tip: Secondary antibody dilutions should be empirically derived and will dependent on incubation time and temperature.
-
95.
Wash devices with PBS++ three times with PBS++ by adding 100 μl to each port and gently pipetting up and down three times. Then, for each wash allow devices to rock along the vessel axis for at least 10 minutes each at room temperature.
-
96.Devices can be stored at 4°C in PBS++, protected from light, until analysis by microscopy.
- Tip: Highest quality images are obtained within 24 hours of staining.
- Pause point.
BOX: Modular extracellular matrix composition in hEMVs {1 hr to 1 day}
Endothelial cells derived from different origin tissues and/or specific experimental design criteria may require a 3D hydrogel that incorporates additional or altogether different extracellular matrix ligands to support vascular function. For example, introducing basement membrane proteins prior to channel seeding may aid in the adherence, stability, and promotion of vascular function in specific endothelial subtypes. Similarly, modulating the composition of the interstitial ECM by the inclusion of different bulk ligands and soluble growth factors allows for the simulation of specific developmental, tissue-specific, or pathologic microenvironments. Here we present two methods of: 1) introducing ECM ligands via passive absorption onto the luminal surface of hollow collagen hydrogels prior to vessel seeding and 2) changing the ECM composition of the bulk hydrogel.
Passive absorption of ECM ligands onto luminal channel surfaces within 3D collagen hydrogels
Prepare buffer solution of phosphate buffered saline with calcium and magnesium (PBS++, 1mM CaCl2, 0.5 mM MgCl2).
Chill PBS++ to 4°C and thaw extracellular matrix ligands on ice.
After the removal of needles and application of vacuum grease (Steps 61-66), incubate device on ice for 30 minutes to cool.
- While devices chill on ice, dilute ECM ligands in chilled PBS++ on ice: fibronectin 10 μg/ml, collagen IV 100 μg/mL, growth factor reduced Matrigel (2% v/v).
- Critical step: Ensure all working protein solutions are kept on ice.
After incubating on ice for 30 minutes, keeping devices on ice and add 100 μl of ECM solution to each device port. Incubate overnight at 4°C on a rocker, rocking along the vessel axis.
The next morning, chill PBS++ on ice for 30 minutes.
Using a multichannel pipette, gently remove ECM solution from each port simultaneously.
Add 100 μl of chilled PBS++ to each port and gently pipette up and down three times. Remove PBS++ and repeat two more times.
After three PBS++ washes, remove devices from ice and proceed to cell seeding.
Alternative bulk hydrogel ECM composition
Bulk fibrin hydrogel
Dissolve fibrinogen into PBS++ at a concentration of 2.5 mg/mL at 37°C. Filter sterilize through a 0.2 μm filter.
Prepare thrombin solution at a concentration of 100U/ml in PBS++. Once dissolved, filter through a 0.2 μm filter.
Sterilize devices via UV exposure for 15 minutes prior to adding ECM.
On ice, mix 1 μL of thrombin solution with 60 μL of fibrinogen.
Bring sterile devices into laminar flow hood. Working quickly, fill a 200 μl pipette with ECM solution, careful to avoid bubbles in the tip. Add ECM through the upper gel port steadily until the solution is visibly coming up into the bottom gel port. Once full, immediately move to the next device and begin filling until all devices are full. This should take about 30 μl and 30 seconds.
As soon as gels have been filled, add the dish to a 37°C, 5% CO2, humidity-controlled incubator to polymerize for 15 minutes.
After 15 minutes, fill media to the reservoirs (~50 μl each). Add additional media on top of the PDMS around the two gel ports, then return to the incubator.
Mixed bulk collagen I/Matrigel hydrogel
- Thaw an aliquot of Matrigel on ice.
- Critical step: Always ensure Matrigel is thawed and kept on ice prior to polymerization.
Sterilize devices via UV exposure for 15 minutes prior to adding ECM.
Prepare collagen stock solution as outlined in Steps 55-56.
- On ice, mix collagen solution and Matrigel at a ratio of 9:1 (collagen:Matrigel, 10% Matrigel v/v). Mix thoroughly, careful not to introduce air bubbles.
- Tip: Final concentrations of collagen and Matrigel may need to be empirically derived for the specific application.
Bring sterile devices into laminar flow hood. Working quickly, fill a 200 μl pipette with ECM solution, careful to avoid bubbles in the tip. Add ECM through the upper gel port steadily until the solution is visibly coming up into the bottom gel port. Once full, immediately move to the next device and begin filling until all devices are full. This should take about 30 μl and 30 seconds.
As soon as the gels have been filled, place the dish in a 37°C, 5% CO2, humidity-controlled incubator to polymerize for 30 minutes.
After 30 minutes, add culture media to the reservoirs (~50 μl each). Add additional media on top of the PDMS around the two gel ports, then return to the incubator.
ANTICIPATED RESULTS
This protocol establishes hEMVs as a robust and modular platform to quantitatively measure in real-time the barrier function of engineered 3D human microvessels. hEMV compatibility with high-resolution confocal microscopy further permits the simultaneous analysis of endothelial cytoskeletal and adhesive changes in response to both genetic, chemical, or mechanical perturbations14. Although the overhead to introduce the hEMV platform from scratch is relatively high compared to commercially available shear assays, the yield for the devices is high once the desired silicon master has been successfully fabricated. We find our silicon master yield to be ~25% from spinning the initial adhesion layer to development with appropriate layer thicknesses. After replica molding and fabricating the plastic mold, our yield is >90% from pouring PDMS to seeding devices with cells. We lose, on average, 5-10% of devices when applying flow with a syringe pump due to issues associated with tubing or bubbles, but the yield when using the rocker is near 100%. Because many plastic molds can be made from a single silicon master, we often fabricate 12-18 PDMS devices at a time to maximize yield.
Applying physiologically-relevant laminar shear stresses (> 3 dyne/cm2) to hEMVs via oscillatory gravity-driven (lab rocker) or uniform pump-driven (syringe pump) flows to the lumens of hEMVs (Fig. 9a and Fig. 9b), induces dramatic morphological changes in endothelial cell alignment, vessel caliber, bolstering of VE-cadherin containing adherens junctions, and the cortical organization of actin (Fig. 10a and Fig. 10b). The non-homogeneous staining of VE-cadherin is similar to what has been observed in areas of low or disturbed flow in vivo10,45, and though macroscopic gaps are observed in static conditions, (Fig. 10b) we found that flow does not significantly affect the resulting cell density in hEMVs and that the formation of these gaps is driven by the absence of flow-induced modulation of adherens junction elaboration and stability14. The concurrent perfusion of 70 kDa fluorescently-labeled dextran permits the quantification of vascular permeability by monitoring the diffusion of dextran from the lumen into the interstitial matrix. Perfusion at flow rates that impart shear stress-driven changes to vessel morphology (5 dyne/cm2) also promotes a functional vascular barrier resistant to leakage14 (Fig. 9c–e). These data demonstrate the versatility of hEMVs in achieving quantification of vascular barrier and a detailed description of associated EC cytoskeletal changes under settings relevant to basic research and pharmacologic testing. Future iterations to hEMV device design will allow for the precise interrogation of the influence of relevant chemo-mechanical factors, such as interstitial pressures and flows, ECM ligands and mechanics, and hypoxia, on microvascular function. To enable these studies, ports, and channels can be added to hEMVs that can be connected to hydrostatic reservoirs for modulating the pressure in the ECM compartment independent of the vessel lumen as gradients in pressure in the ECM have been found to modulate sprouting angiogenesis39,46 and cell migration14,47. The incorporation of synthetic gels, such as dextran hydrogels48, will enable investigation into the role of ECM composition and mechanical properties on barrier function and sprouting. Additionally, the role of hypoxia on vessel function can be investigated by incorporating gas channels49 into the gel region either in-plane with the microvessels or above or below the channel to locally control oxygen tension.
Figure 10.

Images of hEMV platform cultured under flow. a) Images of hEMVs cultured on the rocker. b) Applying flow to impart 5 dyne/cm2 shear stress at the wall induces cell alignment and promotes adherens junction formation. c) Intensity of Texas Red-conjugated 70 kDa dextran demonstrates that flow (flow applied via syringe pump to induce 5 dyne/cm2 wall shear stress) enhances hEMV barrier function (scale bar 80 μm).
hEMVs inherently focus on the examination of endothelial cell-autonomous mechanisms for controlling vascular barrier function and the associated molecular cytoskeleton. In vivo, supporting cell types, such as pericytes or tissue-specific mural cells, are critical for modulating endothelial function50,51. Thus, increasing the complexity of hEMVs through the incorporation of additional cell types, by either covering the abluminal surface with cells that share the basement membrane with the endothelium (pericytes, smooth muscle cells) or by perfusing cells through the vessel lumen (whole blood, platelets, immune cells), we can begin to build a more complete model of the human microvasculature. We show that human bone marrow stromal cells (hBMSCs), which exhibit mural cell characteristics52,53, can be initially seeded into hEMV lumens (as described in Steps 70–76) prior to seeding with endothelial cells (Fig. 11a). These cells adhere to the channel, and during culture partially invade the collagen matrix around the endothelial monolayer15. Importantly, the abluminal presence of hBMSCs alone is sufficient to stimulate barrier function in hEMVs (Fig. 11b). Similarly, we show that human platelets isolated from whole blood can be perfused within hEMVs. By simulating reduced vascular perfusion through the preconditioning of hEMVs to conditions of low flow (0 dyne/cm2), we observe increased platelet aggregation and thrombosis in comparison to hEMVs conditioned to physiologic shear stresses (5 dyne/cm2) (Fig. 11c, d) and that these thrombotic events occur at sites of adherens junction disruption where platelets contact the underlying interstitial matrix (Fig. 11e). These experiments highlight the modular potential of hEMVs and the ability to increase the model complexity by introducing additional cell types that regulate vascular function. The incorporation of tissue-specific mural cells, stromal cells laden within the interstitium, or additional circulating cell types such as immune, hematopoietic, or tumor cells, will continue to expand the application of hEMVs to complement in vivo studies.
Figure 11.

Applications of the hEMV platform. a. hEMVs cultured with and without the abluminal presence of human bone marrow stromal cells (hBMSCs, cyan, indicated by red arrows), immunostained for VE-cadherin (green), nuclei (blue), and collagen I (magenta). Scale bar 50 μm. b. Quantification of diffusive permeability of vessels with and without hBMSCs using 70 and 10 kDa fluorescent dextrans (values plotted are Pd [cm/s] x 106, and thus 18 on the y-axis indicates Pd = 18 × 10−6 cm/s, n > 3 for 3 independent experiments, mean ± SEM, *p < 0.05 as determined by the Student’s t-test). c. Platelet aggregation (white) in hEMVs with and without applied shear stress. Scale bar 40 μm. d. Quantification of platelet aggregation counts per field of view in hEMVs with and without applied shear stress (n = 5 devices per condition, mean ± SEM, **p<0.01 vs. 0 dyne/cm2 as determined by Student’s t-test). e. Localization of platelet aggregation and activation to sites of adherens junction disruption (green arrows) under conditions of low/no shear stress in hEMVs. VE-cadherin (white), nuclei (blue), platelets (red). Scale bar 10 μm.
Timing
Microfabrication Timeline (Done infrequently – generally only when a new wafer is required)
| Step # | Process Step | Active Time | Wait Time | |
|---|---|---|---|---|
| Day 1 | 3-10 | Silicon master design and fabrication | 2 hours | 5 hours - overnight |
| Day 2 | 11-16 | 2 hours | 2-3 hours - overnight | |
| Day 3 | 17-20 | 2 hours | 2 hours - overnight | |
| Day 4 | 21-23 | 1 hour | 1 hour | |
| 24-35 | Fabrication of PDMS master negative mold | 10 min | 3 hours - overnight | |
| Day 5 | 26-30 | 30 min | 4 hours - overnight | |
| Day 6 | 31 | 10 min | ||
| 32-35 | Create a reusable plastic mold | 30 min | overnight | |
| 36 | 10 min |
Typical Device Timeline (Once molds have been fabricated)
| Step # | Process Step | Active Time | Wait Time | |
|---|---|---|---|---|
| Day 1 | 37 | PDMS molding | 30 min | overnight |
| Day 2 | 38-45 | PDMS device assembly | 1 hour | 15 min |
| 46-47* | Surface treatment of devices | 15 min | 4 hours - overnight | |
| 48-50 | 30 min | overnight | ||
| Day 3 | 51-60 | Preparing collagen gel | 1 hour | 1 hour during, then 4 hours - overnight |
| 61-66 | Removing needles & rinsing gels | 30 min | overnight | |
| Day 4 | 67-69 | Cell preparation | 10 min | |
| 70-76 | Channel seeding | |||
| 77a, i | Gravity-driven oscillatory flow | 5 min | Application dependent, 14-72 hours | |
| 77b, i-v | Syringe-pump driven unidirectional flow | 30 min | overnight | |
| Day 5** | 77a, ii | Gravity-driven oscillatory flow | 10 min | |
| 77b, vi - xv | Syringe-pump driven unidirectional flow | 1.5 hours | overnight | |
| Day 6** | 78-82 | Permeability assay | 5 min per device | |
| 83-91 | Visualization of cellular junctions and cytoskeleton via immunofluorescence staining | 1 hour | 1 hour - overnight | |
| Day 7 | 92 | 15 min | overnight | |
| Day 8 | 93 | 30 min | 30 min - overnight | |
| 94 | 15 min | 45 min - overnight | ||
| Day 9 | 95-96 | 30 min |
Do not proceed to this step unless you plan to continue through step 65 in accordance with the timeline
On these days, choose one of the two paths, depending on the experimental design and goals
Supplementary Material
Acknowledgements
This work was supported in part by grants from the National Institutes of Health (EB00262, EB08396, UH3EB017103, and HL115553) and the National Science Foundation Center for Engineering MechanoBiology (CMMI15-48571). W.J.P. acknowledges support from a Ruth L. Kirchstein National Research Service Award (F32 HL129733) and from the NIH through the Organ Design and Engineering Training program (T32 EB16652), M.L.K. acknowledges support from the Hartwell Foundation and from the National Institutes of Health (K99-CA226366-01A1), and J.B.T. acknowledges support from the NIH through the Translational Research in Biomaterials Training Program (T32 EB006359).
Footnotes
Competing Financial Interests The authors declare that they have no competing financial and non-financial interests.
Data Availability The datasets generated during and/or analyzed during the current study are available from the corresponding author on reasonable request.
Code Availability The custom code used for the current study is provided in the supplementary material.
References
- 1.Ayata C & Ropper AH Ischaemic brain oedema. J. Clin. Neurosci 9, 113–124 (2002). [DOI] [PubMed] [Google Scholar]
- 2.Dongaonkar RM, Stewart RH, Geissler HJ & Laine GA Myocardial microvascular permeability, interstitial oedema, and compromised cardiac function. Cardiovasc. Res 87, 331–339 (2010). [DOI] [PMC free article] [PubMed] [Google Scholar]
- 3.Hahn C & Schwartz M. a. Mechanotransduction in vascular physiology and atherogenesis. Nat. Rev. Mol. Cell Biol 10, 53–62 (2009). [DOI] [PMC free article] [PubMed] [Google Scholar]
- 4.Heron M National Vital Statistics Reports Deaths: leading causes for 2013. Natl. vital Stat. reports from Centers Dis. Control Prev. Natl. Cent. Heal. Stat. Natl. Vital Stat. Syst 65, 1–95 (2016). [PubMed] [Google Scholar]
- 5.Chauhan VP, Stylianopoulos T, Boucher Y & Jain RK Delivery of Molecular and Nanoscale Medicine to Tumors: Transport Barriers and Strategies. Annu. Rev. Chem. Biomol. Eng 2, 281–298 (2011). [DOI] [PubMed] [Google Scholar]
- 6.Mehta D & Malik AB Signaling Mechanisms Regulating Endothelial Permeability. 279–367 (2006). doi: 10.1152/physrev.00012.2005. [DOI] [PubMed] [Google Scholar]
- 7.Tarbell JM Mass Transport in Arteries and the Localization of Atherosclerosis. Annu. Rev. Biomed. Eng 5, 79–118 (2003). [DOI] [PubMed] [Google Scholar]
- 8.DePaola N et al. Electrical impedance of cultured endothelium under fluid flow. Ann. Biomed. Eng 29, 648–656 (2001). [DOI] [PubMed] [Google Scholar]
- 9.Tarbell JM Shear stress and the endothelial transport barrier. Cardiovasc. Res 87, 320–30 (2010). [DOI] [PMC free article] [PubMed] [Google Scholar]
- 10.Caplan BBA, Gerrity RG & Schwartz CCJ EC morphology in focal areas of in vivo evans blue uptake in young pig aorta. Exp. Mol. Pathol 21, 102–117 (1974). [DOI] [PubMed] [Google Scholar]
- 11.Bergers G The role of pericytes in blood-vessel formation and maintenance. Neuro. Oncol 7, 452–464 (2005). [DOI] [PMC free article] [PubMed] [Google Scholar]
- 12.Wong KHK, Chan JM, Kamm RD & Tien J Microfluidic Models of Vascular Functions. Annu. Rev. Biomed. Eng 14, 205–230 (2012). [DOI] [PubMed] [Google Scholar]
- 13.Huber D, Oskooei A, Casadevall Solvas X, Andrew Demello & Kaigala GV Hydrodynamics in Cell Studies. Chem. Rev 118, 2042–2079 (2018). [DOI] [PMC free article] [PubMed] [Google Scholar]
- 14.Polacheck WJ et al. A non-canonical Notch complex regulates adherens junctions and vascular barrier function. Nature 552, 258–262 (2017). [DOI] [PMC free article] [PubMed] [Google Scholar]
- 15.Alimperti S et al. Three-dimensional biomimetic vascular model reveals a RhoA, Rac1, and N -cadherin balance in mural cell-endothelial cell-regulated barrier function. Proc. Natl. Acad. Sci 201618333 (2017). doi: 10.1073/pnas.1618333114 [DOI] [PMC free article] [PubMed] [Google Scholar]
- 16.Mccurley A et al. Inhibition of avb5 Integrin Attenuates Vascular Permeability and Protects against Renal Ischemia-Reperfusion Injury. J. Am. Soc. Nephrol 28, 1741–1752 (2017). [DOI] [PMC free article] [PubMed] [Google Scholar]
- 17.Chang B in (eds. Weber BHF & LANGMANN T) 935, 27–39 (Humana Press, 2012). [Google Scholar]
- 18.Meijer EFJ, Baish JW, Padera TP & Fukumura D in 1458, 71–85 (2016). [DOI] [PMC free article] [PubMed] [Google Scholar]
- 19.Gerlowski LE & Jain RK Microvascular permeability of normal and neoplastic tissues. Microvasc. Res 31, 288–305 (1986). [DOI] [PubMed] [Google Scholar]
- 20.Yuan F, Leunig M, Berk DA & Jain RK Microvascular permeability of albumin, vascular surface area, and vascular volume measured in human adenocarcinoma LS174T using dorsal chamber in scid mice. Microvasc. Res 45, 269–289 (1993). [DOI] [PubMed] [Google Scholar]
- 21.Siflinger-Birnboim A et al. Molecular sieving characteristics of the cultured endothelial monolayer. J. Cell. Physiol 132, 111–117 (1987). [DOI] [PubMed] [Google Scholar]
- 22.Chien S Effects of disturbed flow on endothelial cells. Ann. Biomed. Eng 36, 554–62 (2008). [DOI] [PMC free article] [PubMed] [Google Scholar]
- 23.Dewey CF, Bussolari SR, Gimbrone MA & Davies PF The dynamic response of vascular endothelial cells to fluid shear stress. J. Biomech. Eng 103, 177–85 (1981). [DOI] [PubMed] [Google Scholar]
- 24.Bischoff I et al. Pitfalls in assessing microvascular endothelial barrier function: Impedance-based devices versus the classic macromolecular tracer assay. Sci. Rep 6, 1–11 (2016). [DOI] [PMC free article] [PubMed] [Google Scholar]
- 25.Crone C & Olesen SP Electrical resistance of brain microvascular endothelium. Brain Res 241,49–55 (1982). [DOI] [PubMed] [Google Scholar]
- 26.Tiruppathi C, Malik AB, Del Vecchio PJ, Keese CR & Giaever I Electrical method for detection of endothelial cell shape change in real time: assessment of endothelial barrier function. Proc. Natl. Acad. Sci. U. S. A 89, 7919–23 (1992). [DOI] [PMC free article] [PubMed] [Google Scholar]
- 27.Srinivasan B et al. TEER Measurement Techniques for In Vitro Barrier Model Systems. J. Lab. Autom 20, 107–126 (2015). [DOI] [PMC free article] [PubMed] [Google Scholar]
- 28.Griep LM et al. BBB on CHIP: Microfluidic platform to mechanically and biochemically modulate blood-brain barrier function. Biomed. Microdevices 15, 145–150 (2013). [DOI] [PubMed] [Google Scholar]
- 29.Zheng Y et al. In vitro microvessels for the study of angiogenesis and thrombosis. Proc. Natl. Acad. Sci. U. S. A 109, 9342–9347 (2012). [DOI] [PMC free article] [PubMed] [Google Scholar]
- 30.Zervantonakis IK et al. Three-dimensional microfluidic model for tumor cell intravasation and endothelial barrier function. Proc. Natl. Acad. Sci. U. S. A (2012). doi: 10.1073/pnas.1210182109 [DOI] [PMC free article] [PubMed] [Google Scholar]
- 31.Farahat W a et al. Ensemble analysis of angiogenic growth in three-dimensional microfluidic cell cultures. PLoS One 7, e37333 (2012). [DOI] [PMC free article] [PubMed] [Google Scholar]
- 32.Morgan JP et al. Formation of microvascular networks in vitro. Nat. Protoc 8, 1820–1836 (2013). [DOI] [PubMed] [Google Scholar]
- 33.Sobrino A et al. 3D microtumors in vitro supported by perfused vascular networks. Sci. Rep 6, 1–11 (2016). [DOI] [PMC free article] [PubMed] [Google Scholar]
- 34.Kim S, Chung M, Ahn J, Lee S & Jeon NL Interstitial flow regulates the angiogenic response and phenotype of endothelial cells in a 3D culture model. Lab Chip 16, 4189–4199 (2016). [DOI] [PubMed] [Google Scholar]
- 35.Chen MB et al. On-chip human microvasculature assay for visualization and quantification of tumor cell extravasation dynamics. Nat. Protoc 12, 865–880 (2017). [DOI] [PMC free article] [PubMed] [Google Scholar]
- 36.Nguyen D-HT et al. Biomimetic model to reconstitute angiogenic sprouting morphogenesis in vitro. Proc. Natl. Acad. Sci. U. S. A 110, 6712–7 (2013). [DOI] [PMC free article] [PubMed] [Google Scholar]
- 37.Linville RM, Boland NF, Covarrubias G, Price GM & Tien J Physical and Chemical Signals That Promote Vascularization of Capillary-Scale Channels. Cell. Mol. Bioeng 9, 73–84 (2016). [DOI] [PMC free article] [PubMed] [Google Scholar]
- 38.Geraldo S et al. Do cancer cells have distinct adhesions in 3D collagen matrices and in vivo? Eur. J. Cell Biol 91,930–937 (2012). [DOI] [PubMed] [Google Scholar]
- 39.Galie P a et al. Fluid shear stress threshold regulates angiogenic sprouting. Proc. Natl. Acad. Sci. U. S. A 111, 7968–73 (2014). [DOI] [PMC free article] [PubMed] [Google Scholar]
- 40.Capes DF et al. Fluctuations in syringe-pump infusions: association with blood pressure variations in infants. Am. J. Health. Syst. Pharm 52, 1646–53 (1995). [DOI] [PubMed] [Google Scholar]
- 41.Deen WM Analysis of Transport Phenomena. (Oxford University Press, 1998). [Google Scholar]
- 42.Adamson RH, Lenz JF & Curry FE Quantitative laser scanning confocal microscopy on single capillaries: permeability measurement. Microcirculation 1, 251–65 (1994). [DOI] [PubMed] [Google Scholar]
- 43.Dejana E, Orsenigo F & Lampugnani MG The role of adherens junctions and VE-cadherin in the control of vascular permeability. J. Cell Sci 121, 2115–2122 (2008). [DOI] [PubMed] [Google Scholar]
- 44.Sung KE et al. Control of 3-dimensional collagen matrix polymerization for reproducible human mammary fibroblast cell culture in microfluidic devices. Biomaterials 30, 4833–4841 (2009). [DOI] [PMC free article] [PubMed] [Google Scholar]
- 45.Cines DB et al. Endothelial cells in physiology and in the pathophysiology of vascular disorders. Blood 91, 3527–61 (1998). [PubMed] [Google Scholar]
- 46.Song JW & Munn LL Fluid forces control endothelial sprouting. Proc. Natl. Acad. Sci. U. S. A 108, 15342–15347 (2011). [DOI] [PMC free article] [PubMed] [Google Scholar]
- 47.Polacheck WJ, German AE, Mammoto A, Ingber DE & Kamm RD Mechanotransduction of fluid stress guides 3D cell migration. Proc Natl Acad Sci U S A [accepted, (2014). [DOI] [PMC free article] [PubMed] [Google Scholar]
- 48.Trappmann B et al. Matrix degradability controls multicellularity of 3D cell migration. Nat. Commun 8, 1–8 (2017). [DOI] [PMC free article] [PubMed] [Google Scholar]
- 49.Funamoto K et al. A novel microfluidic platform for high-resolution imaging of a three-dimensional cell culture under a controlled hypoxic environment. Lab Chip 1, (2012). [DOI] [PMC free article] [PubMed] [Google Scholar]
- 50.Armulik A et al. Pericytes regulate the blood-brain barrier. Nature 468, 557–561 (2010). [DOI] [PubMed] [Google Scholar]
- 51.Daneman R, Zhou L, Kebede AA & Barres BA Pericytes are required for blood-brain barrier integrity during embryogenesis. Nature 468, 562 (2010). [DOI] [PMC free article] [PubMed] [Google Scholar]
- 52.Bautch VL Stem cells and the vasculature. Nat. Med 17, 1437 (2011). [DOI] [PubMed] [Google Scholar]
- 53.Au P, Tam J, Fukumura D, Jain RK & Dc W Bone marrow – derived mesenchymal stem cells facilitate engineering of long-lasting functional vasculature Bone marrow – derived mesenchymal stem cells facilitate engineering of long-lasting functional vasculature. 111,4551–4558 (2013). [DOI] [PMC free article] [PubMed] [Google Scholar]
Associated Data
This section collects any data citations, data availability statements, or supplementary materials included in this article.