

Increase in blood–brain barrier (BBB) permeability is a crucial step in neuroinflammatory processes. We previously showed that N Methyl D Aspartate Receptor (NMDARs), expressed on cerebral endothelial cells forming the BBB, regulate immune cell infiltration across this barrier in the mouse. Here, we describe the mechanism responsible for the action of NMDARs on BBB permeabilization. We report that mouse CNS endothelial NMDARs display the regulatory GluN3A subunit.
Keywords: blood–brain barrier, endothelial cells, neuroinflammation, NMDA, permeability, signal transduction
Abstract
Increase in blood–brain barrier (BBB) permeability is a crucial step in neuroinflammatory processes. We previously showed that N Methyl D Aspartate Receptor (NMDARs), expressed on cerebral endothelial cells forming the BBB, regulate immune cell infiltration across this barrier in the mouse. Here, we describe the mechanism responsible for the action of NMDARs on BBB permeabilization. We report that mouse CNS endothelial NMDARs display the regulatory GluN3A subunit. This composition confers to NMDARs' unconventional properties: these receptors do not induce Ca2+ influx but rather show nonionotropic properties. In inflammatory conditions, costimulation of human brain endothelial cells by NMDA agonists (NMDA or glycine) and the serine protease tissue plasminogen activator, previously shown to potentiate NMDAR activity, induces metabotropic signaling via the Rho/ROCK pathway. This pathway leads to an increase in permeability via phosphorylation of myosin light chain and subsequent shrinkage of human brain endothelial cells. Together, these data draw a link between NMDARs and the cytoskeleton in brain endothelial cells that regulates BBB permeability in inflammatory conditions.
SIGNIFICANCE STATEMENT The authors describe how NMDARs expressed on endothelial cells regulate blood–brain barrier function via myosin light chain phosphorylation and increase in permeability. They report that these non-neuronal NMDARs display distinct structural, functional, and pharmacological features than their neuronal counterparts.
Introduction
The permeability of the blood–brain barrier (BBB) and the blood–spinal cord barrier (BSCB) is increased in neuroinflammatory diseases, such as multiple sclerosis (MS). Although not necessarily required for infiltration of immune cells into the CNS parenchyma, BBB or BSCB permeabilization can participate in this infiltration, leading to myelin degradation and axonal damage. Limiting the increase in BBB/BSCB permeability could thus provide therapeutic effect in MS and other diseases in which BBB/BSCB dysfunction is involved.
We recently described that Glunomab, a monoclonal antibody directed against N Methyl D Aspartate (NMDAR), provided therapeutic effects in experimental autoimmune encephalomyelitis, a mouse model of MS (Macrez et al., 2016). Glunomab acted by protecting the BSCB and limiting leukocyte infiltration. This effect was due to an action on NMDAR expressed at the luminal surface of brain endothelial cells (EC), in the vicinity of tight junction proteins. However, the molecular mechanisms involved in this effect remain to be characterized.
Glunomab is directed against a protease-regulated site of NMDARs. It was designed to block the potentiation of NMDAR signaling by the serine-protease tissue plasminogen activator (tPA) (Lesept et al., 2016). To define the mechanisms of action of Glunomab, it is thus crucial to understand how tPA action on NMDARs is linked to BBB permeability.
tPA is involved in animal models of MS (East et al., 2005), is increased permeability of the BBB (Lopes Pinheiro et al., 2016), and monocyte infiltration (Reijerkerk et al., 2008, 2010), and its activity in the blood correlates with MS progression (Akenami et al., 1996). Several mechanisms have been proposed to mediate the action of tPA on BBB permeability (Mehra et al., 2016), including its effect on brain endothelial NMDAR (Reijerkerk et al., 2008). It was reported recently that tPA induced the increase in BBB permeability via intracellular pathways involving Rho-kinases (Niego et al., 2017), providing a clue to the mechanism of action of tPA on CNS endothelial cells (ECs). Indeed, Rho-kinases are considered as central mediators of BBB permeability (Hordijk, 2016). Noteworthy, NMDARs are long known to activate Rho-dependent signaling pathway in neurons (Sin et al., 2002), although no study has yet described a similar pathway in brain ECs.
On these bases, we hypothesized that tPA could potentiate NMDAR, which could trigger Rho-dependent pathway, and that this action would lead to an increase in brain endothelial permeability. We discovered that this increase in permeability is a result of brain EC shrinkage mediated by phosphorylation of myosin light chain (MLC).
Materials and Methods
Cell culture.
The cerebral EC line hCMEC/D3 was kindly provided by Dr. P.O. Couraud, and culture was conducted as described previously (Weksler et al., 2013). Cells were grown on collagen-I-coated flasks in Endothelial Growth Medium-2 (EGM-2 Bullet kit, #cc-3202, Lonza Walkersville) supplemented with 5% fetal bovine serum (FBS). The cell cultures were maintained at 37°C temperature and 5% CO2 in humid atmosphere. The medium was renewed every 3 d until the cells reached 90%–100% confluence after which the cells were either passaged or used for experiments. The hCMEC/D3 cells were exposed to 1 ng/ml human Tumor necrosis factor (TNF) (#300-01A, PeproTech) in serum-free media for 18 h before conducting all experimental treatments unless otherwise specified. Experimental treatments were performed with the following molecules: NMDA (Tocris Bioscience), tPA (Actilyse, Boehringer Ingelheim), glycine (Sigma Millipore), Rhosin hydrochloride (#5003, Tocris Bioscience), Y27632 (#688001, Calbiochem), and L-689,560 (#0742, Tocris Bioscience).
Isolation of mouse brain ECs for in vitro cell culture experiments was done as described previously (Liebner et al., 2008). Briefly, meninges-free brains from adult mice were pooled and homogenized using a Dounce homogenizer (0.025 mm clearance, Wheaton). Then, the pellet was digested with collagenase-II (C2–28, Biochrom) in EC buffer (Czupalla et al., 2014) (1:1:1 volume ratio) for 1 h with shaking at 37°C. For myelin removal, samples were resuspended in 25% bovine serum albumin (BSA) and centrifuged at 2000 × g for 20 min at 4°C followed by enzymatic digestion of the pellet with Collagenase/Dispase (#10269638001, Roche Diagnostics) and DNase I (#LS006333, Worthington) in EC buffer for 15 min at 37°C. Finally, cells were resuspended in MCDB-131 complete medium according to previous descriptions (Czupalla et al., 2014) with slight modifications (MCDB-131-based growth medium containing 20% FCS, 2 mm l-glutamine, 1% penicillin-streptomycin, 1% Endothelial Cell Growth Supplement, 5 mm heparin, 1 mm sodium bicarbonate), and seeded on collagen-I (150 μg/cm2, #344236, Corning)-coated plates. After 6 h, puromycin (5 μg/ml, #P9620, Sigma Millipore) was added to the medium during 2 d to select brain ECs. ECs were cultivated with the same medium (unless otherwise specified) on fibronectin-coated surfaces inserts (1/100 dilution, #F1141, Sigma Millipore).
Permeability assay.
For the permeability analysis, hCMEC/D3 cells were cultured on collagen-I-coated 0.4 μm pore filter inserts (Corning Costar Transwell), grown in EGM-2 media, and maintained for 72 h after confluence. After human TNF preincubation (1 ng/ml, 18 h), cells received experimental treatments as indicated in Results. The trans-monolayer permeability of FITC-Dextran (70 kDa, 1 mg/ml in serum-free medium, incubated in the upper compartment of the insert) was assessed by collecting media from the lower compartment of the transwells at different time points. The raw fluorescence unit intensity (RFU) was captured using BIOTEK FLx800 microplate reader, with excitation and emission wavelengths at 485 and 520 nm, respectively. The results obtained for the different treatments were then normalized to the control condition. The permeability index at 1 h for the HCMEC/D3 cells is equal to 0.00693 and was calculated as follows: (RFUwell − RFUblank)/(RFUinsert − RFUblank), with medium as blank.
Impedance measurement.
The xCELLigence system (RTCA S16, ACEA) is a cell-based label-free instrument that measures in real time electrical impedance of monolayer across gold microelectrodes integrated at the bottom of culture E-plates (#00 300 600 890, ACEA). Mouse primary brain ECs were seeded in complete medium at a density of 50,000 cells per well on fibronectin-coated 16-well E-plates. Once the cells reach the plateau, medium was changed to start mouse TNF treatment for 18 h (10 ng/ml, #315-01A, PeproTech) in 5% serum medium. Then, cells were treated with tPA (20 μg/ml, Actilyse), NMDA (100 μm), or tPA buffer containing 5% serum. Impedance measurement was displayed in real time as a cell index (arbitrary unit) given by the xCELLigence RTCA software (ACEA).
Animals and tissue sampling.
Tissue samples were collected from 8-week-old C57BL/6J male mice, weighing 20–30 g, housed in temperature-controlled environment on a 12 h dark/light cycle with ad libitum access to food and water in our local conventional animal facility (CURB, University of Caen Normandie). The guidelines provided by the institutional ethics committee (Comité Normand d'éthique en matière d'expérimentation animale) were strictly followed. The procedures were approved by the French ministry of research and education (Articles R.217-87 to R.214-126, agreement number 02653.02).
C57BL/6J mice were deeply anesthetized and perfused with cold saline-heparin solution. Brain and spinal cord tissues were excised and rinsed once in saline and then incubated at 4°C in increasing sucrose concentrations (w/v, 10%, 20%, and 30% in phosphate buffer saline (PBS) until the tissue sank down). Following this, tissues were cryopreserved in Tissue-Tek OCT compound (Sakura) and stored at −80°C. Then, tissues were cryostat-sliced in 10 μm sections (CM3050, Leica Microsystems) and stored at −80°C until processed.
Immunohistochemistry.
Tissue section samples (i.e., fixation, primary, and secondary antibody incubation) were performed as described in detail previously (Macrez et al., 2016). To analyze NMDAR subunits and tight junction proteins, the spinal cord tissue sample sections were incubated with the following primary antibodies: mouse monoclonal anti-GluN1 (Glunomab, 1:500) (Lesept et al., 2016; Macrez et al., 2016), goat polyclonal anti-GluN2A (#1468, Santa Cruz Biotechnology, 1:200), rabbit polyclonal anti-GluN2B (#9057, Santa Cruz Biotechnology, 1:200), goat polyclonal anti-GluN2C (#1470, Santa Cruz Biotechnology, 1:200), goat polyclonal anti-GluN2D (#31551, Santa Cruz Biotechnology, 1:200), rabbit polyclonal anti-GluN3A (#07-356, Merck Millipore, 1:200), rabbit polyclonal anti-GluN3B (#50474, Santa Cruz Biotechnology, 1:200), rabbit monoclonal anti-claudin-5 (#131259, Abcam, 1:1000), rabbit monoclonal anti-occludin (#167161, Abcam, 1:1000), rabbit polyclonal anti-ZO-1 (zonula occludens -1 #59720, Abcam, 1:1000), rabbit polyclonal anti-VE-Cadherin (vascular endothelial cadherin #33168, Abcam, 1:1000), and goat anti-collagen IV antibody (#1340, Southern Biotechnology, 1:1000). Species-specific secondary antibodies conjugated for FITC, Cy3, or AlexaFluor-647 fluorophores were purchased from Jackson ImmunoResearch Laboratories. Slides were coverslipped with Fluoromount G containing DAPI for nuclei staining (#00-4959-52, Thermo Fisher Scientific).
Immunocytochemistry.
For the F-actin analysis, the hCMEC/D3 cells were cultured on collagen-I-coated Lab-Tek 4-well chamber slides (#177437, Nunc). Following the experimental treatments, cells were fixed with 2% paraformaldehyde (PFA) for 10 min. After three washes with PBS, cells were permeabilized with 0.1% Triton-PBS solution for 10 min at room temperature. After washes, cells were blocked in 1% BSA-PBS solution for 30 min at room temperature. To visualize the actin protein, we used the iFluor488-Phalloidin (#176753 Cytopainter, Abcam), a bicyclic heptapeptide that specifically binds to F-actin protein. Slides were coverslipped with Fluoromount G containing DAPI for nuclei staining.
For NMDAR subunit staining, confluent cells were treated for 18 h with TNF or control medium. Cells were then washed briefly with PBS and directly incubated with the following primary antibodies for 1 h at room temperature: anti GluN1 (Glunomab, 1:50) (Lesept et al., 2016; Macrez et al., 2016), rabbit polyclonal anti-GluN2B (#9057 Santa Cruz Biotechnology, 1:50), and rabbit polyclonal anti-GluN3A (#07-356, Merck Millipore, 1:50). The cells were then washed twice with PBS and fixed for 10 min with 2% PFA. After fixation, samples were incubated with the corresponding secondary antibodies in PBS at room temperature for 1 h and mounted with Fluoromount G containing DAPI.
Imaging and analysis.
Epifluoresence images were acquired by a CMOS camera (ORCA Flash 4-LT; Hamamatsu) coupled to DM6000B microscope (Leica Microsystems). Confocal images were acquired on an SP5 confocal microscope (Leica Microsystems) and captured at 1024 × 1024 high-quality resolution with a z step of 0.45 μm. For image visualization, we used the MetaMorph 5.0 software (Molecular Devices). The image data were analyzed and processed with ImageJ 1.5 software (National Institutes of Health). Further analysis and 3D reconstruction of confocal images were performed with IMARIS software (version 5.5, Bitplane).
Immunoblotting.
hCMEC/D3 cells were lysed in ice-cold TNT buffer (Tris-NaCl-Tween; with protease and phosphatase inhibitors). The total protein concentrations were determined with Thermo Fisher Scientific Pierce BCA Protein Assay. The denatured protein samples were loaded (12–15 μg protein in each well) in precast polyacrylamide gels (4%–15%; Bio-Rad). After electrophoresis, proteins were transferred on the PVDF membrane. Following transfer, membranes were blocked for 1 h in 2% BSA-TTBS solution (0.1% Tween 20 in Tris-buffered saline, pH 7.4). Membranes were washed three times in TTBS buffer and then incubated overnight with the primary antibody at 4°C. Following three washes in TTBS, membranes were incubated with Horseradish peroxidase (HRP)-conjugated secondary antibodies for 90 min at room temperature. After three rinses with TTBS buffer, protein bands were enhanced for detection and analysis by chemiluminescence agent Thermo Fisher Scientific Pierce ECL Plus substrate. Membranes were subsequently stripped for the detection of standard proteins used as loading control or for normalization of phosphorylated proteins. The data were obtained by ImageQuant LAS 4000 (GE Healthcare Life Sciences). The data were analyzed with ImageJ software (National Institutes of Health).
To analyze NMDAR subunits, the following primary antibodies were used: mouse monoclonal anti-GluN1 Glunomab (1:500) (Lesept et al., 2016; Macrez et al., 2016), mouse monoclonal anti-GluN2B (Santa Cruz Biotechnology #365597, 1:200), and rabbit polyclonal anti-GluN3A (#07-356, Merck Millipore, 1:500). To analyze the MLC phosphorylation, rabbit polyclonal Phospho-MLC 2 (#3671, Cell Signaling Technology) and rabbit polyclonal MLC 2 (#3672, Cell Signaling Technology) antibodies were used. GAPDH protein (loading control) was detected by goat polyclonal anti GAPDH (glyceraldehyde-3-phosphate dehydrogenase; #25778, Santa Cruz Biotechnology).
For the RhoA-GTP activation, we used the Rho Activation Assay Kit (#17-294, Sigma Millipore) according to the manufacturer's recommendations. All steps were performed at 4°C with ice-cold solutions until the denaturation step. Briefly, the culture media was removed, and cells were rinsed twice with ice-cold TBS. Cells were detached and lysed with a cell scraper in ice-cold MLB with protease inhibitor. The samples were vortexed briefly and centrifuged at 14,000 × g for 20 min at 4°C. The supernatant was collected and stored at −80°C. For the RhoA pulldown assay, 500 μl of supernatant was mixed with 15 μl RhoA assay reagent and incubated for 45 min with gentle agitation at 4°C. The agarose beads were pelleted by a brief centrifugation at 14,000 × g, washed three times in MLB, and resuspended in 2× loading reducing buffer and boiled for 5 min at 95°C. The immunoblotting assay was performed as described previously.
Statistical analysis.
The colocalization statistics have been described using Pearson's coefficient (r). The value for this coefficient ranges from −1 to 1, exhibiting total negative correlation and positive correlation, respectively, and 0 for no correlation. Mander's coefficients M1 and M2 were also used as determinants of summed up intensities of pixels of one channel for which the intensities of the other channel are >0, and vice versa.
The graphs represent mean ± SEM. Determination of significance was performed via Mann–Whitney U test. For in vitro experiments, the N value corresponds to the number of independent experiments performed from cells at different passages.
Results
Tight junction-associated spinal cord endothelial NMDARs contain GluN1, GluN2B, and GluN3A subunits
Our first step was to further characterize the expression of NMDARs in CNS ECs, originally described in our previous work (Macrez et al., 2016). We confirmed the presence of the GluN1 subunit of NMDAR in collagen IV-positive vessels in the mouse spinal cord (Fig. 1). GluN1 was localized in cells that form tight junctions, at the vicinity of the transmembrane tight junction proteins occludin and claudin-5, as shown by immunohistochemistry (Fig. 1), 3D reconstruction (Fig. 1), calculation of Pearson's coefficient (0.684 and 0.806, respectively) and Mander's coefficient (M1 = 0.659 and 0.693; M2 = 0.865 and 0.941, respectively). In contrast, GluN1 was poorly colocalized with the intracellular, tight junction scaffolding protein ZO-1 or the adherens junction protein VE-cadherin, although expressed in the same vessels (Fig. 1; Table 1). We next addressed the question of the regulatory subunits of NMDAR expressed in spinal cord ECs along with the GluN1 subunit. GluN1 was colocalized with the regulatory subunit Glun2B, as shown by immunohistochemistry (Fig. 2A) and 3D reconstruction (Fig. 2B). In contrast, GluN2A, GluN2C, and GluN2D were not detected in vessels of the spinal cord (Fig. 2C). Nevertheless, spinal cord endothelial NMDARs were characterized by the presence of the GluN3A subunit (Fig. 2A,B). GluN3B, however, was not detected in vessels of the spinal cord (Fig. 2C). Colocalization of GluN1 with GluN2B and GluN3A was confirmed by calculation of Pearson's coefficient (0.618 and 0.832, respectively) and Mander's coefficient (M1 = 0.949 and 0.991; M2 = 0.981 and 0.765, respectively).
Figure 1.
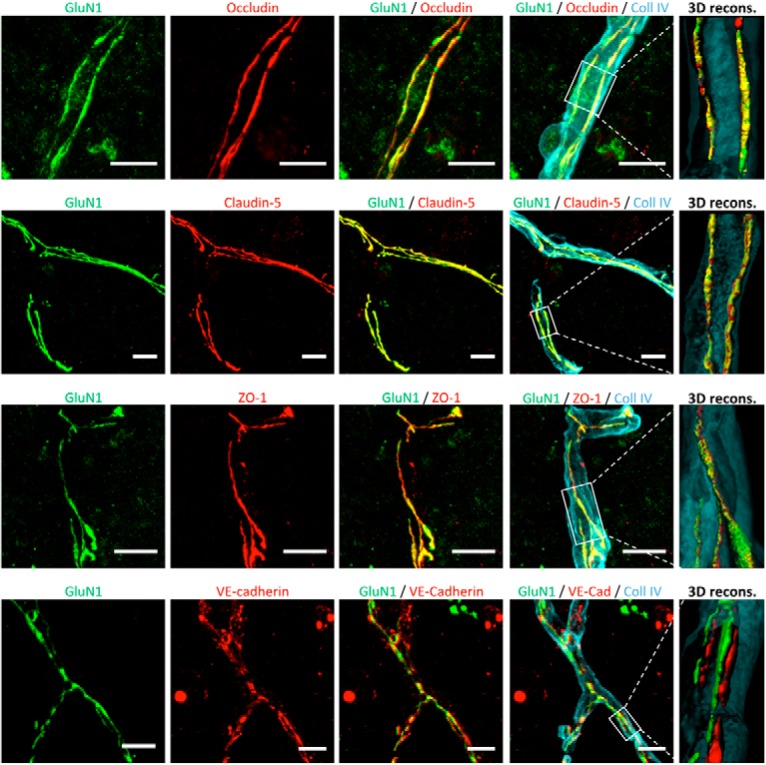
CNS endothelial NMDARs are expressed at the vicinity of tight junction proteins. Confocal photomicrographs represent coimmunostaining for the GluN1 subunit (anti-N-terminal domain; green) and junctional proteins (red) in blood vessels (collagen IV [Coll IV] immunostaining; blue) on ECs of the mouse spinal cord. Right, Corresponding 3D reconstructions. Scale bar, 20 μm.
Figure 2.
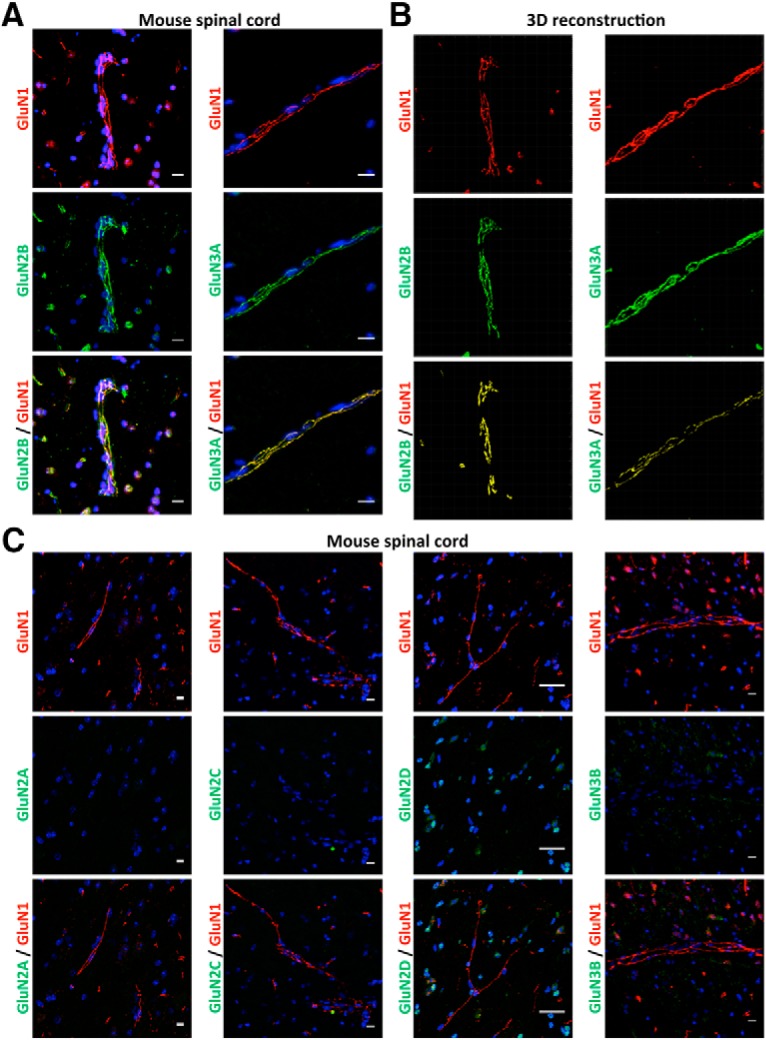
CNS endothelial NMDARs display the regulatory GluN2B and GluN3A subunits. Confocal photomicrographs represent coimmunostaining for the GluN1 subunit (anti-N-terminal domain; red) with the following regulatory NMDAR subunit (green): (A) Glun2B, GluN3A (corresponding 3D reconstruction in B), (C) GluN2A, GluN2C, GluN2D, and GluN3B in ECs of the mouse spinal cord. Yellow represents colocalizations. Scale bar, 10 μm.
NMDAR activation by tPA/NMDA costimulation leads to the recruitment of a metabotropic pathway in CNS ECs involving Rho GTPase activation
Our previous studies have shown that, in conditions of inflammation, CNS endothelial NMDARs drive an increase in brain endothelial permeability and leukocyte transmigration that is potentiated by the action of tPA (Reijerkerk et al., 2010; Macrez et al., 2016). Our next experiments were designed to decipher the signaling pathway leading to this effect. For that, we used the brain EC line hCMEC/D3 in which inflammation was induced by a pretreatment with human recombinant TNF (see Materials and Methods). hCMEC/D3 cells expressed the NMDAR subunits GluN1, GluN2B, and GluN3A (Fig. 3A), and TNF treatment increased the expression of GluN1 and GluN3A (Fig. 3).
Figure 3.

Inflammation-like conditions modulate the expression of NMDAR in hCMEC/D3 cells. A, Photomicrographs of hCMEC/D3 cells represent immunostaining for the NMDAR subunits GluN1, GluN2B, and GluN3A in control conditions or after TNF treatment (1 ng/ml). Scale bar, 20 μm. B, Corresponding quantification. Histograms represent mean ± SEM immunofluorescence. ****p < 0.0001. C, Immunoblotting against GluN1, GluN2B, and GluN3A of proteins extracted from hCMEC/D3 cells in control conditions or after TNF treatment and corresponding quantification. Histograms represent mean ± SEM (n = 3). *p < 0.05. **p < 0.01.
Our first hypothesis was that, as previously observed in neurons (Nicole et al., 2001), NMDAR activation in hCMEC/D3 cells would lead to calcium influx, an action that may be potentiated by tPA. Nevertheless, no modification of intracellular calcium concentration was observed in hCMEC/D3, even at high doses of glutamate, NMDA, or the coagonist glycine, in the presence or absence of tPA (data not shown). These results prompted us to hypothesize that NMDAR signaling in brain ECs could imply a metabotropic rather than an ionotropic pathway. The Rho kinase pathway appeared as a good candidate on the one hand because it was shown previously to be recruited by NMDAR activation in neurons (Semenova et al., 2007; Krogh et al., 2015) and on the other hand because it was previously involved in the regulation of brain endothelial permeability (Niego et al., 2017). The treatment of hCMEC/D3 cells with NMDA alone (50–1000 μm; Fig. 4A) or tPA alone (20–40 μg/ml; Fig. 4B) did not modify RhoA activation either at 1 h (Fig. 4A,B) or 3 h (Fig. 4C,D). Nevertheless, the combination of NMDA and tPA increased RhoA activation after 1 and 3 h of treatment (Fig. 5A,B). This effect was accompanied by cell shrinkage, as shown by an increase in the staining-free area after F-actin staining and 3D reconstruction, reflecting the appearance of gaps between cells (Fig. 5C; 3D reconstruction, Fig. 5D and corresponding quantification, Fig. 5E). Cotreatment with tPA and NMDA also increased the brain endothelial permeability, as reflected by the increase of FITC-dextran extravasation across a monolayer of hCMEC/D3 cells (Fig. 5F) and the decrease in transendothelial electric resistance in primary cultures of ECs (Fig. 5G). Cotreatment with tPA and NMDA induced a gradual increase in permeability in hCMEC/D3 cells (Fig. 5F,H). The addition of Rhosin blocked this increase, so that permeability stayed mostly stable over time (Fig. 5H), resulting in a statistically significant reduction of permeability after 6 h. These data indicate that the combined action of tPA and NMDA on brain ECs led to the recruitment of the RhoGTPase pathway.
Figure 4.

Effect of independent NMDA and tPA treatments on RhoA activation in hCMEC/D3 cells. Immunoblotting against RhoA GTP and GAPDH of proteins extracted from hCMEC/D3 cells in control conditions or after treatment during (A,B) 1 h or (C,D) 3 h with increasing doses of (A,C) NMDA (50–1000 μm) or (B,D) tPA (20–40 μg/ml) and corresponding quantifications. Histograms represent mean ± SEM (n = 4).
Figure 5.

NMDA/tPA cotreatment activates RhoA in hCMEC/D3 cells. A, B, Immunoblotting against RhoA-GTP and GAPDH of proteins extracted from hCMEC/D3 cells in control conditions or after cotreatment with tPA (20 μg/ml) and increasing doses of NMDA (50–1000 μm) for (A) 1 h or (B) 3 h. Corresponding quantifications. Histograms represent mean densitometry ± SEM of immunoblot bands (n = 4). *p < 0.05. C, Photomicrographs of hCMEC/D3 cells represent immunostaining for the cytoskeleton protein F-actin (green) and nuclei counterstaining (DAPI) in control conditions or after treatment with NMDA (100 μm) and tPA (20 μg/ml) for 3 h. Scale bar, 50 μm. D, 3D reconstruction of F-actin staining and (E) corresponding quantification. Histograms represent mean ± SEM (n = 4). **p < 0.01. F, Permeability of FITC-dextran across monolayer of hCMEC/D3 cells at indicated times after treatment with NMDA (100 μm), tPA (20 μg/ml), or both (mean ± SEM, n = 4). *p < 0.05, **p < 0.01 compared with control. G, Measure of the transendothelial electric resistance in a primary mouse brain EC culture treated with NMDA (100 μm) and tPA (20 μg/ml) (mean ± SEM, n = 4). **p < 0.01, ****p < 0.0001. H, Permeability of FITC-dextran across monolayer of hCMEC/D3 cells after treatment with NMDA (100 μm) and tPA (20 μg/ml) in the presence or not of Rhosin (30 μm) (mean ± SEM, n = 4). *p < 0.05, **p < 0.01 compared with control. #p < 0.05, Rhosin compared with NMDA + tPA.
We next asked whether this effect of tPA was due to a direct action on NMDARs. To address this, we used Glunomab, a monoclonal antibody designed in our previous work (Macrez et al., 2016), to block, on NMDAR, the binding site of tPA, thus impeding its action (Lesept et al., 2016). Here, Glunomab reversed the rise in RhoA activation (Fig. 6A,B). The gradual increase in permeability induced by the cotreatment with tPA and NMDA was blocked by the addition of Glunomab, so that permeability stayed mostly stable over time (Fig. 6C), resulting in a statistically significant reduction of permeability after 6 h. Together, these data indicate that the combined action of NMDA and tPA on NMDAR induces an increase in brain endothelial permeability via the activation of the Rho A GTP pathway.
Figure 6.

Glunomab blocks the activation of RhoA induced by NMDA/tPA cotreatment. A, B, Immunoblotting against RhoA GTP and GAPDH of proteins extracted from hCMEC/D3 cells in control conditions or after cotreatment with tPA (20 μg/ml) and NMDA (100 μm) in the presence of the monoclonal anti-GluN1 antibody Glunomab (10 μm) for (A) 1 h or (B) 3 h. Corresponding quantifications. Histograms represent mean ± SEM (n = 3). *p < 0.05 compared with control. #p < 0.05, Glunomab compared with NMDA/tPA. C, Permeability of FITC-dextran across monolayer of hCMEC/D3 cells after treatment with NMDA (100 μm) and tPA (20 μg/ml) in addition or not to Glunomab (10 μm) (mean ± SEM, n = 3). *p < 0.05, **p < 0.01, compared with control. #p < 0.05, Glunomab compared with NMDA + tPA. $p < 0.05, $$p < 0.01, isotype control compared with NMDA + tPA + Glunomab.
NMDAR-induced Rho GTPase recruitment also occurs after costimulation with tPA and the coagonist glycine
GluN3-containing NMDARs are sensitive to glycine in addition to glutamate. We thus tested whether the effects observed above with NMDA, an NMDAR agonist at glutamate site, could also appear with glycine. Although glycine (250 μm) did not modify RhoA activation when added alone, it increased RhoA activation when added together with tPA (20 μg/ml) after 1 h (Fig. 7A) and 3 h (Fig. 7B). This action was not modified by the coincubation with the blocker of NMDAR channel, MK801(Dizocilpine; 10 μM), or by the competitive antagonist at glutamate site, AP5 (D(-)-2-Amino-5-phosphonopentanoic acid; 200 μM; Fig. 7C). In contrast, coincubation with CNQX (6-cyano-7-nitroquinoxaline-2,3-dione; 10 μm), described previously to antagonize the glycine site of NMDAR (Piña-Crespo et al., 2010), completely abolished the combined effect of glycine and tPA (Fig. 7C). Cotreatment with AMPA and tPA did not modify Rho phosphorylation (data not shown), which rules out that the reversion by CNQX could be due to an action on AMPARs. Indeed, coincubation with 4-trans-2-carboxy-5,7-dichloro-4-phenylaminocarbonylamino-1,2,3,4-tetrahydroquinoline (L689,560, 10 μm), an antagonist of the glycine site of NMDAR (Jansen and Dannhardt, 2003), completely abolished the combined effect of glycine and tPA (Fig. 7D). This combined effect of glycine and tPA was accompanied by cell shrinkage (Fig. 7E; 3D reconstruction, Fig. 7F and corresponding quantification, Fig. 7G) and an increase in brain endothelial permeability, as measured by FITC-dextran extravasation across the cell monolayer (Fig. 7H). The rise in RhoA activation and the increase in permeability induced by the cotreatment with tPA and glycine were reversed by the inhibitor of Rho kinase pathway, Rhosin (Fig. 7I,J), and by Glunomab (Fig. 7K,L). Together, these data indicate that the combined action of glycine and tPA on NMDAR induces an increase in endothelial permeability via the activation of the RhoA GTP pathway.
Figure 7.

Glycine/tPA cotreatment activates RhoA in hCMEC/D3 cells. A–D, Immunoblotting against RhoA GTP and GAPDH of proteins extracted from hCMEC/D3 cells in control conditions or after cotreatment with glycine (250 μm) and tPA (20 μg/ml) for (A) 1 h or (B–D) 3 h in the presence of (C) the NMDAR antagonists MK801, AP5, and CNQX, or (D) the NMDAR glycine site antagonist (L689, 560). Corresponding quantifications. Histograms represent mean ± SEM (n = 4). *p < 0.05 compared with control. #p < 0.05 compared with glycine/tPA. E, Photomicrographs of hCMEC/D3 cells represent immunostaining for the cytoskeleton protein F-actin (green) and nuclei counterstaining (DAPI) in control conditions or after treatment with glycine (250 μm) and tPA (20 μg/ml) for 3 h. Scale bar, 50 μm. F, 3D reconstruction of F-actin staining and (G) corresponding quantification. Histograms represent mean ± SEM (n = 3). ***p < 0.001. H, Permeability of FITC-dextran across monolayer of hCMEC/D3 cells after treatment with glycine (250 μm) or tPA (20 μg/ml). I, Immunoblotting against RhoA GTP and GAPDH of proteins extracted from hCMEC/D3 cells in control conditions or after cotreatment with Rhosin. J, Permeability of FITC-dextran across monolayer of hCMEC/D3 cells after cotreatment with glycine (250 μm) and tPA (20 μg/ml) with or without Rhosin. K, Immunoblotting against RhoA GTP and GAPDH of proteins extracted from hCMEC/D3 cells in control conditions or after cotreatment with Glunomab. L, Permeability of FITC-dextran across monolayer of hCMEC/D3 cells after cotreatment with glycine (250 μm) and tPA (20 μg/ml) with or without Glunomab. For permeability experiments, histograms represent mean ± SEM (n = 3). *p < 0.05, **p < 0.01 compared with control. #p < 0.05, ##p < 0.01, inhibitor compared with glycine/tPA. $p < 0.05, $$p < 0.01, $$$p < 0.001, $$$$p < 0.0001, Isotype control compared with control.
NMDAR-induced increase in endothelial permeability involves ROCK-mediated phosphorylation of MLC
We next aimed at identifying the downstream effectors of the Rho kinase pathway that are recruited after stimulation of endothelial NMDAR by its ligands in combination with tPA, and that leads to increased permeability. We hypothesized that the phosphorylation of MLC could be a downstream effect of this pathway. In effect, MLC phosphorylation was shown previously to occur as a result of Rho kinase pathway activation (Xie et al., 2012) and to participate in increasing brain endothelial permeability by inducing cell shrinkage (Kuhlmann et al., 2007; Luh et al., 2019). Noteworthy, the cotreatment with NMDA and tPA resulted in increased MLC phosphorylation after 1 and 3 h (Fig. 8A,B), an effect that was reversed by Rhosin (Fig. 8C). This effect was also revered by Y-27632, an inhibitor of the Rho-associated, coiled-coil containing protein kinase (ROCK) (Fig. 8D), a kinase downstream of RhoA and reported previously to induce the phosphorylation of MLC (Xie et al., 2012). Glunomab also reversed the increase in MLC phosphorylation induced by the cotreatment with NMDA and tPA (Fig. 8E). Finally, the increase in brain endothelial permeability induced by tPA/NMDA cotreatment was also reversed by ROCK inhibition (Fig. 8F). MLC phosphorylation was also observed when glycine was added in combination with tPA (Fig. 8G), an effect that was reversed by L689,560 (Fig. 8H), Y-27632 (Fig. 8I), and Glunomab (Fig. 8J). Finally, increase in brain endothelial permeability induced by the combined action of glycine and tPA was abolished when MLC phosphorylation was inhibited by the addition of Y-27632 (Fig. 8K). Together, these data show that the recruitment of the Rho GTPase pathway induced by the costimulation of NMDAR by tPA and its ligands, NMDA and glycine, leads to increase in brain endothelial permeability via ROCK-mediated MLC phosphorylation.
Figure 8.

RhoA-dependent nonionotropic NMDAR signaling induces endothelial permeability via MLC phosphorylation. A–E, Immunoblotting against phosphorylated and total MLC of proteins extracted from hCMEC/D3 cells in control conditions or after cotreatment with NMDA (100 μm) and tPA (20 μg/ml) for (A) 1 or 3 h (B–E) in the presence of (C) Rhosin, (D) the ROCK inhibitor Y27632, or (E) the monoclonal anti-GluN1 antibody Glunomab. Corresponding quantifications. Histograms represent mean ± SEM (n = 4). *p < 0.05, **p < 0.01 compared with control. #p < 0.01 compared with NMDA/tPA. F, Permeability of FITC-dextran across monolayer of hCMEC/D3 cells after cotreatment with NMDA (100 μm) and tPA (20 μg/ml) in addition or not to Y27632 (mean ± SEM, n = 3). *p < 0.05, **p < 0.01 compared with control. #p < 0.05, ##p < 0.01 compared with NMDA/tPA. G–J, Immunoblotting against phosphorylated and total MLC of proteins extracted from hCMEC/D3 cells in control conditions or after cotreatment for 3 h with glycine (100 μm) and tPA (20 μg/ml) in the presence of (G) Rhosin or (H) the glycine antagonist at NMDAR L689,560, (I) the ROCK inhibitor Y27632, or (J) the monoclonal anti-GluN1 antibody Glunomab. Corresponding quantifications. Histograms represent mean ± SEM (n = 4). *p < 0.05, **p < 0.01 compared with control. #p < 0.05, ##p < 0.01 compared with glycine/tPA. K, Permeability of FITC-dextran across monolayer of hCMEC/D3 cells in control conditions or after cotreatment with glycine (100 μm) and tPA (20 μg/ml) in addition or not to Y27632 (mean ± SEM, n = 3). *p < 0.05, **p < 0.01 compared with control. #p < 0.05, ##p < 0.01 compared with glycine + tPA.
Discussion
The present study describes a metabotropic pathway that makes the link between NMDAR activation and increase in brain endothelial permeability. We show that the costimulation by the agonist NMDA or by the coagonist glycine leads to recruitment of the Rho GTPase pathway, inducing ROCK-dependent phosphorylation of MLC and increase in permeability.
Non-neuronal NMDARs are found in a variety of tissues, including the kidney, heart, pancreas, lung, skin, stomach, ovaries, or immune system (Hogan-Cann and Anderson, 2016). Although they have been much less investigated than their neuronal counterparts, they are considered to display distinct structural and functional properties (Hogan-Cann and Anderson, 2016). Here, we describe that brain endothelial NMDARs include the GluN3A subunit in addition to the canonical subunit GluN1 and the regulatory subunit GluN2B. While GluN3A/B expression in neurons peaks at early postnatal stages and declines during adulthood, it seems to be a hallmark of non-neuronal NMDAR-expressing cells in adults. Indeed, glial cells of the CNS astrocytes (Verkhratsky and Chvátal, 2020), microglia (Murugan et al., 2011), and oligodendrocytes (Káradóttir et al., 2005), have been shown to express GluN3 subunits. In addition, various types of ECs, such as pulmonary ECs (Dumas et al., 2018), or barrier-forming epithelial cells, such as mucosal cells of the intestine (Qi et al., 2017), have also been shown to express GluN3 subunits.
Here, we describe that both GluN2B and GluN3A are expressed at the CNS endothelium. GluN1, GluN2B, and GluN3A can assemble in different ways within NMDAR heterotetramers: GluN1/GluN2B, GluN1/GluN3A, and/or GluN1/GluN2B/GluN3A. The presence of the GluN3 subunit in NMDAR influences its sensitivity to agonists: GluN1/GluN2 are operated by glutamate only, GluN1/GluN3 by glycine only, and GluN1/GluN2/GluN3 by glycine and glutamate. The presence of GluN3 subunits also influences the permeance to Ca2+: GluN1/GluN2 and GluN1/GluN2/GluN3 receptors are permeant to Ca2+, whereas GluN1/GluN3 are not. Here, we describe that the activation of the glutamate site or the glycine site of NMDAR drives a Ca2+-independent metabotropic pathway in brain ECs, which is consistent with the presence of the GluN3A subunit.
Normal glycinemia stands ∼250 μm (20 mg/L), which is compatible with the concentrations shown here to activate NMDAR signaling in the presence of tPA. Blood glutamate concentration, however, stands ∼1 μm. Even though this concentration has recently been shown to be slightly increased in MS patients (Al Gawwam and Sharquie, 2017), it is much inferior to the range of concentration shown in the present work to activate NMDAR signaling in the presence of tPA. However, endothelial NMDAR activation is more likely to occur via the local release of glutamate by blood cells at the early stages of transmigration rather than via a global increase in concentration of its ligands in the blood. In accordance with this, neutrophils (Collard et al., 2002), platelets (Tremolizzo et al., 2006), monocytes (Lee et al., 2011), and lymphocytes (Garg et al., 2008) have been shown to release glutamate. However, to our knowledge, glycine secretion by inflammatory cells has not been documented yet and should be addressed in further studies.
We describe here that the stimulation of brain endothelial NMDAR by its ligands glutamate and glycine requires the coactivation by the serine protease tPA. Although tPA concentration in the blood has been shown to be increased in MS patients (Akenami et al., 1996), it stands in the range of ng/ml, which is way beyond the concentrations classically described to potentiate NMDAR action. As stated above for NMDAR ligands, tPA concentration may, however, locally reach efficient concentrations after being released by infiltrating leukocytes or by brain ECs (Mehra et al., 2016). Interestingly, previous studies reported that leukocytes induce the release of tPA by brain ECs (Reijerkerk et al., 2008). Together with the present results, these data suggest that, under inflammatory conditions, adherent leukocytes could release glutamate (and possibly glycine) and induce the release of tPA by brain ECs in an autocrine fashion. The combined action of glutamate and tPA on brain endothelial NMDAR would in turn lead to increase the endothelial permeability by activating the signaling pathway described in the present study.
We propose here that NMDAR, when coactivated by its agonists and tPA, triggers a pathway mediated by Rho GTPase and leading to ROCK-dependent phosphorylation of MLC. MLC phosphorylation has been described previously to participate in increasing endothelial permeability by inducing brain EC shrinkage via cytoskeletal reorganization (Wu et al., 2016). MLC phosphorylation is an important component of endothelial-mesenchymal transition (EndMT) (Lamouille et al., 2014), an essential process during development that can lead to pathologies in adult (Man et al., 2019). Although EndMT has been only scarcely studied in the brain (mainly in the context of glial cancers), it is important to note that several inducers of EndMT are also involved in CNS diseases in which BBB dysfunction plays a key role (Derada Troletti et al., 2016). In line with this, our data suggest that brain endothelial NMDAR activation may trigger “EndMT-like” dysfunction of BBB with potential consequences in pathological conditions, such as MS.
Recent reports have described that endothelial NMDAR can drive vasodilation in response to neuronal activity as part of the neurovascular coupling (Hogan-Cann et al., 2019; Lu et al., 2019). They describe an Nitric oxyde (NO)-dependent pathway recruited downstream of endothelial NMDAR that differs from the present one in several aspects. Nevertheless, these two pathways (NO-mediated and RhoA-mediated) are likely to be complementary. Indeed, they act within different time-frames, modes of action, locations, and contexts: The NO pathway acts rapidly (within seconds) in response to the ionotropic, Ca2+-dependent activation of NMDAR situated at the basolateral membrane (Lu et al., 2019), close to astrocyte endfeet. It mediates a physiological response to neuronal activity (neurovascular coupling). In contrast, the RhoA pathway described here acts more slowly (within hours) in response to the nonionotropic, Ca2+-independent activation of NMDAR situated at the luminal side (Macrez et al., 2016), close to tight junctions. It mediates a pathological response in the context of neuroinflammation (increase in BBB permeability).
Regulated and reversible increase in BBB permeability is important for the physiology of the brain. When this increase escapes from regulatory control, it becomes an important component of neuroinflammation with implication in most neurological diseases, such as MS, Alzheimer's disease, Parkinson's disease, or amyotrophic lateral sclerosis, and in acute CNS injuries, such as stroke, head trauma, or epilepsy (Sweeney et al., 2019). In extreme cases, an increase in BBB permeability can become irreversible and leads to bleeding, as is the case in hemorrhage and brain microbleeds. It is yet unclear whether there is a continuum between increase in BBB permeability and bleeding or whether these two phenomena use distinct pathways. In any case, NMDAR-induced increase in permeability could be equally implied in physiological responses (e.g., leukocyte infiltration in response to brain infection) and in pathological processes (ranging from neuroinflammation to bleeding). In line with this, active immunization against the N-terminal domain of NMDAR is beneficial in animal models of ischemic and hemorrhagic strokes (Macrez et al., 2011; Gaberel et al., 2013). Also, in a previous study using an animal model of MS, we described the therapeutic potential of a monoclonal antibody (Glunomab) that impedes the activation of NMDAR by tPA (Macrez et al., 2016). The present study strongly suggests that the mechanism of action of Glunomab in experimental autoimmune encephalomyelitis occurs by blocking the pathway described here, thus providing protection of the BBB.
Footnotes
This work was supported by the French Foundation for Research on Multiple Sclerosis (ARSEP), Institut de France (NRJ Foundation), and Agence Nationale de la Recherche. A.M. was supported by European Marie Curie Action (International Training Network) Fellowship (within the nEUROinflammation network FP7). H.L. was supported by French Ministry of Research Fellowship. The hCMEC/D3 cell line was kindly donated by Dr. P. O. Couraud (Institute Cochin, Université Paris Descartes, France). We thank Yannick Hommet, Laurent Lebouvier, and Haniaa Segard for excellent technical support.
R.M., D.V., and F.D. are inventors on patent TIE13193 (PCT#WO2014187879) concerning Glunomab antibody in neurological disorders. The remaining authors declare no competing financial interests.
References
- Akenami FO, Sirén V, Koskiniemi M, Siimes MA, Teräväinen H, Vaheri A (1996) Cerebrospinal fluid activity of tissue plasminogen activator in patients with neurological diseases. J Clin Pathol 49:577–580. 10.1136/jcp.49.7.577 [DOI] [PMC free article] [PubMed] [Google Scholar]
- Al Gawwam G, Sharquie IK (2017) Serum glutamate is a predictor for the diagnosis of multiple sclerosis. Sci World J 2017:9320802. 10.1155/2017/9320802 [DOI] [PMC free article] [PubMed] [Google Scholar]
- Collard CD, Park KA, Montalto MC, Alapati S, Buras JA, Stahl GL, Colgan SP (2002) Neutrophil-derived glutamate regulates vascular endothelial barrier function. J Biol Chem 277:14801–14811. 10.1074/jbc.M110557200 [DOI] [PubMed] [Google Scholar]
- Czupalla CJ, Liebner S, Devraj K (2014) In vitro models of the blood-brain barrier. Methods Mol Biol 1135:415–437. [DOI] [PubMed] [Google Scholar]
- Derada Troletti C, de Goede P, Kamermans A, de Vries HE (2016) Molecular alterations of the blood–brain barrier under inflammatory conditions: the role of endothelial to mesenchymal transition. Biochim Biophys Acta 1862:452–460. 10.1016/j.bbadis.2015.10.010 [DOI] [PubMed] [Google Scholar]
- Dumas SJ, Bru-Mercier G, Courboulin A, Quatredeniers M, Rücker-Martin C, Antigny F, Nakhleh MK, Ranchoux B, Gouadon E, Vinhas MC, Vocelle M, Raymond N, Dorfmüller P, Fadel E, Perros F, Humbert M, Cohen-Kaminsky S (2018) NMDA-type glutamate receptor activation promotes vascular remodeling and pulmonary arterial hypertension. Circulation 137:2371–2389. 10.1161/CIRCULATIONAHA.117.029930 [DOI] [PubMed] [Google Scholar]
- East E, Baker D, Pryce G, Lijnen HR, Cuzner ML, Gverić D (2005) A role for the plasminogen activator system in inflammation and neurodegeneration in the central nervous system during experimental allergic encephalomyelitis. Am J Pathol 167:545–554. 10.1016/S0002-9440(10)62996-3 [DOI] [PMC free article] [PubMed] [Google Scholar]
- Gaberel T, Macrez R, Gauberti M, Montagne A, Hebert M, Petersen KU, Touze E, Agin V, Emery E, Ali C, Vivien D (2013) Immunotherapy blocking the tissue plasminogen activator-dependent activation of N-methyl-D-aspartate glutamate receptors improves hemorrhagic stroke outcome. Neuropharmacology 67:267–271. 10.1016/j.neuropharm.2012.11.023 [DOI] [PubMed] [Google Scholar]
- Garg SK, Banerjee R, Kipnis J (2008) Neuroprotective immunity: T cell-derived glutamate endows astrocytes with a neuroprotective phenotype. J Immunol 180:3866–3873. 10.4049/jimmunol.180.6.3866 [DOI] [PubMed] [Google Scholar]
- Hogan-Cann AD, Anderson CM (2016) Physiological roles of non-neuronal NMDA receptors. Trends Pharmacol Sci 37:750–767. 10.1016/j.tips.2016.05.012 [DOI] [PubMed] [Google Scholar]
- Hogan-Cann AD, Lu P, Anderson CM (2019) Endothelial NMDA receptors mediate activity-dependent brain hemodynamic responses in mice. Proc Natl Acad Sci U S A 116:10229–10231. 10.1073/pnas.1902647116 [DOI] [PMC free article] [PubMed] [Google Scholar]
- Hordijk PL. (2016) Recent insights into endothelial control of leukocyte extravasation. Cell Mol Life Sci 73:1591–1608. 10.1007/s00018-016-2136-y [DOI] [PMC free article] [PubMed] [Google Scholar]
- Jansen M, Dannhardt G (2003) Antagonists and agonists at the glycine site of the NMDA receptor for therapeutic interventions. Eur J Med Chem 38:661–670. 10.1016/S0223-5234(03)00113-2 [DOI] [PubMed] [Google Scholar]
- Káradóttir R, Cavelier P, Bergersen LH, Attwell D (2005) NMDA receptors are expressed in oligodendrocytes and activated in ischaemia. Nature 438:1162–1166. 10.1038/nature04302 [DOI] [PMC free article] [PubMed] [Google Scholar]
- Krogh KA, Lyddon E, Thayer SA (2015) HIV-1 Tat activates a RhoA signaling pathway to reduce NMDA-evoked calcium responses in hippocampal neurons via an actin-dependent mechanism. J Neurochem 132:354–366. 10.1111/jnc.12936 [DOI] [PMC free article] [PubMed] [Google Scholar]
- Kuhlmann CR, Tamaki R, Gamerdinger M, Lessmann V, Behl C, Kempski OS, Luhmann HJ (2007) Inhibition of the myosin light chain kinase prevents hypoxia-induced blood–brain barrier disruption. J Neurochem 102:501–507. 10.1111/j.1471-4159.2007.04506.x [DOI] [PubMed] [Google Scholar]
- Lamouille S, Xu J, Derynck R (2014) Molecular mechanisms of epithelial-mesenchymal transition. Nat Rev Mol Cell Biol 15:178–196. 10.1038/nrm3758 [DOI] [PMC free article] [PubMed] [Google Scholar]
- Lee M, Suk K, Kang Y, McGeer E, McGeer PL (2011) Neurotoxic factors released by stimulated human monocytes and THP-1 cells. Brain Res 1400:99–111. 10.1016/j.brainres.2011.05.021 [DOI] [PubMed] [Google Scholar]
- Lesept F, Chevilley A, Jezequel J, Ladépêche L, Macrez R, Aimable M, Lenoir S, Bertrand T, Rubrecht L, Galea P, Lebouvier L, Petersen KU, Hommet Y, Maubert E, Ali C, Groc L, Vivien D (2016) Tissue-type plasminogen activator controls neuronal death by raising surface dynamics of extrasynaptic NMDA receptors. Cell Death Dis 7:e2466. 10.1038/cddis.2016.279 [DOI] [PMC free article] [PubMed] [Google Scholar]
- Liebner S, Corada M, Bangsow T, Babbage J, Taddei A, Czupalla CJ, Reis M, Felici A, Wolburg H, Fruttiger M, Taketo MM, von Melchner H, Plate KH, Gerhardt H, Dejana E (2008) Wnt/beta-catenin signaling controls development of the blood-brain barrier. J Cell Biol 183:409–417. 10.1083/jcb.200806024 [DOI] [PMC free article] [PubMed] [Google Scholar]
- Lopes Pinheiro MA, Kooij G, Mizee MR, Kamermans A, Enzmann G, Lyck R, Schwaninger M, Engelhardt B, de Vries HE (2016) Immune cell trafficking across the barriers of the central nervous system in multiple sclerosis and stroke. Biochim Biophys Acta 1862:461–471. 10.1016/j.bbadis.2015.10.018 [DOI] [PubMed] [Google Scholar]
- Lu L, Hogan-Cann AD, Globa AK, Lu P, Nagy JI, Bamji SX, Anderson CM (2019) Astrocytes drive cortical vasodilatory signaling by activating endothelial NMDA receptors. J Cereb Blood Flow Metab 39:481–496. 10.1177/0271678X17734100 [DOI] [PMC free article] [PubMed] [Google Scholar]
- Luh C, Feiler S, Frauenknecht K, Meyer S, Lubomirov LT, Neulen A, Thal SC (2019) The contractile apparatus is essential for the integrity of the blood–brain barrier after experimental subarachnoid hemorrhage. Transl Stroke Res 10:534–545. 10.1007/s12975-018-0677-0 [DOI] [PMC free article] [PubMed] [Google Scholar]
- Macrez R, Obiang P, Gauberti M, Roussel B, Baron A, Parcq J, Cassé F, Hommet Y, Orset C, Agin V, Bezin L, Berrocoso TG, Petersen KU, Montaner J, Maubert E, Vivien D, Ali C (2011) Antibodies preventing the interaction of tissue-type plasminogen activator with N-methyl-D-aspartate receptors reduce stroke damages and extend the therapeutic window of thrombolysis. Stroke 42:2315–2322. 10.1161/STROKEAHA.110.606293 [DOI] [PubMed] [Google Scholar]
- Macrez R, Ortega MC, Bardou I, Mehra A, Fournier A, Van der Pol SM, Haelewyn B, Maubert E, Lesept F, Chevilley A, de Castro F, De Vries HE, Vivien D, Clemente D, Docagne F (2016) Neuroendothelial NMDA receptors as therapeutic targets in experimental autoimmune encephalomyelitis. Brain 139:2406–2419. 10.1093/brain/aww172 [DOI] [PubMed] [Google Scholar]
- Man S, Sanchez Duffhues G, Ten Dijke P, Baker D (2019) The therapeutic potential of targeting the endothelial-to-mesenchymal transition. Angiogenesis 22:3–13. 10.1007/s10456-018-9639-0 [DOI] [PMC free article] [PubMed] [Google Scholar]
- Mehra A, Ali C, Parcq J, Vivien D, Docagne F (2016) The plasminogen activation system in neuroinflammation. Biochim Biophys Acta 1862:395–402. 10.1016/j.bbadis.2015.10.011 [DOI] [PubMed] [Google Scholar]
- Murugan M, Sivakumar V, Lu J, Ling EA, Kaur C (2011) Expression of N-methyl D-aspartate receptor subunits in amoeboid microglia mediates production of nitric oxide via NF-κB signaling pathway and oligodendrocyte cell death in hypoxic postnatal rats. Glia 59:521–539. 10.1002/glia.21121 [DOI] [PubMed] [Google Scholar]
- Nicole O, Docagne F, Ali C, Margaill I, Carmeliet P, MacKenzie ET, Vivien D, Buisson A (2001) The proteolytic activity of tissue-plasminogen activator enhances NMDA receptor-mediated signaling. Nat Med 7:59–64. 10.1038/83358 [DOI] [PubMed] [Google Scholar]
- Niego B, Lee N, Larsson P, De Silva TM, Au AE, McCutcheon F, Medcalf RL (2017) Selective inhibition of brain endothelial Rho-kinase-2 provides optimal protection of an in vitro blood–brain barrier from tissue-type plasminogen activator and plasmin. PLoS One 12:e0177332. 10.1371/journal.pone.0177332 [DOI] [PMC free article] [PubMed] [Google Scholar]
- Piña-Crespo JC, Talantova M, Micu I, States B, Chen HS, Tu S, Nakanishi N, Tong G, Zhang D, Heinemann SF, Zamponi GW, Stys PK, Lipton SA (2010) Excitatory glycine responses of CNS myelin mediated by NR1/NR3 “NMDA” receptor subunits. J Neurosci 30:11501–11505. 10.1523/JNEUROSCI.1593-10.2010 [DOI] [PMC free article] [PubMed] [Google Scholar]
- Qi Q, Chen F, Zhang W, Wang P, Li Y, Zuo X (2017) Colonic N-methyl-D-aspartate receptor contributes to visceral hypersensitivity in irritable bowel syndrome. J Gastroenterol Hepatol 32:828–836. 10.1111/jgh.13588 [DOI] [PubMed] [Google Scholar]
- Reijerkerk A, Kooij G, van der Pol SM, Leyen T, van Het Hof B, Couraud PO, Vivien D, Dijkstra CD, de Vries HE (2008) Tissue-type plasminogen activator is a regulator of monocyte diapedesis through the brain endothelial barrier. J Immunol 181:3567–3574. 10.4049/jimmunol.181.5.3567 [DOI] [PubMed] [Google Scholar]
- Reijerkerk A, Kooij G, van der Pol SM, Leyen T, Lakeman K, van Het Hof B, Vivien D, de Vries HE (2010) The NR1 subunit of NMDA receptor regulates monocyte transmigration through the brain endothelial cell barrier. J Neurochem 113:447–453. 10.1111/j.1471-4159.2010.06598.x [DOI] [PubMed] [Google Scholar]
- Semenova MM, Mäki-Hokkonen AM, Cao J, Komarovski V, Forsberg KM, Koistinaho M, Coffey ET, Courtney MJ (2007) Rho mediates calcium-dependent activation of p38alpha and subsequent excitotoxic cell death. Nat Neurosci 10:436–443. 10.1038/nn1869 [DOI] [PubMed] [Google Scholar]
- Sin WC, Haas K, Ruthazer ES, Cline HT (2002) Dendrite growth increased by visual activity requires NMDA receptor and rho GTPases. Nature 419:475–480. 10.1038/nature00987 [DOI] [PubMed] [Google Scholar]
- Sweeney MD, Zhao Z, Montagne A, Nelson AR, Zlokovic BV (2019) Blood–brain barrier: from physiology to disease and back. Physiol Rev 99:21–78. 10.1152/physrev.00050.2017 [DOI] [PMC free article] [PubMed] [Google Scholar]
- Tremolizzo L, DiFrancesco JC, Rodriguez-Menendez V, Sirtori E, Longoni M, Cassetti A, Bossi M, El Mestikawy S, Cavaletti G, Ferrarese C (2006) Human platelets express the synaptic markers VGLUT1 and 2 and release glutamate following aggregation. Neurosci Lett 404:262–265. 10.1016/j.neulet.2006.06.015 [DOI] [PubMed] [Google Scholar]
- Verkhratsky A, Chvátal A (2020) NMDA receptors in astrocytes. Neurochem Res 45:122–133. 10.1007/s11064-019-02750-3 [DOI] [PubMed] [Google Scholar]
- Weksler B, Romero IA, Couraud PO (2013) The hCMEC/D3 cell line as a model of the human blood brain barrier. Fluids Barriers CNS 10:16. 10.1186/2045-8118-10-16 [DOI] [PMC free article] [PubMed] [Google Scholar]
- Wu L, Ramirez SH, Andrews AM, Leung W, Itoh K, Wu J, Arai K, Lo EH, Lok J (2016) Neuregulin1-β decreases interleukin-1β-induced RhoA activation, myosin light chain phosphorylation, and endothelial hyperpermeability. J Neurochem 136:250–257. 10.1111/jnc.13374 [DOI] [PMC free article] [PubMed] [Google Scholar]
- Xie H, Xue YX, Liu LB, Liu YH, Wang P (2012) Role of RhoA/ROCK signaling in endothelial-monocyte-activating polypeptide II opening of the blood-tumor barrier: role of RhoA/ROCK signaling in EMAP II opening of the BTB. J Mol Neurosci 46:666–676. 10.1007/s12031-011-9564-9 [DOI] [PubMed] [Google Scholar]