. 2020 Feb 14;9:e52289. doi: 10.7554/eLife.52289

Figure 1. Extracellular field potential recordings along ~3 mm of the dorsal-ventral axis of the MEC in behaving rats reveals a gradual phase shift of theta.

(A) Rats completed laps on a circular track for food rewards delivered at a fixed location marked by the star. (B) Custom electrode arrays with fixed interelectrode spacing (566 μm and 57° orientation relative to horizontal plane) were used to sample the field potential along ~3 mm of the long axis of the MEC. Array depth was controlled by a micro-drive (not shown). (C) Example broadband LFP traces from adjacent electrodes in MEC reveal regular phase shifts. Vertical lines mark the theta peaks from the dorsal-most channel to facilitate visual comparison of phase shifts across channels.

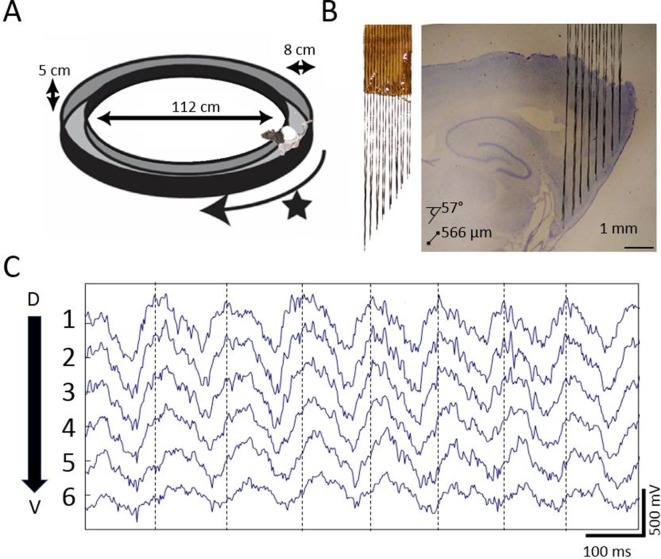
Figure 1.

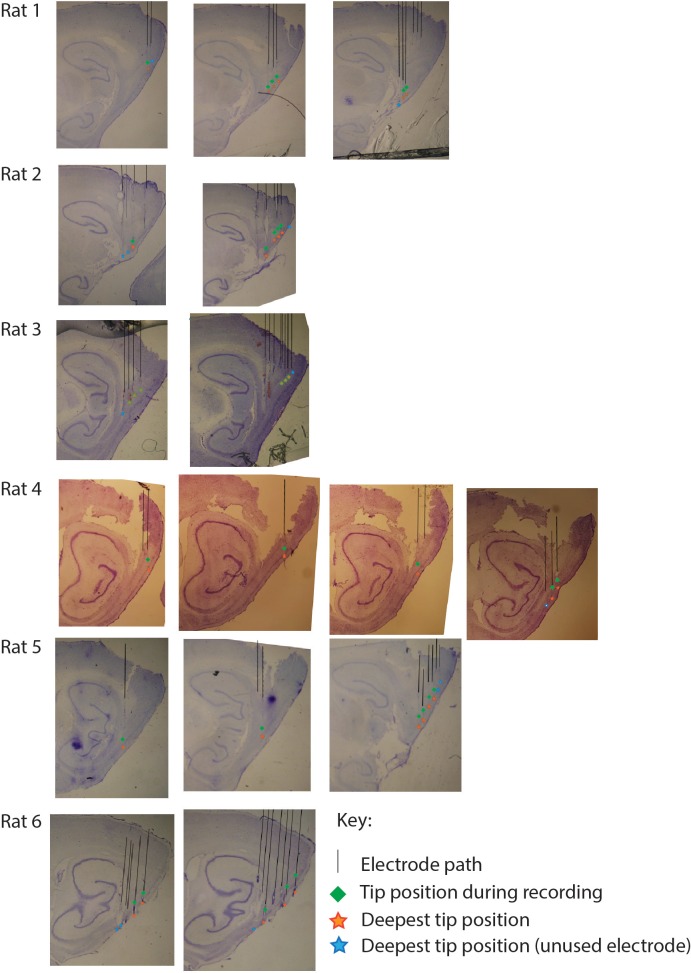
Figure 1—figure supplement 1. Histological micrographs for the six rats implanted for this study, marking estimated electrode placement at the time of sacrifice (orange and blue stars) and inferred positions at the time of the recording analyzed and described in the main text (green squares).

Figure 1—figure supplement 1.

Black lines were added to indicate the inferred electrode track. Stars were added to indicate the inferred final electrode position. Blue reflects electrodes that were found to be outside of the medial entorhinal cortex at the time of the key recording. Orange reflects electrodes that were found to target the medial entorhinal cortex at the time of recording. Note that, in most cases, key recordings upon which analyses were performed are relatively dorsal from the final termination sites shown here, because electrodes were often stepped deeper in an effort to achieve subsequent recordings of unit activity in layer II.