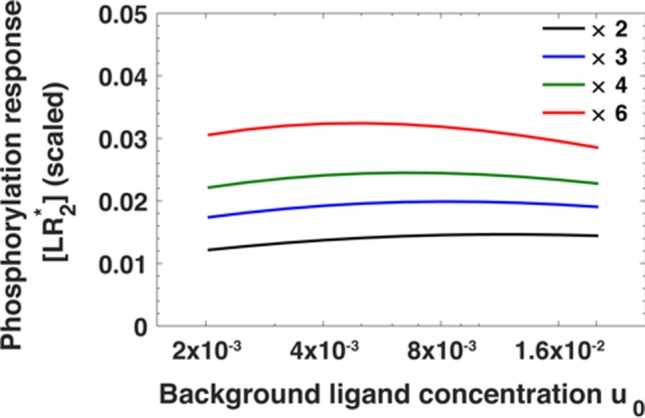
Appendix 1—figure 3. The maximum of the EGFR phosphorylation response [LR*2] as a function of ligand concentration u0 before step change in ligand concentration for fold changes u1/u0 in ligand concentration ranging from u1/u0 = 2 (black) to u1/u0 = 6 (red).

The phosphorylation response is estimated using Equation A30.
