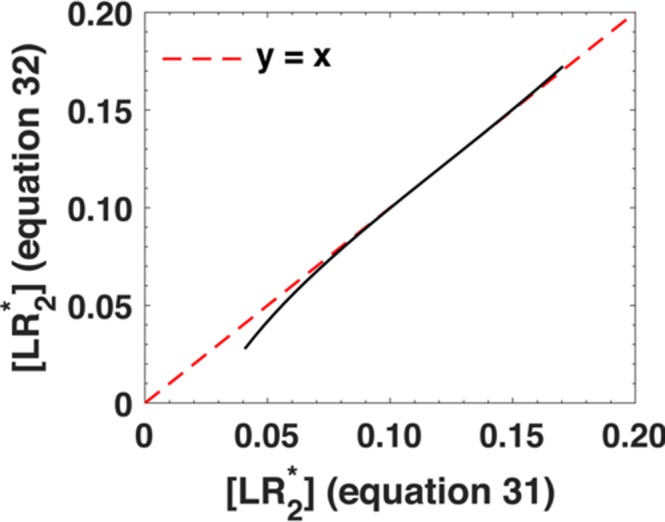
Appendix 1—figure 4. Comparison between the phosphorylation response as predicted by Equation A30 (x-axis) and its approximation, Equation A31 (y-axis).

We varied the ligand concentration u1 between u1 = 10−2-10-0.75. The black dots represent individual data points and the dashed red line represents x = y line.
