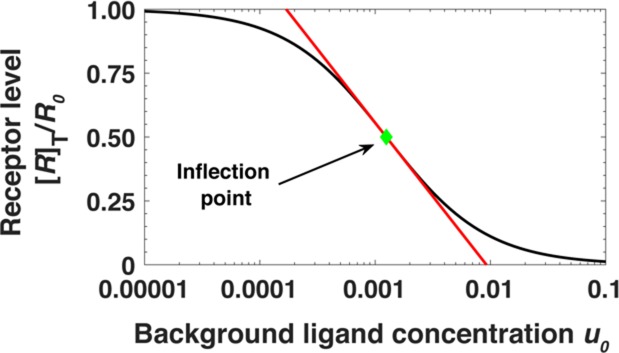
Appendix 1—figure 7. Steady state receptor levels decrease proportional to the logarithm of ligand concentration.
The steady state cell surface receptor level [R]T for monomeric receptors (black line) given by Equation A45 depends approximately on the logarithm of the ligand concentration u0 = [L]0/Kd (red line). The green point represents the inflection point.

