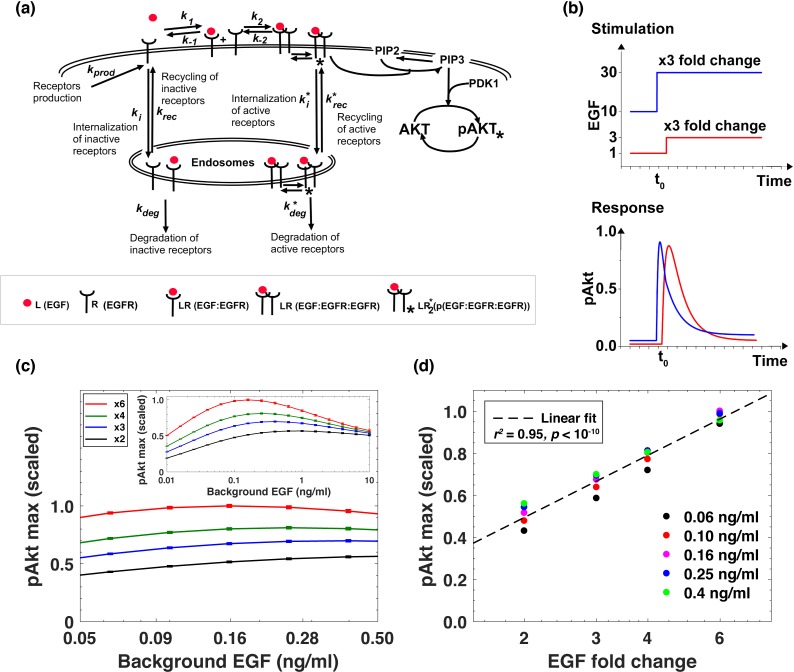
Figure 2. Computational model demonstrates the ability of the system to sense relative changes of EGF levels.
(a) Schematic of the computational model of the EGFR signaling cascade leading to phosphorylation of Akt. Rate constants marked with asterisks correspond to reactions associated with activated (phosphorylated) receptors. Only a subset of reactions in the network are shown for brevity. (b) In silico protocol used to explore relative sensing, showing the temporal profiles of EGF stimulation (top) and the corresponding profiles pAkt response (bottom). Cells were first exposed to various background EGF stimulations (blue and red) and were next subjected to the same abrupt fold change in EGF at time t0. The resulting maximal pAkt responses were similar for the same EGF fold change independent of background EGF stimulation, indicating relative sensing. (c) The maximal pAkt response observed after exposing the ODE model in silico to different background EGF levels (x axis), followed by a 2-, 3-, 4-, or 6- fold increase (different colors) in EGF; inset shows pAkt response over a wider range of background EGF levels. (d) Maximal pAkt responses (y axis) induced by stimulation with different EGF background levels (data points with the same shape and color) were combined and plotted as a function of the EGF fold change (x axis). Dashed line represents log-linear fit to data (Pearson’s r2 = 0.96, regression p value < 10−15). In all subpanels, error bars represent the standard deviation of n = 10 model fits. Source code: https://github.com/dixitpd/FoldChange/.


