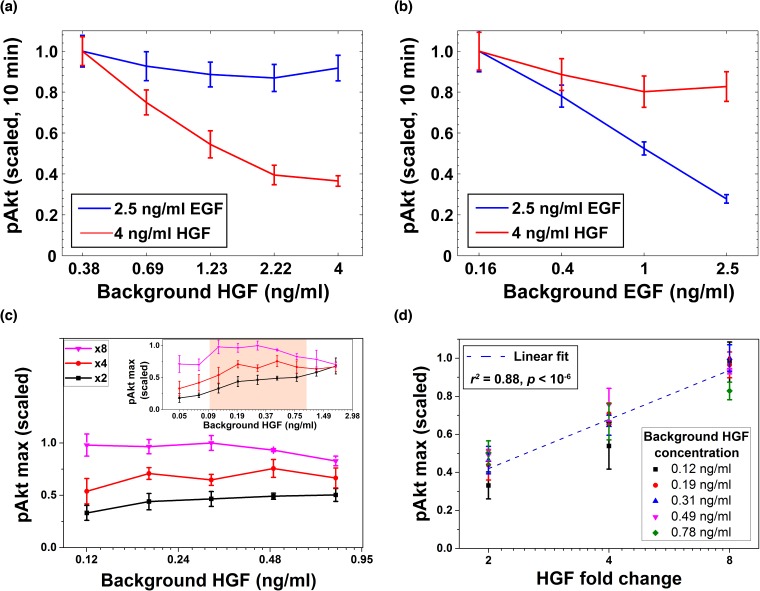
Figure 6. Desensitization and ligand-specific cell memory for EGF- and HGF-induced pAkt responses.
MCF10A cells were first exposed to various background concentrations of either HGF or EGF for three hours, and then abruptly stimulated using either the same or the other growth factor. pAkt levels were then measured 10 min after the addition of the second stimulus. (a) EGF- (blue, 2.5 ng/ml) or HGF- (red, 4 ng/ml) induced pAkt response in cells pre-exposed with various background concentrations of HGF (x axis). (b) EGF- (blue, 2.5 ng/ml) or HGF- (red, 4 ng/ml) induced pAkt response in cells pre-exposed with various background concentrations of EGF (x axis). (c) The maximal pAkt response in MCF10A cells exposed to different background doses of HGF (x axis) for 3 hr, followed by 2-, 4-, and 8-fold increase (different colors) of HGF. Inset shows experimental pAkt response over a wider range of background HGF levels. (d) The maximal pAkt responses (y axis) to HGF fold changes depended approximately logarithmically on the fold change (x axis). Maximal pAkt responses induced by stimulation with various HGF background levels (data points with the same shape and color) were combined and plotted as a function of the HGF fold change (x axis). Dashed line represents log-linear fit to data (Pearson’s r2 = 0.88, regression p value < 10−6). In all subpanels, error bars represent the standard deviation of n = 3 technical replicates. Source data: expt_data.mat (available in Source code 1).


