Abstract
Objective
A considerable number of Canadians are injured or killed every year as a result of residential fires. Until recently, the absence of representative national data limited our understanding of the current situation. This study used a novel dataset to describe the geographic and demographic distribution of residential fires and related casualties across 4 Canadian provinces and to explore changes over time.
Methods
A cross-sectional study design was applied to data from the National Fire Information Database, which reported fire incidents, locations, and associated casualties attended by a fire service across 4 Canadian provinces between 2005 and 2015. Residential fire incident, injury, and death rates were described and compared between sex and age groups. Simple linear regressions were used to assess the trends of casualty rates per population and per fire incidents over time.
Results
A total of 145,252 residential fires were reported for the provinces of British Columbia, Alberta, Manitoba, and Ontario, of which 5.5% resulted in casualties. Death and severe injury rates per population decreased significantly between 2005 and 2015, while casualties per 1000 house fires did not change. Death rates per house fire incidents were generally higher in urban than in remote areas but tended to increase as distance from city centres increased and moved closer to suburban areas. Injury rates were higher than death rates for all age groups and significantly higher for males than for females.
Conclusion
These findings represent an important step forward in identifying the most vulnerable municipalities and populations to inform evidence-based cross-provincial efforts to reduce the societal burden of residential fires.
Keywords: Residential fires, Injury, Death, National Fire Information Database, Geographic information system (GIS), Census subdivisions
Résumé
Objectif
Plusieurs Canadiens sont blessés ou tués chaque année des suites de feux résidentiels. Cette étude utilise de récentes données pour décrire la distribution géographique et démographique des feux résidentiels et des blessures associées, ainsi que leur évolution dans le temps dans quatre provinces canadiennes.
Méthode
Une étude transversale a été utilisée sur la base de données National Fire, rapportant l’incidence, la localisation et les blessures liées aux feux maitrisés par les services d’incendie de 4 provinces canadiennes entre 2005 et 2015. Les taux de feux résidentiels, de blessures et de mortalité ont été décrits et comparés par sexe et groupes d’âge et examinés dans le temps en utilisant des régressions linéaires simples.
Résultats
Un total de 145 252 feux résidentiels ont été rapportés dans les provinces de Colombie-Britannique, Alberta, Manitoba et Ontario, et 5,5 % ont engendré des blessures. Les taux de mortalité et blessures sévères par population ont diminué significativement entre 2005 et 2015, alors que les taux de blessures par 1000 feux résidentiels n’ont pas changé. Les taux de mortalité par incidence de feux étaient généralement plus élevés dans les environnements urbains que ruraux, mais augmentaient en s’éloignant des centres urbains vers les banlieues. Les taux de blessures étaient plus élevés que les taux de mortalité pour tous les groupes d’âge, et significativement plus élevés chez les hommes que chez les femmes.
Conclusion
En identifiant les populations et municipalités les plus vulnérables aux feux résidentiels, cette étude contribue à informer des initiatives interprovinciales basées sur l’évidence pour réduire les conséquences des feux résidentiels.
Mots-clés: Feux résidentiels, Blessure, Décès, Base de données de la National Fire, Système d’information géographique (SIG), Subdivision de recensement
Introduction
Despite important progress in house fire prevention practices and safety standards (Rohde et al. 2016), a considerable number of Canadians are still injured or killed every year as a result of fires (Alberta Emergency Management Agency 2009; BC Coroners Service 2012; Chernichko et al. 1993; The Office of the Fire Marshal and Emergency Management 2017a). Although they account for a small proportion of fire incidents, fires that occur in residential buildings (residential fires) are responsible for the majority of fire-related injuries and deaths. For instance, 30% of fires in Canada in 2007 occurred in residential buildings, yet residential fires accounted for 73% of fire-related deaths that year overall (Wijayasinghe 2011). Given most residential fires and related injuries and deaths are preventable (Warda et al. 1999), the acute and long-lasting consequences of trauma, injury, and death resulting from residential fires place a significant yet avoidable human and financial burden on society. Data that will guide efforts to develop and optimize evidence-based interventions, identify barriers to implementation, and improve targeting of proven prevention strategies are urgently needed.
Advancing our understanding of the problem from a geographic and demographic point of view is an important step towards effective prevention, as it provides policymakers and fire departments with evidence to guide and prioritize public health efforts towards residential fire prevention and safety in specific areas and populations (Pike et al. 2015). Research from the United States (US) has found that rural areas are at increased risk for residential fires and fatalities (Ahrens 2018b; Clare and Kelly 2017), and studies from British Columbia and Alberta have shown similar trends (BC Coroners Service 2012; Chernichko et al. 1993), but a broader multi-provincial picture confirming those results is missing. Additional knowledge is needed about populations at risk of residential fire casualties, notably injuries, as recent provincial and US studies have focused on fatalities only (Ahrens 2018b; Alberta Emergency Management Agency 2009; BC Coroners Service 2012; Chernichko et al. 1993; The Office of the Fire Marshal and Emergency Management 2017a).
Until recently, representative national data on residential fires did not exist in Canada (Canadian Centre for Justice Statistics 2017), limiting our ability to define the current situation. While all provinces and territories gathered fire data, there was significant variation in the types, levels, and accessibility of data collected (Canadian Centre for Justice Statistics 2017). Each jurisdiction had developed their own coding, preventing the analysis of data in a uniform manner across Canada (Wijayasinghe 2011). Notably, previous provincial studies have reported significantly different annual residential fire-related death rates among provinces (Alberta Emergency Management Agency 2009; BC Coroners Service 2012; Chernichko et al. 1993; The Office of the Fire Marshal and Emergency Management 2017a), but the non-standardized coding of data restrained the interpretation and comparisons of these results. In an effort to resolve these difficulties, and make national analyses and provincial comparisons possible, the Canadian Association of Fire Chiefs developed a National Fire Information Database (NFID), offering the opportunity to strengthen knowledge around fires across Canada.
The NFID includes data from seven different jurisdictions across Canada—British Columbia (BC), Alberta (AB), Saskatchewan (SK), Manitoba (MB), Ontario (ON), New Brunswick (NB), and the Canadian Armed Forces. Fire incident and victim information reported by provincial/territorial Fire Marshals and Fire Commissioners Offices over 11 years (2005–2015) are detailed in the database. Social domain data at the census subdivision (CSD) and census metropolitan (CMA)/census agglomeration (CA) levels, provided by the Statistics Canada 2006 Census and 2011 National Household Survey (NHS), are also included in the NFID. The NFID was compiled and first made available to Canadian fire researchers in 2016.
The aim of this study was to describe the geographic and demographic distribution of residential fires and related casualties across Canadian provinces, as well as explore any changes over time using the novel dataset made available by the NFID. The resulting information is intended to assist in providing evidence to inform proper allocation of resources to high-risk populations and areas, ultimately optimizing prevention efforts and decreasing the burden of residential fires in Canada.
Methods
Study design
A cross-sectional study design was applied to data from the NFID, which comprises two different files: the incident file and the victim file. The incident file includes individual fire incidents attended by a fire service within the reporting jurisdiction between 2005 and 2015. The victim file includes single casualties (injuries or deaths) as a result of the fire incident. A single fire incident, therefore, may have multiple injuries and/or deaths. The incident file was merged with the victim file through the common identification (incident ID) variable present in the two data files. Matching was done deterministically and all incident IDs in the victim file matched onto the incident file. While social domain data were available for both residential fire incidents and victims, information such as sex and age for individuals involved in a fire incident but who did not suffer physical consequences from the fire was not included in NFID. Given the secondary use of anonymous information from the NFID, this study was exempted from ethics review by the University of British Columbia/Children’s and Women’s Health Centre of British Columbia Research Ethics Board (UBC C&W REB).
Analytic sample
All residential fires and resulting casualties reported within the NFID were included in the study. Fires that occurred in residential buildings were defined by the “residential” category as classified by the Major Occupancy or the Property Classification variables. Residential buildings included but were not limited to single detached homes, duplexes, semi-detached homes, row/garden/town housing, apartments, tenements, hotels/motels, hostels/boarding houses, dormitories, etc. Three jurisdictions were excluded from the study; data from the Canadian Armed Forces and New Brunswick did not include residential information, and Saskatchewan provided victims data for only 3 years.
Study variables
The following variables were extracted: population of provinces and 2011 CSD (municipalities) where fires occurred, year and month of residential fire events, and victim age and sex. CSDs represent municipalities or areas that are deemed equivalent to municipalities and are identified by Statistics Canada (Statistics Canada 2015). Age was categorized by decades, except for children and youth for which it was divided between toddlers, children and youth: 0–4 years, 5–14 years, 15–19 years, respectively. Injuries were categorized as minor—zero days up to three days of hospitalization—and severe injury—three or more days of hospitalization.
Statistical analysis
Descriptive statistics were calculated as mean and standard deviation for all continuous variables, and as counts and percentages for all categorical variables. Residential fire rates per population and casualty rates per population were calculated by dividing the number of fires or casualties by the population estimates of the specified area according to Statistics Canada. Because municipalities with more house fires are likely to report more fire injuries and deaths, a third rate was calculated—rates of casualties per 1000 residential fire incidents—where house fire casualties were divided by the number of house fire incidents in that municipality and multiplied by 1000, assessing the risk of casualty given a fire. Simple linear regressions, with calendar year as the independent variable, were used to assess the trend of casualty rates per population and per fire incidents over time. Wald’s 95% confidence intervals were computed to compare injury and death rates between males and females. All tests were two-tailed, and statistical significance was set at a p value of 0.05. Data analyses were performed using SAS University Edition. Geocoding was performed using QGIS version 3.4.2 Madeira.
Results
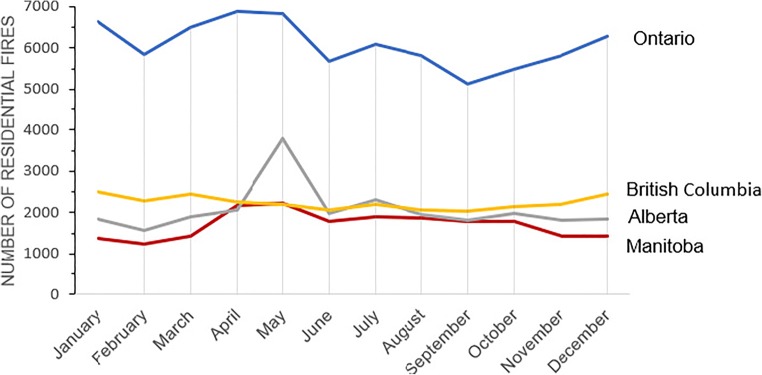
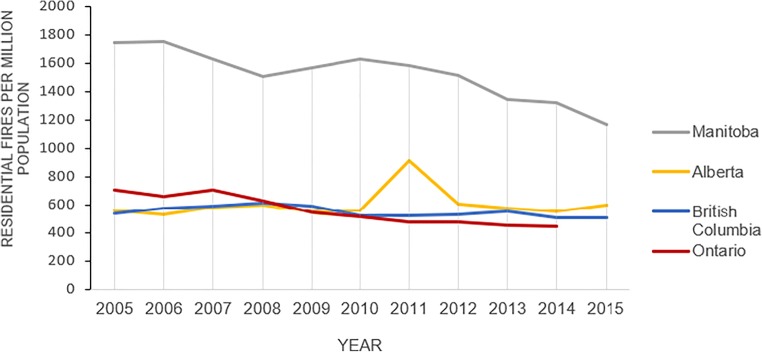
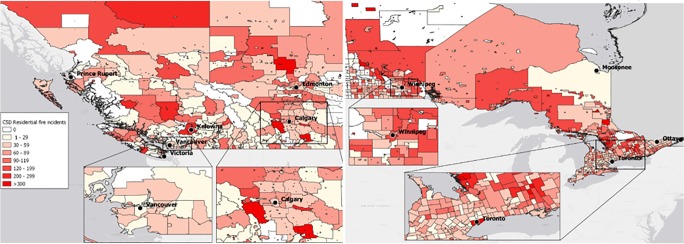
Between 2005 and 2015, 145,252 residential fires were reported for the provinces of British Columbia, Alberta, Manitoba, and Ontario. They were more frequent during April and May, except for British Columbia, where they were slightly higher between November and January (Fig. 1). Residential fire rates varied by province and year (Fig. 2), and by municipality (Fig. 3). Although observing a significant decrease in residential fires over the study period, Manitoba had the highest residential fire rates across the 11 years (an average of 1523.8 per million population), with Winnipeg observing high residential fire rates of 173.4 per 100,000 population per year. There was no specific pattern observed in the geographic distribution of residential fires for the province of Manitoba otherwise. Ontario had the second highest rate of residential fires in 2005 (after Manitoba; 704.9 per million population) but the lowest rates in 2014 (444.6 per million population). Municipality residential fire rates were particularly high in Toronto (> 500 per 100,000 population), lower in suburban areas, and increased in remote areas located north of Toronto and between Toronto and Ottawa. For the provinces of British Columbia and Alberta, municipalities close to the larger cities of Vancouver, Victoria, Calgary, and Edmonton tended to have lower residential fire rates (< 90 per 100,000 population), while rates of > 200 house fires per 100,000 population were all observed in remote areas.
Fig. 1.
Residential fires per month and province between 2005 and 2015, across British Columbia, Alberta, Manitoba, and Ontario
Fig. 2.
Residential fires per million population per year by provinces between 2005 and 2015, across British Columbia, Alberta, Manitoba, and Ontario
Fig. 3.
Residential fire rates per 100,000 population for census subdivisions across British Columbia, Alberta, Manitoba, and Ontario
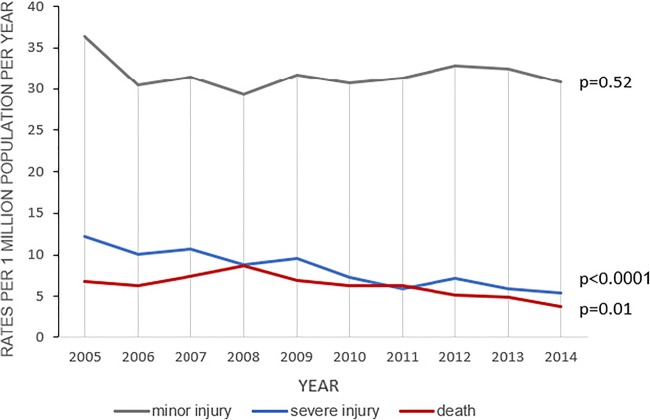
Across the four provinces, 5.5% of residential fires resulted in injuries and deaths. Table 1 presents the severity of injuries among different demographic subgroups. The majority of casualties occurred among males (67.2%) and in Ontario (59.5%). Minor injuries were most common among all subgroups, except for adults ≥ 70 years old and the province of Manitoba, for which deaths were more frequent. The overall annual death rate was 6.4 per million population (British Columbia, 5.4 per million population; Alberta, 6.6 per million population; Manitoba, 12.8 per million population; Ontario, 5.7 per million population). Figure 4 shows that minor injury rates ranged between 29.3 and 36.4 per million population per year and did not change significantly during the study period, while severe injury and death rates decreased significantly (severe injury: Beta = − 0.73, 95% CI − 0.90 to − 0.56, p value < 0.0001; death: Beta = − 0.34, 95% CI − 0.55 to − 0.23, p value = 0.01).
Table 1.
Demographics variables of individuals injured or killed in a residential fire between 2005 and 2015, Canadian provinces of British Columbia, Alberta, Manitoba, and Ontario
| Variables | Total casualties N (%) |
Minor injuries N (%) |
Severe injuries N (%) |
Deaths N (%) |
|---|---|---|---|---|
| Sex | ||||
| Male | 7169 (67.2%) | 4928 (68.7%) | 1296 (18.1%) | 945 (13.2%) |
| Female | 3495 (32.8%) | 2371 (67.8%) | 594 (17.0%) | 530 (15.2%) |
| Age (years) | ||||
| 0–4 | 160 (2.5%) | 91 (56.9%) | 16 (10.0%) | 53 (33.1%) |
| 5–14 | 368 (5.6%) | 245 (66.7%) | 64 (20.4%) | 59 (12.9%) |
| 15–19 | 324 (5.0%) | 216 (66.7%) | 66 (20.4%) | 42 (12.9%) |
| 20–29 | 971 (14.9%) | 645 (66.4%) | 199 (20.5%) | 127 (13.1%) |
| 30–39 | 1055 (16.2%) | 770 (73.0%) | 176 (16.7%) | 109 (10.3%) |
| 40–49 | 1408 (21.5%) | 918 (65.2%) | 241 (17.1%) | 249 (17.7%) |
| 50–59 | 1035 (15.9%) | 627 (60.6%) | 151 (14.6%) | 257 (24.8%) |
| 60–69 | 526 (8.0%) | 248 (47.1%) | 79 (15.0%) | 199 (37.8%) |
| 70–79 | 389 (5.9%) | 158 (40.6%) | 47 (12.1%) | 184 (47.3%) |
| 80+ | 295 (4.5%) | 99 (33.6%) | 32 (10.9%) | 164 (55.6%) |
| Provinces | ||||
| British Columbia | 2216 (20.4%) | 1682 (75.9%) | 216 (9.8%) | 318 (14.3%) |
| Alberta | 1924 (17.8%) | 1441 (74.9%) | 219 (11.4%) | 264 (13.7%) |
| Manitoba | 245 (2.3%) | 47 (19.2%) | 28 (11.4%) | 170 (69.4%) |
| Ontario | 6457 (59.5%) | 4293 (66.5%) | 1441 (22.3.4%) | 723 (11.2%) |
There were 4310 missing data for age and 178 for sex
Fig. 4.
Minor injury, severe injury, and death rates per million population per year with linear trends (p value) between 2005 and 2014, Canadian provinces of British Columbia, Alberta, Manitoba, and Ontario
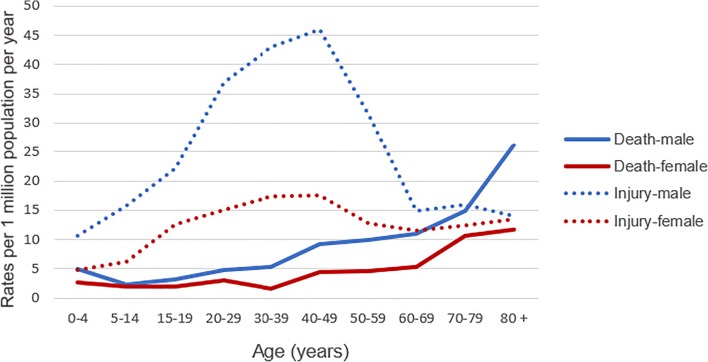
Figure 5 illustrates that death rates were higher for 0–4-year-old (4.3 per million population) than 5–14-year-old children and 15–19-year-old youth (2.0 and 2.8 per million population respectively). Among the adult population, death rates increased progressively with age, except for females aged 30–39, with a notable rise after 70 years of age for males which resulted in higher death rates than injury rates for males aged 80 years and older (26.2 deaths and 14.0 injuries per million population respectively). While death rates did not show a statistically significant difference between males and females for all ages, death rates among males were almost twice the rates of females (9.2 and 4.8 per million population respectively) (Fig. 6). Injury rates were higher than death rates for all age groups except the “80 years and older male” group (Fig. 5), more frequent among male and female adults 40–49 years old (46.0 and 17.5 per million population respectively), and significantly higher for males than for females (Fig. 6).
Fig. 5.
Injury and death rates per million population per year between 2005 and 2014, per age group and sex, Canadian provinces of British Columbia, Alberta, Manitoba, and Ontario
Fig. 6.
Mean death and injury rates per 1 million population, with 95% confidence intervals, between males and females, Canadian provinces of British Columbia, Alberta, Manitoba, and Ontario
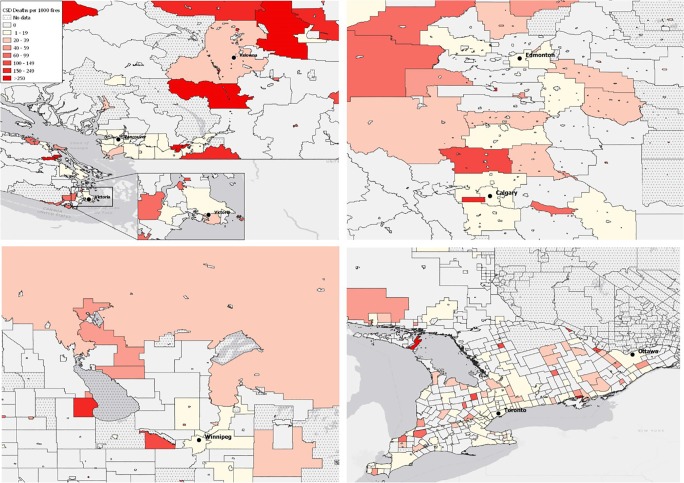
Rates of casualties per 1000 residential fire incidents at the municipal level did not change significantly over time. Injuries and death rates varied from 68.8 to 69.2 and 9.6 to 7.2 per 1000 residential fire incidents, respectively, during the study period (injuries: Beta = 0.88, 95% CI − 0.16 to 1.92, p value = 0.13; deaths: Beta = − 0.23, 95% CI − 0.55 to 0.09, p value = 0.19). Figure 7 presents the distribution of fire deaths per 1000 residential fire incidents across municipalities. For all provinces, most municipalities without residential fire deaths were located away from suburban and metropolitan areas (BC: Victoria, Vancouver, Kelowna; AB: Calgary, Edmonton; MB: Winnipeg; ON: Toronto, Ottawa). The death rates per 1000 residential fire incidents tended to be lower in big cities than in suburban areas.
Fig. 7.
Residential fire death rates per 1000 house fires for census subdivisions across British Columbia, Alberta, Manitoba, and Ontario
Discussion
This is the first study to describe the burden of residential fires and related casualties in a uniform way across 4 provinces in Canada (representing 66% of the Canadian population). The NFID, by capturing detailed multi-provincial fire information collected by Fire Marshals and Fire Commissioners Offices in Canada, and including the full range of injuries and deaths occurring on the fire scene, represents a crucial tool to address the gap in the existing knowledge of the geographic and demographic distribution of residential fires in Canada. By analyzing the information available in the NFID, this study provides academic researchers, policymakers, and Fire Marshals/Commissioners with evidence which may inform the development of prevention programs and public campaigns that will specifically target the needs and context of the most vulnerable populations and areas to effectively decrease the burden of residential fires and casualties in Canada.
Our findings regarding a decreasing trend of residential fires over the years align with those of other countries, including the US and the UK (Ahrens 2018a; Home Office 2018), and likely result from an increase in public fire safety education, a decline in smoking, and changes in home cooking practices (Committee on Injury and Poison Prevention 2000). The overall residential fire rate per population observed in this study is almost half the rate reported in the US (Ahrens 2018b), but seasonal patterns are similar, with a peak of house fire incidents in spring and winter months, which may be due to heating equipment, although additional research is needed to confirm this hypothesis. As in the current study, the literature suggests that rural areas are at increased risk for residential fires given high proportions of old housing, vacant properties, and use of space/gas heaters (Ahrens 2018b; Clare and Kelly 2017). This may explain the high residential fire rates of Manitoba, which has the highest percentage of rural population of the 4 provinces that were compared in this study (Moazzami 2011). Wildfires may also contribute to the risk of residential fires in remote areas, as shown by the spike in residential fire incidents in Alberta in 2011, likely attributable to a large wildfire that was declared close to a town and forced the evacuation of thousands of residents. Heavy urban and high-rise (skyscrapers) environments are also challenging for fire protection services, which may explain the high residential fire incident rates observed in Toronto, the most populous city in Canada (Toronto Fire Services 2017).
In support of our findings, trends in the number of residential fire casualties have consistently fallen in most high-income countries in the past decades, notably through the use and regulations of smoke alarms (Ahrens 2018b; Ross 2016; Winberg 2016). The residential fire-related death rates observed in our study are consistent with the results of provincial studies (BC Coroners Service 2012; Chernichko et al. 1993) and lower than those reported by the US. The 2016 average annual death rate in the US was 8.5 per million population (Ahrens 2018b), which is higher than the overall 6.4 per million population we observed. Comparisons with other countries are limited, given that most data do not target residential fires specifically, or are not reported in rates per population (Mulvaney et al. 2008). Additional research is needed to understand the highest proportion of deaths observed in Manitoba, but the high percentage of rural population may suggest some explanations, given highly dispersed firefighting resources and longer response times in rural areas (Jowett 2015), which likely increase the fire fatality risk. Although smoke alarms help to detect fires early enough for occupants to escape the house without serious injuries, it might not influence minor injuries that occur when occupants try to manage a fire themselves. This may explain why we failed to observe significant decreases in the rates of minor injuries over time, even though fire incident rates did significantly decrease, and may suggest the need to include more messages around safe ways to deal with a fire in public fire safety campaign and door-to-door messages. Comparisons of our residential injury rates with other studies are limited due to different injury definitions (Ahrens 2018b; Home Office 2018).
Our findings align with most studies in the literature reporting higher injury rates among adults (Ahrens 2014; Gilbert and Butry 2017; Mulvaney et al. 2008; Perry et al. 2015; The Office of the Fire Marshal and Emergency Management 2017b) and higher residential fire-related death rates among seniors (Ahrens 2014; Chernichko et al. 1993; Marshall et al. 1998; Perry et al. 2015). While children under five years of age and seniors have historically been reported at the greatest risk of fire death, our study showed that adults and seniors had higher death rates per population than children, suggesting that children may no longer have the highest risk of fire death. A recent US study reported similar findings where young children had slightly lower residential fire death risk than the overall population (Ahrens 2014). These findings may be a testimony to successful intensive efforts to decrease children’s risk of house fire casualties in the past decades, including education fire safety programs in schools and the “Stop, Drop and Roll” public campaign (Know When to Stop, Drop, and Roll 2012). It may also suggest the need to develop specific prevention messages targeting middle-age adults and seniors, as the current fire educational strategies may not resonate with these age groups. Higher residential fire casualty rates observed for males for all age groups, consistent with previous literature (Ahrens 2014; BC Coroners Service 2012; Chernichko et al. 1993; Istre et al. 2001; Mulvaney et al. 2008; Turner et al. 2017), are likely due to different risk-taking behaviours among males and females. Males may be more impulsive and more likely to try to manage the fire themselves or to re-enter a burning building, contributing to higher risk of house fire casualties (Ahrens 2018a). Conversely, females aged 30–39 observed the lowest injury rates, which may be related to safe behaviours among mothers of young families. Senior males have higher rates of death than injuries, which is not observed among females of the same age, and may be explained by different smoking habits, an important risk factor for residential fires and casualties (Ahrens 2014). The findings of this study suggest that public fire safety campaigns may benefit from developing different messages for males and females reflecting their different risk-taking behaviours to encourage meaningful behavioural changes by both sexes.
The current study found that residential fire incident and death rates per population have significantly decreased over time, but not death rates per 1000 residential fire incidents. Our findings highlight that progress has been made in preventing fires which has contributed to a decrease in the number of casualties, but the risk of death once a fire does occur has not improved. Moreover, while previous research has showed increased fatal residential fire casualties in rural areas (BC Coroners Service 2012; Chernichko et al. 1993; Clare and Kelly 2017), our study highlights that urban and suburban areas are more at risk of fatalities when a fire does occur (higher death rates per 1000 residential fire incidents). Potential explanations for these results include higher population density and higher rates of persons living alone. High-rise building structures may also contribute to higher deaths rates per 1000 residential fire incidents in urban environments, although based on that logic, cities would be expected to observe higher rates than suburban areas, which they do not. The increased risk of deaths per 1000 residential fire incidents for suburban areas may be due to suboptimal fire services in a context where the rapidly growing population may exceed fire department capacity for prevention activities, including door-to-door fire safety campaign and timely response to fire calls. Vacant and deteriorating properties, increasingly observed in some suburban areas where the demand for land is such that old properties are purchased to be demolished and replaced by new development, are vulnerable to intrusion and illegal activities, including drug trafficking and consumption, which may also contribute to higher risk of residential fire deaths if a fire does occur (Garis et al. 2016). These findings emphasize that despite progress in preventing residential fires, additional efforts to effectively protect people from getting injured when a fire does break out are needed. Further research assessing protective and risk factors, including age, population density, municipality and individuals’ socio-economic status, proportions of declining property in municipalities, firefighting coverage, citizens’ attitudes, and perceptions of fire safety, is essential to further contextualize our findings and to inform strategies that will better prevent residential fire casualties.
This study has some limitations. The NFID was initially assembled as a pilot project and so not all provinces and territories of Canada have yet provided data. While only 4 provinces were included in this study, these jurisdictions account for the majority (~ 66%) of the Canadian population. Missing data observed for victims’ age decreased the statistical power of age-based analyses and contributed to underestimates of the injury and death rates in each age group. However, given that missing values for victims’ age were unlikely concentrated in certain age groups, we assumed that these values were “missing completely at random” and thus should not have biased our findings.
Conclusion
This study is the first to seize the unique opportunity provided by the creation of the National Fire Information Database to compare provincial fire statistics of residential fires across 4 provinces in Canada. This study showed that while residential fire incidence has declined since 2005, injuries and deaths that result when a fire does occur have remained steady over time. Urban and suburban municipalities are particularly vulnerable to home fire death when a fire does occur, and males and seniors have the highest risk of residential fire-related injuries and deaths. In a context of financial restrictions, these findings provide policymakers, public health practitioners and fire departments with evidence to guide age- and sex-specific public fire safety campaigns and prioritize prevention strategies among the most vulnerable municipalities, in order to reduce the societal burden of residential fires in Canada.
Acknowledgements
The authors thank M. Frederick Lafrance, who provided insight and support for the analysis and presentation of geographic data and maps.
Compliance with ethical standards
Conflict of interest
The authors declare that they have no conflict of interest.
Footnotes
Publisher’s note
Springer Nature remains neutral with regard to jurisdictional claims in published maps and institutional affiliations.
References
- Ahrens, M. (2014). Characteristics of home fire victims. Retrieved from https://www.nfpa.org/osds. Accessed 5 Dec 2018.
- Ahrens, M. (2018a). Home fire victims by age and gender. Retrieved from https://www.nfpa.org/-/media/Files/News-and-Research/Fire-statistics-and-reports/Building-and-life-safety/oshomevictims.ashx?la=en. Accessed 1 Mar 2019.
- Ahrens, M. (2018b). Home structure fires. Retrieved from https://www.nfpa.org/-/media/Files/News-and-Research/Fire-statistics-and-reports/Building-and-life-safety/oshomes.pdf. Accessed 11 Mar 2019.
- Alberta Emergency Management Agency. (2009). Alberta fire commissioner’s statistical report. Retrieved from https://open.alberta.ca/dataset/04a21ab2-c7dc-4063-84a6-4481be5e4165/resource/2b365a7d-ce83-45e4-ac43-4700df246b38/download/745300-2009-fire-commissioner-statistical-report-aema.pdf. Accessed 11 Mar 2018.
- BC Coroners Service. (2012). Residential structure fire deaths in BC, 2007-2011. Burnaby. Retrieved from https://www2.gov.bc.ca/assets/gov/public-safety-and-emergency-services/death-investigation/statistical/fire.pdf. Accessed 1 Mar 2019.
- Canadian Centre for Justice Statistics. (2017). Fire statistics in Canada, selected observations from the National Fire Information Database 2005 to 2014. Retrieved from http://nfidcanada.ca/wp-content/uploads/2017/09/Fire-statistics-in-Canada-2005-to-2014.pdf. Accessed 5 Mar 2018.
- Chernichko, L., Saunders, L. D., & Tough, S. (1993). Unintentional house fire deaths in Alberta 1985-1990: a population study. Canadian Journal of Public Health = Revue Canadienne de Sante Publique, 84(5), 317–320 Retrieved from http://www.ncbi.nlm.nih.gov/pubmed/8269379. Accessed 1 Mar 2019. [PubMed]
- Clare, J., & Kelly, H. (2017). Fire and at risk populations in Canada analysis of the Canadian National Fire Information Database. Retrieved from https://cjr.ufv.ca/wp-content/uploads/2018/04/Murdoch-University-Fire-and-at-Risk-Populations.pdf. Accessed 19 Nov 2018.
- Committee on Injury and Poison Prevention Reducing the number of deaths and injuries from residential fires. Pediatrics. 2000;105(6):1355–1357. doi: 10.1542/peds.105.6.1355. [DOI] [PubMed] [Google Scholar]
- Garis, L. Thomas, L. Tyakoff, A. (2016). Distressed properties: pathways of decline and the emergence of public safety risk. Retrieved from https://www.researchgate.net/publication/303752220_Distressed_Properties_Pathways_of_Decline_and_the_Emergence_of_Public_Safety_Risk. Accessed 18 Mar 2019.
- Gilbert SW, Butry Identifying vulnerable populations to death and injuries from residential fires. Injury Prevention. 2017;0:1–7. doi: 10.1136/injuryprev-2017-042343. [DOI] [PubMed] [Google Scholar]
- Home Office. (2018). Fire and rescue incident statistics: England, year ending June 2018 further information. Retrieved from https://www.gov.uk/government/statistical-data-sets/fire-statistics-guidance. Accessed 5 Dec 2018.
- Istre GR, McCoy MA, Osborn LB, Jeffrey J, Bolton A. Deaths and injuries from house fires. The New England Journal of Medicine. 2001;344:25. doi: 10.1056/NEJM200106213442506. [DOI] [PubMed] [Google Scholar]
- Jowett, A. J. (2015). Urban, rural and in-between - fire rescue. Fire Rescue Magazine. Retrieved from https://www.firerescuemagazine.com/articles/print/volume-10/issue-1/wildland-urban-interface/urban-rural-and-in-between.html. Accessed 21 Dec 2018.
- Know when to stop, drop, and roll. (2012). Retrieved from https://www.nfpa.org/~/media/files/public-education/resources/education-programs/learn-not-to-burn/level-1/lntblevel1stopdroproll.pdf?la=en. Accessed 20 June 2019.
- Marshall SW, Runyan CW, Bangdiwala SI, Linzer MA, Sacks JJ, Butts JD. Fatal residential fires. JAMA. 1998;279(20):1633. doi: 10.1001/jama.279.20.1633. [DOI] [PubMed] [Google Scholar]
- Moazzami, B. (2011). Strengthening rural Canada: fewer and older: population and demographic challenges across rural Canada a pan-Canadian report. Retrieved from http://strengtheningruralcanada.ca/file/Fewer-Older-Population-and-Demographic-Challenges-Across-Rural-Canada.pdf.. Accessed 20 June 2019.
- Mulvaney C, Kendrick D, Towner E, Brussoni M, Hayes M, Powell J, et al. Fatal and non-fatal fire injuries in England 1995-2004: time trends and inequalities by age, sex and area deprivation. Journal of Public Health. 2008;31(1):154–161. doi: 10.1093/pubmed/fdn103. [DOI] [PubMed] [Google Scholar]
- Perry EC, Shields WC, O’Brocki R, Bishai D, Frattaroli S, Jones V, Gielen AC. Examining fire department injury data as a tool for epidemiological investigation. Journal of Burn Care & Research. 2015;36(2):310–314. doi: 10.1097/BCR.0000000000000075. [DOI] [PMC free article] [PubMed] [Google Scholar]
- Pike I, Richmond S, Rothman L, M. A. (2015). Canadian injury prevention resource. Toronto. Retrieved from http://parachutecanada.org/downloads/research/Canadian_Injury_Prevention_Resource-LR.pdf. Accessed 21 Dec 2018.
- Rohde D, Corcoran J, Sydes M, Higginson A. The association between smoke alarm presence and injury and death rates: a systematic review and meta-analysis. Fire Safety Journal. 2016;81:58–63. doi: 10.1016/J.FIRESAF.2016.01.008. [DOI] [Google Scholar]
- Ross, S. (2016). Trend and seasonal analysis for dwelling fire totals in Scotland over the. Retrieved from https://www.frsug.org/reports/Dwelling_Fires_in_Scotland_July_2016.pdf. Accessed 18 Nov 2018.
- Statistics Canada. (2015). Census subdivision (CSD). Retrieved June 16, 2019, from https://www12.statcan.gc.ca/census-recensement/2011/ref/dict/geo012-eng.cfm.
- The Office of the Fire Marshal and Emergency Management . Fire death rates | Ministry of Community Safety and Correctional Services. 2017. [Google Scholar]
- The Office of the Fire Marshal and Emergency Management. (2017b). Residential fires - injuries | Ministry of Community Safety and Correctional Services. Retrieved August 17, 2018, from https://www.mcscs.jus.gov.on.ca/english/FireMarshal/MediaRelationsandResources/FireStatistics/OntarioFires/HomeFires-Injuries/stats_injuries_res.html
- Toronto Fire Services. (2017). 2017 annual report. Retrieved from https://www.toronto.ca/wp-content/uploads/2018/04/900e-Annual-Report-2017-.pdf. Accessed 18 Nov 2018.
- Turner SL, Johnson RD, Weightman AL, Rodgers SE, Arthur G, Bailey R, Lyons RA. Risk factors associated with unintentional house fire incidents, injuries and deaths in high-income countries: a systematic review. Injury Prevention. 2017;23(2):131–137. doi: 10.1136/injuryprev-2016-042174. [DOI] [PubMed] [Google Scholar]
- Warda, L., Tenenbein, M., & Movatt, M. E. K. (1999). House fire injury prevention update. Part II. A review of the effectiveness of preventive interventions. Injury Prevention, 5, 217–225 Retrieved from https://www.ncbi.nlm.nih.gov/pmc/articles/PMC1730530/pdf/v005p00217.pdf. Accessed 18 Nov 2018. [DOI] [PMC free article] [PubMed]
- Wijayasinghe, M. (2011). Fire losses in Canada year 2007 and selected years. Retrieved from http://www.ccfmfc.ca/pdfs/report_e_07.pdf. Accessed 18 Nov 2018.
- Winberg, D. (2016). International fire death rate trends. Retrieved from https://www.diva-portal.org/smash/get/diva2:1072275/FULLTEXT01.pdf. Accessed 5 Dec 2018.


