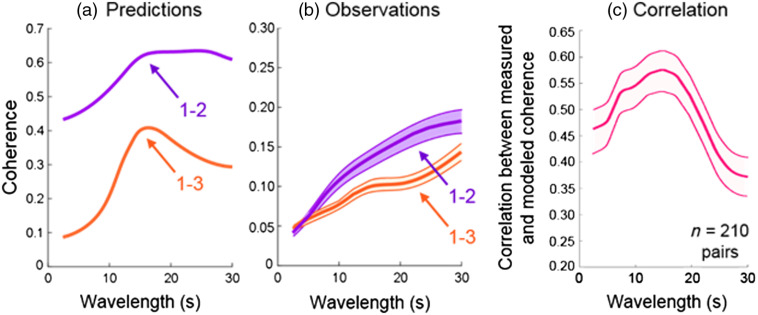
Fig. 5.
(a) The predicted wavelength-coherence plot between sequences 1 and 2 (purple) and sequences 1 and 3 (orange) obtained by averaging coherence of sequences convolved with the hemodynamic response function along the time dimension using Eq. (1). (b) Observed coherence plots in the visual ROI for the combined spatially filtered oxy- and deoxyhemoglobin signals obtained from all subject pairs [Eq. (1)]. Purple: average coherence between participants viewing sequences 1 and 2, orange: average coherence between participants viewing sequences 1 and 3. (c). The correlation between the measured coherence and the expected coherence [Eq. (1)].

