Abstract
Background
Methotrexate is a folic acid antagonist widely used for the treatment of neoplastic disorders. Methotrexate inhibits the synthesis of deoxyribonucleic acid (DNA), ribonucleic acid (RNA) and proteins by binding to dihydrofolate reductase. Currently, methotrexate is among the most commonly used drugs for the treatment of rheumatoid arthritis (RA). This is an update of the previous Cochrane systematic review published in 1997.
Objectives
To evaluate short term benefits and harms of methotrexate for treating RA compared to placebo.
Search methods
The Cochrane Musculoskeletal Group Trials Register, The Cochrane Central Register of Controlled Trials (CENTRAL), MEDLINE and EMBASE were searched from 1966 to 1997 and then updated to November 2013. The search was complemented with a bibliography search of the reference lists of trials retrieved from the electronic search.
Selection criteria
Randomized controlled trials and controlled clinical trials comparing methotrexate (MTX) monotherapy against placebo alone in people with RA. Any trial duration and MTX doses were included.
Data collection and analysis
Two review authors independently determined which studies were eligible for inclusion, extracted data and assessed risk of bias. Outcomes were pooled using mean differences (MDs) for continuous variables or standardized mean differences (SMDs) when different scales were used to measure the same outcome. Pooled risk ratio (RR) was used for dichotomous variables. Fixed‐effect models were used throughout, although random‐effects models were used for outcomes showing heterogeneity.
Main results
Five trials with 300 patients were included in the original version of the review. An additional two trials with 432 patients were added to the 2013 update of the review for a total of 732 participants. The trials were generally of unclear to low risk of bias with a follow‐up duration ranging from 12 to 52 weeks. All trials included patients who have failed prior treatment (for example, gold therapy, D‐penicillamine, azathioprine or anti‐malarials); mean disease duration that ranged between 1 and 14 years with six trials reporting more than 4 years; and weekly doses that ranged between 5 mg and 25 mg.
Benefits
Statistically significant and clinically important differences were observed for most efficacy outcomes. MTX monotherapy showed a clinically important and statistically significant improvement in the American College of Rheumatology (ACR) 50 response rate when compared with placebo at 52 weeks (RR 3.0, 95% confidence interval (CI) 1.5 to 6.0; number needed to treat (NNT) 7, 95% CI 4 to 22). Fifteen more patients out of 100 had a major improvement in the ACR 50 outcome compared to placebo (absolute treatment benefit (ATB) 15%, 95% CI 8% to 23%).
Statistically significant improvement in physical function (scale of 0 to 3) was also observed in patients receiving MTX alone compared with placebo at 12 to 52 weeks (MD ‐0.27, 95% CI ‐0.39 to ‐0.16; odds ratio (OR) 2.8, 95% CI 0.23 to 32.2; NNT 4, 95% CI 3 to 7). Nine more patients out of 100 improved in physical function compared to placebo (ATB ‐9%, 95% CI ‐13% to ‐5.3%). Similarly, the proportion of patients who improved at least 20% on the Short Form‐36 (SF‐36) physical component was higher in the MTX‐treated group compared with placebo at 52 weeks (RR 1.5, 95% CI 1.0 to 2.1; NNT 9, 95% CI 4 to 539). Twelve more patients out of 100 showed an improvement of at least 20% in the physical component of the quality of life measure compared to placebo (ATB 12%, 95% CI 1% to 24%). No clinically important or statistically significant differences were observed in the SF‐36 mental component.
Although no statistically significant differences were observed in radiographic scores (that is, Total Sharp score, erosion score, joint space narrowing), radiographic progression rates (measured by an increase in erosion scores of more than 3 units on a scale ranging from 0 to 448) were statistically significantly lower for patients in the MTX group compared with placebo‐treated patients (RR 0.31, 95% CI 0.11 to 0.86; NNT 13, 95% CI 10 to 60). Eight more patients out of 100 showed less damage to joints measured by an increase in erosion scores compared to placebo (ATB ‐8%, 95% CI ‐16% to ‐1%). In the one study measuring remission, no participants in either group met the remission criteria. These are defined by at least five of (≥ 2 months): morning stiffness of < 15 minutes, no fatigue, no joint pain by history, no joint tenderness, no joint swelling, and Westergren erythrocyte sedimentation rate (ESR) of < 20 mm/hr in men and < 30 mm/hr in women.
Harms
Patients in the MTX monotherapy group were twice as likely to discontinue from the study due to adverse events compared to patients in the placebo group, at 12 to 52 weeks (16% versus 8%; RR 2.1, 95% CI 1.3 to 3.3; NNT 13, 95% CI 6 to 44). Compared to placebo, nine more people out of 100 who took MTX withdrew from the studies because of side effects (ATB 9%, 95% CI 3% to 14%). Total adverse event rates at 12 weeks were higher in the MTX monotherapy group compared to the placebo group (45% versus 15%; RR 3.0, 95% CI 1.4 to 6.4; NNT 4, 95% CI 2 to 17). Thirty more people out of 100 who took MTX compared to those who took placebo experienced any type of side effect (common or rare) (ATB 30, 95% CI 13% to 47%). No statistically significant differences were observed in the total number of serious adverse events between the MTX group and the placebo group at 27 to 52 weeks. Three people out of 100 who took MTX alone experienced rare but serious side effects compared to 2 people out of 100 who took a placebo (3% versus 2%, respectively).
Authors' conclusions
Based on mainly moderate to high quality evidence, methotrexate (weekly doses ranging between 5 mg and 25 mg) showed a substantial clinical and statistically significant benefit compared to placebo in the short term treatment (12 to 52 weeks) of people with RA, although its use was associated with a 16% discontinuation rate due to adverse events.
Keywords: Female; Humans; Male; Antirheumatic Agents; Antirheumatic Agents/adverse effects; Antirheumatic Agents/therapeutic use; Arthritis, Rheumatoid; Arthritis, Rheumatoid/drug therapy; Folic Acid Antagonists; Folic Acid Antagonists/adverse effects; Folic Acid Antagonists/therapeutic use; Medication Adherence; Medication Adherence/statistics & numerical data; Methotrexate; Methotrexate/adverse effects; Methotrexate/therapeutic use; Randomized Controlled Trials as Topic
Plain language summary
Methotrexate for treating rheumatoid arthritis
We looked at studies until November 2013 on the effect of receiving methotrexate alone compared to placebo (no treatment) over 12 to 52 weeks in 732 people with rheumatoid arthritis.
Key findings
In the short term treatment of people with rheumatoid arthritis, methotrexate:
‐ improves pain, function and other symptoms;
‐ probably reduces joint damage as seen on the x‐ray.
Precise information about side effects and complications was not always available. Common side effects may include nausea, vomiting, diarrhoea, loss of appetite, stomach pain, and sores on lips, mouth or throat. Rare complications may include birth defects, kidney, lung and liver problems.
What is rheumatoid arthritis and what is methotrexate?
When you have rheumatoid arthritis, your immune system, which normally fights infection, attacks the lining of your joints making your joints swollen, stiff and painful. Treatments aim to decrease symptoms and improve your ability to move.
Methotrexate is one of a group of medications called disease‐modifying antirheumatic drugs (DMARDs) and it is the most common treatment for rheumatoid arthritis. Methotrexate helps prevent further permanent damage that can happen if rheumatoid arthritis is not treated.
What happens to people with rheumatoid arthritis who take methotrexate alone?
ACR 50 (number of tender or swollen joints and other outcomes such as pain and disability) ‐ 15 more people out of 100 experienced major improvement in the symptoms of their rheumatoid arthritis after 12 months with methotrexate when compared to placebo (15% absolute improvement). ‐ 23 people out of 100 who took methotrexate alone experienced major improvement. ‐ 8 people out of 100 who took a placebo experienced major improvement.
Remission or absence of active disease
In people who took either placebo or methotrexate, none had absence of active disease.
Disability (lower scores mean lower disability)
‐ People who took methotrexate rated their disability to be 0.27 points lower on a scale of 0 to 3 after 3 to 12 months with methotrexate when compared to placebo (9% absolute improvement). ‐ People who took methotrexate rated their disability to be between 0.39 and 1.04. ‐ People who took placebo rated their disability to be between 0.53 and 1.34.
Quality of life ‐ physical component (ability to perform physical activities at least 20% better)
‐ 12 more people out of 100 perceived their ability to perform physical activities at least 20% better after 12 months with methotrexate alone compared to placebo (12% absolute improvement). ‐ 39 people out of 100 who took methotrexate alone perceived their ability to perform physical activities at least 20% better. ‐ 27 people out of 100 who took a placebo perceived their ability to perform physical activities at least 20% better.
Quality of life ‐ mental component
‐ 5 more people out of 100 perceived their mental well‐being better after 12 months with methotrexate alone compared to placebo (5% absolute improvement). ‐ 26 people out of 100 who took methotrexate alone perceived their mental well‐being better. ‐ 21 people out of 100 who took a placebo perceived their mental well‐being better.
X‐rays of the joints ‐ 8 more people out of 100 had less x‐ray damage to joints measured by increase in erosion scores of more than 3 units on a scale ranging from 0 to 448 in people who took methotrexate compared to placebo after 12 months (8% absolute reduction). ‐ 4 people out of 100 who took methotrexate alone had increased damage to joints measured by x‐ray. ‐12 people out of 100 who took a placebo had increase damage to joints measured by x‐ray.
Discontinuations due to adverse events (side effects and complications) ‐ 9 more people out of 100 discontinued methotrexate due to adverse events after 3 to 12 months compared to placebo (9% absolute withdrawals). ‐ 16 people out of 100 who took methotrexate alone discontinued methotrexate due to adverse events. ‐ 8 people out of 100 who took a placebo discontinued placebo due to adverse events.
Serious adverse events ‐ 1 more person out of 100 experienced serious side effects after 3 to 12 months with methotrexate alone compared to placebo (1% absolute harm). ‐ 3 people out of 100 who took methotrexate alone experienced serious side effects. ‐ 2 people out of 100 who took a placebo experienced serious side effects.
Summary of findings
Summary of findings for the main comparison. Methotrexate for rheumatoid arthritis.
| Methotrexate for rheumatoid arthritis | |||||||
| Patient or population: patients with rheumatoid arthritis Settings: rheumatology clinics Intervention: methotrexate (weekly doses ranging between 5 mg and 25 mg) | |||||||
| Outcomes | Illustrative comparative risks* (95% CI) | Relative effect (95% CI) | No of Participants (studies) | Quality of the evidence (GRADE) | Comments | ||
| Assumed risk | Corresponding risk | ||||||
| Control | Methotrexate | ||||||
| ACR 50 American College of Rheumatology improvement criteria Follow‐up: 52 weeks | 8 per 100 | 23 per 100 (12 to 46) | RR 3.0 (1.5 to 6.0) | 300 (1 study) | ⊕⊕⊕⊝ moderate1 | Absolute treatment benefit 15% (95% CI 8% to 23%); Relative percent change 203% (95% CI 53% to 498%); NNTB 7 (95% CI 4 to 22); Analysis 1.2 | |
|
Remission3 Follow‐up: 18 weeks |
0 per 100 | 0 per 100 | Not estimable | 189 (1 study) |
⊕⊕⊝⊝ low1,2 |
Not statistically significant. No patients in either group met the remission criteria | |
| Functional Status Health Assessment Questionnaire Disability Index . Scale from: 0 to 3 Follow‐up: 12‐52 weeks | The mean functional status ranged across control groups from 0.53‐1.34 units | The mean functional status in the intervention groups was 0.27 lower (0.39 to 0.16 lower) | 298 (2 studies) | ⊕⊕⊕⊝ moderate2 | Absolute treatment benefit ‐9% (95% CI ‐13% to ‐5.3%); Relative percent change 20% (95% CI 29% to 12%); Analysis 2.1The reported final mean scores in the methotrexate group was 1.0 and in the placebo group 1.3. NNTB 4 (95% CI 3 to 7)4 | ||
|
Health‐Related Quality of Life at least 20% improvement Follow‐up: 52 weeks |
SF‐36 Physical Component | 27 per 100 | 39 per 100 (27 to 57) | RR 1.5 (1 to 2.1) | 263 (1 study) | ⊕⊕⊕⊝ moderate1 | Absolute treatment benefit 12% (95% CI 1% to 24%); Relative percent change 45% (95% CI 0% to 112%); NNTB 9 (95% CI 4 to 539); Analysis 2.7 |
| SF‐36 Mental Component | 21 per 100 |
26 per 100 (16 to 41) |
RR 1.3 (0.79 to 2.0) | 263 (1 study) | ⊕⊕⊕⊝ moderate1 | Not statistically significant; Absolute treatment benefit 5% (95% CI ‐5% to 16%); Relative percent change 25% (95% CI ‐21% to 98%); Analysis 2.8 | |
| Radiographic Progression Increase in erosion scores of > 3 units Follow‐up: 52 weeks | 12 per 100 | 4 per 100 (1 to 10) | RR 0.31 (0.11 to 0.86) | 219 (1 study) | ⊕⊕⊕⊝ moderate1 | Absolute treatment benefit ‐8% (95% CI ‐16% to ‐1%); Relative percent change ‐69% (95% CI ‐89% to ‐14%); NNTB 13 (95% CI 10 to 60); Analysis 3.1 | |
|
Discontinuations
due to adverse events Follow‐up: 12‐52 weeks |
8 per 100 | 16 per 100 (10 to 25) | RR 2.1 (1.3 to 3.3) | 613 (6 studies) | ⊕⊕⊕⊕ high | Absolute treatment benefit 9% (95% CI 3% to 14%); Relative percent change 106% (95% CI 30% to 225%); NNTH 13 (95% CI 6 to 44); Analysis 4.3 | |
| Serious Adverse Events Follow‐up: 12‐52 weeks | 2 per 100 | 3 per 100 (1 to 14) | RR 1.4 (0.36 to 5.7) | 330 (2 studies) | ⊕⊕⊕⊝ moderate2 | Not statistically significant; Absolute treatment benefit 1% (95% CI ‐3% to 4%); Relative percent change 44% (95% CI ‐64% to 474%); Analysis 5.2 | |
| *The basis for the assumed risk (e.g. the median control group risk across studies) is provided in footnotes. The corresponding risk (and its 95% confidence interval) is based on the assumed risk in the comparison group and the relative effect of the intervention (and its 95% CI). CI: Confidence interval; RR: Risk ratio | |||||||
| GRADE Working Group grades of evidence High quality: Further research is very unlikely to change our confidence in the estimate of effect. Moderate quality: Further research is likely to have an important impact on our confidence in the estimate of effect and may change the estimate. Low quality: Further research is very likely to have an important impact on our confidence in the estimate of effect and is likely to change the estimate. Very low quality: We are very uncertain about the estimate. | |||||||
1Only one study reported this outcome. Probability of publication bias: published evidence is limited to a small number of trials, all of which are showing benefits of the studied intervention.
2Limitations in the design and implementation of available studies suggesting high likelihood of bias. Analysis was performed in the completers population and the discontinuation rate was higher than 20% 3Williams 1985 categorized patients to be in therapeutic remission if they had at least 5 of (≥2 months): morning stiffness of <15 minutes, no fatigue, no joint pain by history, no joint tenderness, no joint swelling, and Westergren ESR of <20 mm/hr in men and <30 mm/hr in women.
4Strand 1999 (ULTRA) used as the control group baseline mean and control group standard deviation for calculations.
1.2. Analysis.

Comparison 1 Efficacy, Outcome 2 ACR 50.
2.1. Analysis.
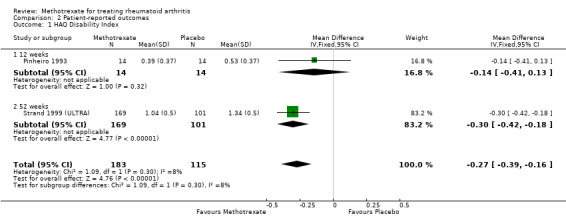
Comparison 2 Patient‐reported outcomes, Outcome 1 HAQ Disability Index.
2.7. Analysis.
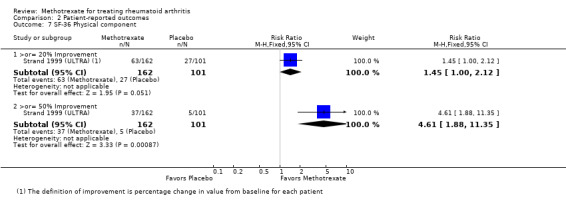
Comparison 2 Patient‐reported outcomes, Outcome 7 SF‐36 Physical component.
2.8. Analysis.
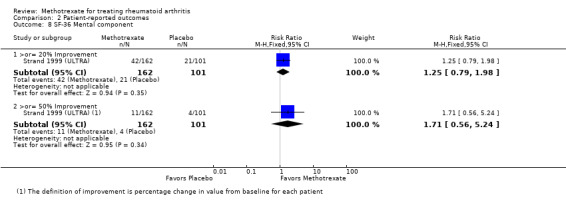
Comparison 2 Patient‐reported outcomes, Outcome 8 SF‐36 Mental component.
3.1. Analysis.

Comparison 3 Radiographic outcomes, Outcome 1 Radiographic Progression.
4.3. Analysis.
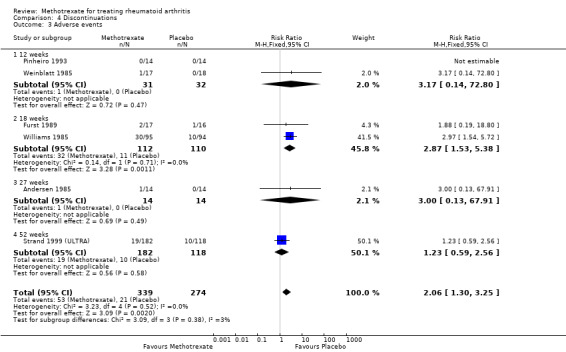
Comparison 4 Discontinuations, Outcome 3 Adverse events.
5.2. Analysis.
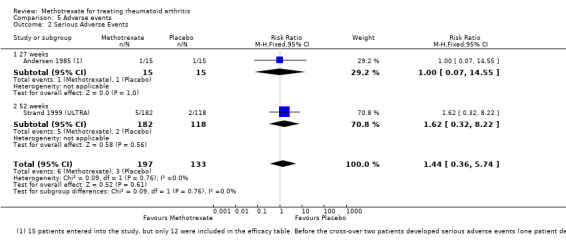
Comparison 5 Adverse events, Outcome 2 Serious Adverse Events.
Background
Description of the condition
Rheumatoid arthritis (RA) is a chronic, systemic inflammatory condition of unknown cause. Clinical presentation can include synovial proliferation, symmetric erosive arthritis, and systemic involvement.
Description of the intervention
Methotrexate is a folic acid antagonist widely used for the treatment of neoplastic disorders. Methotrexate inhibits the synthesis of deoxyribonucleic acid (DNA), ribonucleic acid (RNA) and proteins by binding to dihydrofolate reductase.
How the intervention might work
The potential benefits of methotrexate for the treatment of RA were originally suggested by Gubner 1951 in a case series study of six patients with RA. Subsequent open trials supported the efficacy of the drug (Groff 1983; Steinsson 1982; Willkens 1980). The first controlled trials of methotrexate against placebo in people with RA were reported in the 1980s. Currently, methotrexate is among the most commonly used drugs for the treatment of RA.
Why it is important to do this review
This systematic review synthesizes and updates the evidence of a previous published Cochrane review reporting the benefits and harms of methotrexate monotherapy compared to placebo.
Objectives
To evaluate the short term benefits and harms of methotrexate for the treatment of RA compared to placebo.
Methods
Criteria for considering studies for this review
Types of studies
Randomized controlled trials (RCTs) and clinical controlled trials (CCTs) comparing methotrexate with placebo for a minimum duration of 12 weeks. Twelve weeks is thought to be the minimum treatment duration required to adequately assess the efficacy of methotrexate. We included studies reported as full‐text, published as abstract only, and unpublished data. There was no language restriction.
Types of participants
People with a diagnosis of RA that was severe and of long duration, who had a high prevalence of positive rheumatoid factor (RF), and had previously failed other second line disease‐modifying antirheumatic drug (DMARD) therapy.
Types of interventions
We included trials comparing methotrexate (oral or parenteral) at a dose level of at least 5 mg per week with placebo. Only trials with a treatment duration of at least 12 weeks in a double‐blind phase were considered for inclusion.
Types of outcome measures
Major outcomes
1. All the outcome measures in OMERACT 1993 were included for potential analysis. OMERACT measures for efficacy include: a) number of tender joints per patient; b) number of swollen joints per patient; c) pain (Visual Analogue Scale or VAS); d) physician global assessment; e) patient global assessment; f) Functional status (measured by a validated scale such as the Health Assessment Questionnaire (HAQ)); g) acute phase reactants, including erythrocyte sedimentation rate (ESR) and C‐reactive protein (CRP).
2. American College of Rheumatology (ACR) core set: ACR 20, 50, or 70 responses (Felson 1995).
3. Remission measured by disease activity (van der Heijde 2005) using the disease activity score (DAS) < 1.6 or DAS28 < 2.6, or as specified by the authors.
4. Radiological damage (joint damage shown on x‐ray).
5. Discontinuations. These were analysed as discontinuations because of adverse events, lack of efficacy, and due to system‐specific adverse reactions (e.g. gastrointestinal, renal, etc).
6. Adverse events. Number of patients who experienced serious, total, or individual adverse events.
Minor outcomes
Health‐related quality of life measured by validated scales including the Medical Outcomes Study Short‐Form 36 (SF‐36) and activities of daily living (ADL).
Search methods for identification of studies
Electronic searches
The Cochrane Musculoskeletal Group register, Cochrane Controlled Trials Register (CCTR), MEDLINE (1966 to July 1997) and EMBASE (1988 to July 1997) were searched using the strategy developed by Dickersin 1994. A further search was performed from 1997 to November 2013 in MEDLINE (Appendix 1), CENTRAL in The Cochrane Library (Appendix 2), EMBASE (Appendix 3), Web of Science (Appendix 4), and ClinicalTrials.gov (Appendix 5). The search was not limited by language, year of publication or type of publication. The MEDLINE search strategy that was used is located in Appendix 1. This strategy was modified for the other databases.
Searching other resources
Reference lists of all the trials selected through the electronic searches were manually searched to identify additional trials. Key experts in the area were contacted for further published and unpublished articles. The ClinicalTrials.gov (www.ClinicalTrials.gov) website and the World Health Organization (WHO) International Clinical Trials Registry Platform trials portal (www.who.int/ictrp/en/) were also searched to identify any ongoing trials, in November 2013.
For safety assessments, we searched the websites of the regulatory agencies (US Food and Drug Administration‐MedWatch (http://www.fda.gov/Safety/MedWatch/default.htm), European Medicines Evaluation Agency (http://www.ema.europa.eu), Australian Adverse Drug Reactions Bulletin (http://www.tga.gov.au/safety/ews‐monitoring.htm), and UK Medicines and Healthcare products Regulatory Agency (MHRA) pharmacovigilance and drug safety updates (http://www.mhra.gov.uk/Safetyinformation/index.htm) using the keyword ‘methotrexate’ on 19 March 2014.
Data collection and analysis
Selection of studies
Two review authors (MLO, HRS) independently screened the titles and abstracts of all the potential studies identified as a result of the search for inclusion and coded them as 'retrieve' (eligible or potentially eligible or unclear) or 'do not retrieve'. Next, two review authors (MLO, HRS) independently screened the full‐texts and identified studies for inclusion, and recorded reasons for exclusion of the ineligible studies. Disagreement were resolved through discussion or, when required, by a third review author (MSA). We identified and excluded duplicates, and collated multiple reports of the same study.
Data extraction and management
We used a data collection form for study characteristics and outcome data, which was piloted using one study in the review. Two review authors (MLO, HRS) extracted the study characteristics and outcome measures of efficacy and toxicity from the included studies.
Assessment of risk of bias in included studies
Two review authors (MLO, HRS) independently assessed risk of bias for each study using the criteria outlined in the Cochrane Handbook for Systematic Reviews of Interventions (Higgins 2011). Disagreements were resolved by consensus. We assessed the risk of bias according to several domains including: a) random sequence generation, b) allocation concealment, c) blinding of participants and personnel, d) blinding of outcome assessment, e) incomplete outcome data, f) selective outcome reporting, g) other bias (that is, baseline imbalance). We graded each potential source of bias as high, low or unclear and provide a quote from the study report together with a justification for our judgement in the 'Risk of bias' table. We summarised the risk of bias judgements across different studies for each of the domains listed. Figures were generated to provide summary assessments of the risk of bias.
Measures of treatment effect
Dichotomous data were analysed as risk ratios (RR) and 95% confidence intervals (CI) were also estimated. Continuous data were pooled as mean differences (MD) with corresponding 95% CI or standardized mean differences (SMD) in the case of joint scores, pain, global and functional assessments. This was necessary because of the variation in the outcome measures included in each study (for example, different number of swollen joints counted). Trial results were entered into RevMan using the same direction in order to enable the pooling of results, with the lower values indicating better responses. Negative values in SMD indicated a benefit of the active drug over placebo. The SMD was back‐translated to a typical scale (for example, 0 to 10 for pain) by multiplying the SMD by a typical among‐person standard deviation (for example, the standard deviation of the control group at baseline from the most representative trial) (Higgins 2011).
Unit of analysis issues
We planned to include cross‐over randomised trials, but only if data from the first period were reported. When multiple methotrexate doses were evaluated in a single trial, we included only the most relevant (close to clinical practice) dosage.
Dealing with missing data
Authors from two trials were contacted to obtain missing numerical outcome data, but no response was obtained. For continuous outcomes, we calculated the effect estimate based on the number of patients analysed at the final visit. If the number of patients analysed was not presented, the number reported at baseline was used. When only median and interquartile ranges were reported, the median was used as the mean and one half of the difference between the first and third quartile range was used as the standard deviation. When the end‐of‐trial standard deviation was not reported we used the baseline standard deviation for the pooled analysis. In our experience, the baseline standard deviation of RA outcome measures is often very close to the end‐of‐trial standard deviation, perhaps slightly larger. This resultant bias would therefore result in decreased weighting of the studies and is preferable to completely excluding them. If no standard deviation was provided at baseline, missing standard deviations were computed from other statistics such as standard errors or imputed from other studies in the meta‐analysis. When numerical data were only reported graphically, the value was extracted from the graph.
Assessment of heterogeneity
The heterogeneity of the trials for each pooled analysis was estimated using the Chi2 test and I2 statistic. For the Chi2 test, a P value ≤ 0.10 indicated evidence of statistical heterogeneity. An I2 value of 0% to 40% might 'not be important'; 30% to 60% may represent 'moderate' heterogeneity; 50% to 90% may represent 'substantial' heterogeneity; and 75% to 100% represents 'considerable' heterogeneity (Higgins 2011).
Assessment of reporting biases
A funnel plot was not planned a priori. In addition, this could not be created for the updated version of the review due to the limited number of studies that were included.
Data synthesis
Fixed‐effect models were used throughout. Random‐effects models were used for outcomes showing statistically significant heterogeneity.
Summary of findings table
A 'Summary of findings' table was created using the following outcomes: 1) ACR 50 response, 2) disease remission, 3) functional status, 4) health‐related quality of life, 5) radiographic progression, 6) discontinuations due to adverse events, 7) serious adverse events.
Two people (MLO, HRS) independently assessed the quality of the evidence. We used the five GRADE considerations (study limitations, consistency of effect, imprecision, indirectness and publication bias) to assess the quality of a body of evidence as it related to the studies which contributed data to the meta‐analyses for the prespecified outcomes. In the comments column of the summary of findings table we provided the absolute per cent difference, the relative per cent change from baseline, and the number needed‐to‐treat (NNT).
For dichotomous outcomes, the absolute risk difference was calculated using the risk difference statistic in RevMan and the result expressed as a percentage. For continuous outcomes, the absolute benefit was calculated as the improvement in the intervention group minus the improvement in the control group, in the original units.
The relative per cent change for dichotomous data was calculated as the risk ratio ‐ 1 and expressed as a percentage. For continuous outcomes, the relative difference in the change from baseline was calculated as the absolute benefit divided by the baseline mean of the control group.
The number needed to treat (NNT) was provided only when the outcome showed a statistically significant difference. For dichotomous outcomes, the NNT was calculated from the control group event rate and the relative risk using the Visual Rx NNT calculator (Cates 2008). The NNT for the functional status was calculated using the Wells calculator (available at the CMSG Editorial office).
Subgroup analysis and investigation of heterogeneity
The results on efficacy were analysed for all the study endpoints (12, 18, 27, and 52 weeks). We evaluated subgroup interactions and compared the magnitude of the effects between the subgroups by assessing the overlap of the confidence intervals of the summary measures estimated. Non‐overlap of the confidence intervals indicated statistical significance.
Sensitivity analysis
For the cross‐over trials where data from the first period was not provided for both arms, we explored the impact of including the studies in the overall assessment of results by a sensitivity analysis. For dichotomous outcomes (for example, number of withdrawals due to adverse events), we also compared the magnitude of the effects when using the intention to treat population versus completers as the denominator.
Results
Description of studies
The methods of the included studies are summarised in the Characteristics of included studies tables.
Results of the search
The search strategy for the original review was run from inception to 1997. From 11 potentially eligible articles, only 5 trials (8 publications) met the inclusion criteria (Andersen 1985; Furst 1989; Pinheiro 1993; Weinblatt 1985; Williams 1985). For the update, a search strategy was run from 1997 to November 2013. Figure 1 shows a flow diagram of the disposition of the studies. For the update, there were 6859 unique citations retrieved from the electronic databases. After screening the titles and abstracts, we found 3099 relevant citations. Of these, 3090 were excluded (combined methotrexate or no placebo group). We retrieved the full‐texts of 9 potentially eligible articles, but a further 3 were excluded (combined placebo group). Only two new trials (six publications) met the inclusion criteria (Jiang 1998; Strand 1999 (ULTRA)).
1.
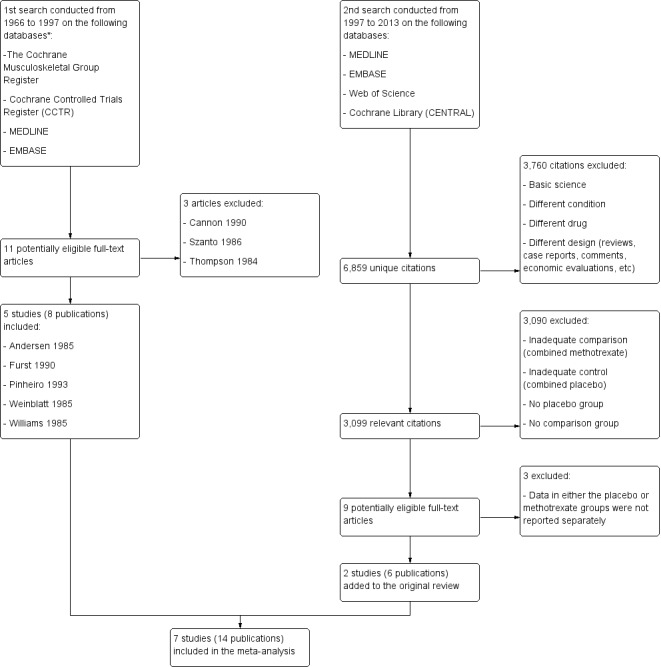
Flow diagram of the included studies.
*Additional data were unavailable since at the time of the publication this information was not required to be reported.
Included studies
The summary of the characteristics of included studies and participants are shown in Table 2 and Table 3.
1. Characteristics of the included studies.
| Study, year | Sample size | Country (# sites) | Follow‐up duration | Methotrexate dose, frequency and route | Funding | |
| Methotrexate | Placebo | |||||
| Andersen 1985 | 15a | United States (2 centres) | 27 weeks | 5‐25 mg IM weekly dosesb | Grant from Veterans administration | |
| Furst 1989 | 17 | 16 | United States (single centre) | 18 weeks | 5 mg/m2c, 10 mg/m2 orally, weekly | CRC Grant RR59 and Lederle laboratories |
| Jiang 1998 | 90 | 42 | China (single centre) | 12 weeks | 7.5 mg‐15 mg | Not reported |
| Pinheiro 1993 | 14 | 14 | Brazil (single centre) | 12 weeks | 2.5 mg every 12 hours for three doses on the first weekd | Not reported |
| Strand 1999 (ULTRA) | 182 | 118 | United States and Canada (42 centres) | 52 weeks | 7.5‐15 mg weekly | Hoechst Marion Rousel (HMR), Bridgewater, NJ |
| Weinblatt 1985 | 17 | 18 | United States (single centre) | 12 weeks | 2.5‐5 mg every 12 hours for three doses weekly | National Institutes of health, Lederle laboratories and the New England Peabody Home Foundation |
| Williams 1985 | 95 | 94 | United States (9 centres) | 18 weeks | 7.5‐15mg per week | NIADDK and by Public Health Service research grants from the Division of Research Resources |
aCross‐over design, only 12 were included in the efficacy analysis and 14 in the safety analysis.
bPlacebo: 0.2 mL‐1 mL of normal saline three weekly doses.
c13 patients assigned to received 5 mg/m2 were excluded from the analyses.
dSecond week increased to four doses, third week to five doses, and from the fourth to the 12th six doses.
2. Patient Characteristics.
| Study, Year | Mean Age (years) | Mean Disease Duration (years) | Females (n) | Previous Treatmentb | Concomitant treatment allowed |
| Andersen 1985 | 60.4 | 14 | 9 | NSAIDs, (gold compounds, penicillamine, antimalarials were discontinue 2 months prior entry) | NSAIDs, Prednisone maintained at the same dose |
| Furst 1989 | 55.6 | 4.75 | 29 | Gold therapy, D‐penicillamine, Azathioprine | NSAIDs, Prednisone (<10mg or equivalent daily) |
| Jiang 1998 | MTX: 46 Placebo: 50 |
MTX: 1 Placebo: 1 |
100 | NSAIDs | |
| Pinheiro 1993 | MTX: 47.1 Placebo: 47.6 |
MTX: 7.6 Placebo: 8.4 |
25 | Gold salts, D‐penicillamine, Cloroquine diphosphate, Sulfasalazine | NSAIDs, Corticosteroids maintained at the same dose |
| Strand 1999 (ULTRA) | MTX: 53.3 Placebo: 54.6 |
MTX: 6.5 Placebo: 6.9 |
220 | Other disease modifying anti‐rheumatic drugs except methotrexatec | NSAIDs, Prednisone (<10mg/d or equivalent) Folate 1mg once or twice daily |
| Weinblatt 1985 | MTX: 60 Placebo: 59 |
MTX: 8.33 Placebo: 10.66 |
25 | Gold salt therapy, Penicillamine, Hydroxychloroquine and Azathioprine | Stable doses of Aspirin, NSAIDs, Prednisone <10mg/d |
| Williams 1985 | MTX: 53 Placebo: 55 |
MTX: 14 Placebo: 13 |
134 | Parenteral or oral gold therapy, D‐penicillamine, azathioprine, cyclophosphamide, chlorambucil, antimalarials. | Stable doses of Aspirin and/or NSAID. Prednisone <10mg/d Analgesics (acetaminophen, propoxyphene, or codeine) |
aMean (range)
bThese drugs had been discontinued because of ineffectiveness or toxicity.
cAll disease modifying anti‐rheumatic drugs were discontinued for at least 30 days before the study entry.
Summary of studies
Design: there were four parallel group randomised controlled trials (Jiang 1998; Pinheiro 1993; Strand 1999 (ULTRA); Williams 1985) and two trials with a cross‐over design (Andersen 1985; Weinblatt 1985). For Andersen 1985, we collected only data on adverse events because no separate data were provided for period 1 (before cross‐over) of the study. There was an additional trial where patients received methotrexate for 12 days and were then blindly randomised to methotrexate (5 or 10 mg/m2) or placebo (Furst 1989). Randomization ratios included 1:1 (Andersen 1985; Furst 1989; Pinheiro 1993; Weinblatt 1985; Williams 1985), 2:1 (Jiang 1998) and 3:2:3 (Strand 1999 (ULTRA)).
Sample sizes: sample sizes ranged from 15 patients (Andersen 1985) to 485 (Strand 1999 (ULTRA)). We excluded 13 patients from Furst 1989 who were receiving methotrexate doses less than 7.5 mg every week and 182 patients from Strand 1999 (ULTRA) receiving leflunomide. At the end, we included 732 patients in our analyses.
Setting: four of the trials were conducted in the United States (Andersen 1985;Furst 1989;Weinblatt 1985; Williams 1985), one in United States and Canada (Strand 1999 (ULTRA)), one in China (Jiang 1998) and one in Brazil (Pinheiro 1993). Four trials were conducted at single centres (Furst 1989; Jiang 1998; Pinheiro 1993; Weinblatt 1985) and three trials were multicenter studies conducted at 2, 9, and 42 centres (Andersen 1985; Strand 1999 (ULTRA); Williams 1985).
Participants: 542 (74%) patients were females. The mean age of patients ranged from 46 to 60 years. Patients were at least 16 years old and met the ACR criteria for RA. Except for Jiang 1998, the population in most trials included in the review had severe RA of long duration (mean disease duration ranged from 4.8 to 14 years) and a high prevalence of positive rheumatoid factor (RF). All participants had previously failed other second‐line agents (DMARD) therapy including gold therapy, D‐penicillamine, azathioprine, sulphasalazine, and anti‐malarials. Most were allowed concurrent use of steroids and non‐steroidal anti‐inflammatory drugs (NSAIDs). Common exclusion criteria included active liver disease, history of malignancy, history of renal disease, and presence of other arthritic conditions.
Interventions: 415 patients received methotrexate monotherapy and 302 received matching placebo. An additional 15 patients in Andersen 1985 received both methotrexate and matching placebo at different points of time during the study (Table 2). Methotrexate was administered orally in six studies and intramuscularly (IM) in one study (Andersen 1985). Doses ranged between 5 mg and 25 mg per week. In Andersen 1985 0.2 ml to 1 ml of normal saline was used as placebo. In the remaining trials matching placebo was used with no proper mention about the type of placebo.
Duration: the duration of the trials ranged between 12 and 52 weeks. In Andersen 1985 patients were evaluated every 3 weeks beginning at 5 weeks and then at 8 weeks and 11 weeks. Cross‐over occurred at 14 weeks followed by evaluation at 18, 21, 24 and 27 weeks. In Furst 1989 patients entered in a 12‐day in‐patient period and, after randomisation efficacy assessment, were assessed every 4 weeks at 2, 6, 10, 14 and 18 weeks. In Jiang 1998 patients were followed for 12 weeks. Pinheiro 1993 evaluated patients at 12 weeks. In Strand 1999 (ULTRA) patients were followed every 12 weeks for a 12 months period. In Weinblatt 1985 cross‐over occurred at 12 weeks and patients were evaluated at 12 weeks and 24 weeks. In Williams 1985 patients were followed at 6, 12 and 18 weeks after initial evaluation at entry into the study.
Outcomes: generally the trials included most of the OMERACT outcome measures. Reported efficacy outcomes included swollen and tender joint count, swollen and tender joint index, physician global assessment of disease activity, walking time, grip strength, ESR and CRP. Most studies were conducted between 1985 and 1993, before any definitions of improvement were published, thus only one study published in 1999 reported data on the percent of people improving using the ACR core set (Strand 1999 (ULTRA)). Patient‐reported outcomes included pain, patient global assessment, morning stiffness, health‐related quality of life, and functional status measured by ADL, modified HAQ and HAQ disability index. Table 4 depicts the scales used for each type of outcome measure. Radiographic evidence of joint damage was assessed only in Strand 1999 (ULTRA) (Total Sharp score, erosion score, joint space narrowing and radiographic progression defined as an increase in erosion scores of > 3 units). All studies reported adverse events, but Jiang 1998 did not report number of events for the placebo group.
3. Scales used for measuring different outcomes across different studies.
| Outcomes | Andersen 1985 | Pinheiro 1993 | Furst 1989 | Jiang 1998 | Strand 1999 (ULTRA) | Weinblatt 1985 | Williams 1985 |
| Tender Joint Count | ‐ | ‐ | ‐ | NR | 28 | 68 | 60 |
| Tender Joint Index | 0.5+=trace 1+=mild pain 2+= moderate pain 3+=severe pain |
Ritchie articular index: 0=normal 1=mild 2=moderate 3=severe |
Modified Ritchie tender joint index, with a maximum tenderness joint count of 207. Tenderness was scaled from 0=no pain to 3+ =severe pain | NR | ‐ | 0=no pain, 1=mild pain, 2=moderate pain, 3=severe pain |
0=none 1=positive response on questioning 2=spontaneous response on questioning 3=withdrawal by patient on examination |
| Swollen Joint Count | ‐ | ‐ | ‐ | NR | 28 | 66 | 58 |
| Swollen Joint Index | 0.5+= trace 1+= mild swelling 2+= moderate swelling 3+= severe swelling |
Ritchie articular index: 0=normal 1=mild 2=moderate 3=severe |
Modified Ritchie index but not measuring hips and neck for swelling with a maximum count of 198. Swelling was scaled from 0=no swelling to 3+=severe swelling | NR | ‐ | 0=no swelling, 1=mild swelling, 2=moderate swelling, 3=severe swelling |
0=none 1=detectable synovial thickening with loss of bony contours 2=loss of distinctness of bony contours 3=bulging synovial proliferation with cystic characteristics |
| Physician global assessment | 0= no change 1=minimal improvement 2= moderate improvement 3=marked improvement 4= remission |
‐ | 100mm horizontal VAS | At least 30% improvement (scale graded from "no effect" to "significantly better") | 10cm horizontal VAS | 0=asymptomatic 1=mild 2=moderate 3=severe |
1=asymptomatic 2=mild 3=moderate 4=severe 5=very severe |
| Walking time | 50ft walking time in seconds | 15 meters in seconds | 75ft walking time in seconds | ‐ | ‐ | 50ft walking time in seconds | 50ft walking time in seconds |
| ESR | mm/hr | mm/hr | mm/hr | mm/hr | mm/hr | ‐ | |
| CRP | ‐ | ‐ | NR | mg/dL | ‐ | ‐ | |
| Pain | 10cm horizontal VAS | 10cm VAS | 100mm horizontal VAS | ‐ | 10cm horizontal VAS | None mentioned | VAS pain rating scale |
| Patient global assessment | 10cm horizontal VAS with 0=worst and 10=normal | ‐ | 100mm horizontal VAS | Graded from "no effect" to "significantly better". Improvement was defined by at least 1/3 increment | 10cm horizontal VAS | 0‐asymptomatic 1=mild 2=moderate 3=severe 4=very severe |
1=asymptomatic 2=mild 3=moderate 4=severe 5=very severe |
| Work productivity | ‐ | ‐ | ‐ | ‐ | Difficulty with work related activities due to health problems and health concerns on a 6‐point scale with 1=none to 6=not done, can't do it. | ‐ | ‐ |
| Morning stiffness | Minutes | Minutes | Minutes | ‐ | ‐ | Minutes | Minutes |
| Hand grip strength | mmHg | mmHg | mmHg | kPa | ‐ | mmHg | mmHg |
| Activities of daily living (ADL) | ‐ | ‐ | Patient's ability to complete 18 activities of daily living on a scale of 1‐10 (maximum score=180) | ‐ | ‐ | ‐ | ‐ |
| HAQ disability index | ‐ | ‐ | ‐ | 20 questions (8 functional categories of 2 or 3 questions) Activities performed on a daily basis Responses: 0=without difficulty to 3=unable to do Scores are summed (0‐24) and divided by the number of categories scored Disability index ranges from 0 to 3 Higher scores = more disability |
‐ | ‐ | |
| MHAQ | ‐ | ‐ | ‐ | ‐ | 8 questions about functional activities performed on a daily basis Responses: 0=without difficulty to 3=unable to do |
‐ | ‐ |
| SF‐36 Physical component and mental component | ‐ | ‐ | ‐ | ‐ | 8 scales: physical functioning, role‐physical, bodily pain, general health, vitality, social functioning, role emotional and mental health Higher values indicate better quality of life Scores are transformed to a 0‐100 scale Scales are combined into summary physical and mental component scores |
‐ | ‐ |
| Erosion score | ‐ | ‐ | ‐ | ‐ | 34 joints in the hands and 12 in the feet The scale for erosions ranged from 0 to 5 0 for normal joints and increasing grades for progressively more involvement1 |
‐ | ‐ |
| Joint space narrowing | ‐ | ‐ | ‐ | ‐ | 36 joints in the hand and 12 in the feet Scale of 0‐4 0=normal, 1=asymmetric or minimal narrowing <11%, 2=11‐50%, 3=51‐99% and 4=complete loss of joint space and presumptive ankylosis |
‐ | ‐ |
| Total Sharp score | ‐ | ‐ | ‐ | ‐ | Erosion + joint space narrowing scores Maximum possible total score of 422 | ‐ | ‐ |
NR= Not reported
1"Progression from one grade to the next was scored when a discrete new erosion appeared in a previously uninvolved quadrant of the joint or carpal bone or when a preexisting erosion increased sufficiently in size to be judged greater than what could have occurred because of artifacts caused by changes in position or differences in radiation exposure or film development
Excluded studies
Three studies were excluded in the original review (Cannon 1990; Szanto 1986; Thompson 1984). For this update an additional 3 studies were excluded (Weinblatt 1998, Cohen 2001, and Jones 2010 (AMBITION)). Reasons for exclusion for each study are provided in the Characteristics of excluded studies section.
Risk of bias in included studies
The judgements about each risk of bias item presented as percentages across all included studies are shown in Figure 2. The risk of bias summary indicating the judgements about each risk of bias item for each included study is presented in Figure 3. The trials were generally of moderate to low risk of bias.
2.
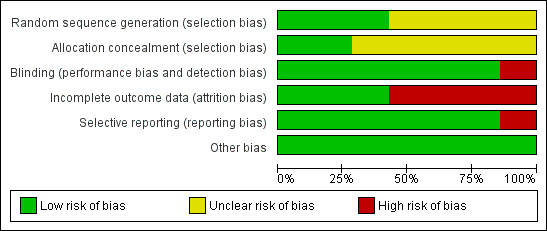
Risk of bias graph: review authors' judgements about each risk of bias item presented as percentages across all included studies.
3.
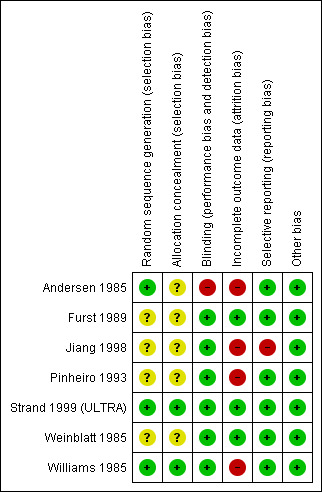
Risk of bias summary: review authors' judgements about each risk of bias item for each included study.
Allocation
Four studies did not provide details regarding the methods to generate the random sequence and conceal the allocation, and therefore were judged to have unclear risk of bias (Furst 1989; Jiang 1998; Pinheiro 1993; Weinblatt 1985). Andersen 1985 used random assignment with random number tables and was considered to have low risk of bias, but not details were provided to evaluate concealment of allocation. Strand 1999 (ULTRA) employed a computerised adaptive algorithm and was judged to have low risk of bias for both sequence generation and allocation concealment. Williams 1985 reported generation of random sequence by a coordinating centre and the allocation was kept by the same centre under a contract.
Blinding
All studies were double‐blinded, placebo‐controlled. Andersen 1985, even though a double‐blinded, placebo controlled study, is at high risk of bias because during the study one patient developed pancytopenia while receiving methotrexate which required breaking the code during the first arm of the protocol.
Incomplete outcome data
Three studies were judged to have low risk of bias due to low discontinuation rates and analyses based on an intention‐to‐treat population (Furst 1989; Strand 1999 (ULTRA); Weinblatt 1985). Four studies were judged to have high risk of bias where analyses were done in a completers population or no information was provided on withdrawals (Andersen 1985; Jiang 1998; Pinheiro 1993; Williams 1985).
Selective reporting
Furst 1989; Strand 1999 (ULTRA); Weinblatt 1985; Williams 1985 were considered to be at low risk of bias as they have reported all outcomes including adverse events. Andersen 1985 was at high risk of bias as adverse events were not reported in the study.
Other potential sources of bias
All the studies were randomized and groups were judged to be balanced at baseline. Five studies reported they were funded by non‐pharmaceutical sources (Table 2). For two studies, the source of funding was not reported (Jiang 1998; Pinheiro 1993).
Effects of interventions
See: Table 1
Efficacy
ACR response: only one study measured the ACR 20 response improvement at 52 weeks (Strand 1999 (ULTRA)). Patients in the methotrexate group were 1.8 times more likely to improve at least 20% compared to the patients in the placebo group (RR 1.8, 95% CI 1.3 to 2.5) (Analysis 1.1). For ACR 50, patients in the methotrexate group were more likely to have 50% improvement in their symptoms when compared to those in the placebo group (RR 3.0, 95% CI 1.5 to 6.0; absolute treatment benefit (ATB) 15%, 95% CI 8% to 23%) (Analysis 1.2; Table 1). That is, in the methotrexate group 23 people out of 100 had an improvement in their symptoms of at least 50% over 52 weeks, compared to only 8 out of 100 in the placebo group. The NNT was 7 (95% CI 22 to 4). No statistically significant differences were observed between groups for ACR 70 at 52 weeks (Analysis 1.3).
1.1. Analysis.

Comparison 1 Efficacy, Outcome 1 ACR 20.
1.3. Analysis.

Comparison 1 Efficacy, Outcome 3 ACR 70.
Remission: Williams 1985 categorized patients to be in therapeutic remission if they had at least 5 of (≥ 2 months): morning stiffness of < 15 minutes, no fatigue, no joint pain by history, no joint tenderness, no joint swelling, and Westergren ESR of < 20 mm/hr in men and < 30 mm/hr in women. No patient in either group achieved therapeutic remission (Analysis 1.4).
1.4. Analysis.

Comparison 1 Efficacy, Outcome 4 Disease Remission.
Tender and swollen joint counts: four studies assessed the number of tender and swollen joints at 12 to 52 weeks (Jiang 1998; Strand 1999 (ULTRA); Weinblatt 1985; Williams 1985). The pooled SMD was ‐0.65 (95% CI ‐0.91 to ‐0.38) (Analysis 1.5). We used Strand 1999 (ULTRA) data to back‐translate the effect estimate, where the standard deviation of the placebo group at baseline was 6.3. Therefore, on a 28‐joint count people who took methotrexate alone had a further reduction of 4 less tender joints compared with people who took placebo (95% CI 5 to 2). In addition, patients taking methotrexate were more likely to reduce at least by 50% the number of tender joints count when compared to patients taking placebo at 18 weeks (RR 4.2, 95% CI 1.1 to 16.7) (Analysis 1.6).
1.5. Analysis.
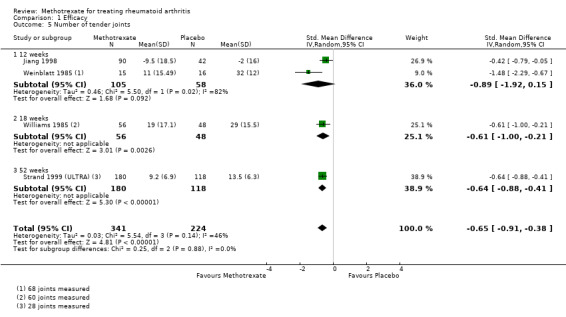
Comparison 1 Efficacy, Outcome 5 Number of tender joints.
1.6. Analysis.

Comparison 1 Efficacy, Outcome 6 >50% improvement in TJC.
The pooled SMD for the swollen joint counts was ‐0.58 (95% CI ‐0.75 to ‐0.41) (Analysis 1.7). The standard deviation for the placebo group at baseline that was used to back‐translate the effect estimate was 6.2 (Strand 1999 (ULTRA)). Therefore, on a 28‐joint count people who took methotrexate alone had a further reduction of 3 less swollen joints compared with people who took placebo (95% CI 4 to 2). No statistically significant differences were observed in the rates of patients achieving at least 50% reduction in the number of swollen joints (Analysis 1.8).
1.7. Analysis.
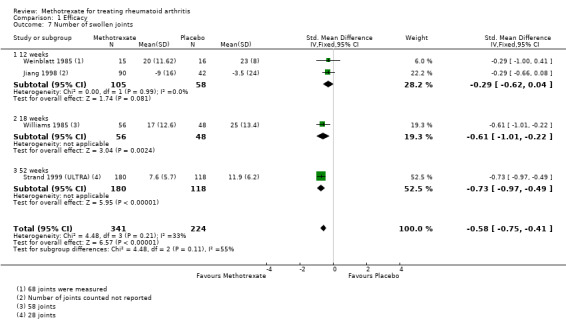
Comparison 1 Efficacy, Outcome 7 Number of swollen joints.
1.8. Analysis.

Comparison 1 Efficacy, Outcome 8 >50% improvement in SJC.
Tender and swollen joint indexes: five studies measured joint tenderness and pain index over a time period of 12 to 18 weeks (Furst 1989; Jiang 1998; Pinheiro 1993; Weinblatt 1985; Williams 1985). The pooled SMD was ‐0.73 (95% CI ‐1.1 to ‐0.34) (Analysis 1.9). The standard deviation for the placebo group at baseline that was used to back‐translate the effect estimate was 31.0 (Williams 1985). Therefore, on a 58‐joint count people who took methotrexate alone had a further reduction of 22 units in their tender joint score compared with people who took placebo (95% CI 34 to 10). Also, patients receiving methotrexate were more likely to achieve at least 30% reduction in joint tenderness and pain index when compared to patients receiving placebo at 12 to 18 weeks (RR 4.3, 95% CI 1.6 to 11.9) (Analysis 1.10).
1.9. Analysis.
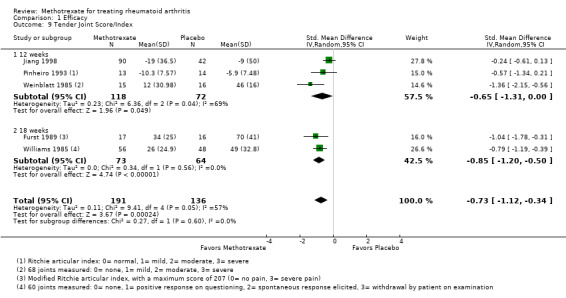
Comparison 1 Efficacy, Outcome 9 Tender Joint Score/Index.
1.10. Analysis.
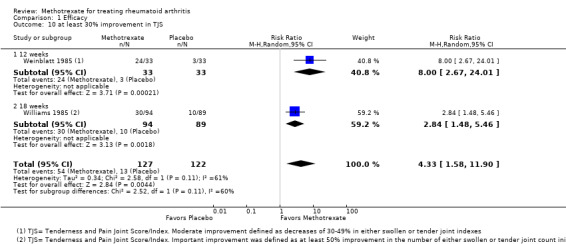
Comparison 1 Efficacy, Outcome 10 at least 30% improvement in TJS.
Regarding the swollen joint index, one of the studies provided only one value (per group) for the Ritchie articular index (Pinheiro 1993). The same values were entered for Analysis 1.9 and Analysis 1.11. The pooled SMD was ‐0.48 (95% CI ‐0.70 to ‐0.25) (Analysis 1.11). The standard deviation for the placebo group at baseline that was used to back‐translate the effect estimate was 24.7 (Williams 1985). Therefore, on a 58‐joint count people who took methotrexate alone had a further reduction of 11 units in their swollen joint score compared with people who took placebo (95% CI 17 to 6). Also, patients receiving methotrexate were more likely to achieve at least 30% reduction in joint swelling score when compared to patients receiving placebo (RR 4.9, 95% CI 2.4 to 9.9) (Analysis 1.12).
1.11. Analysis.
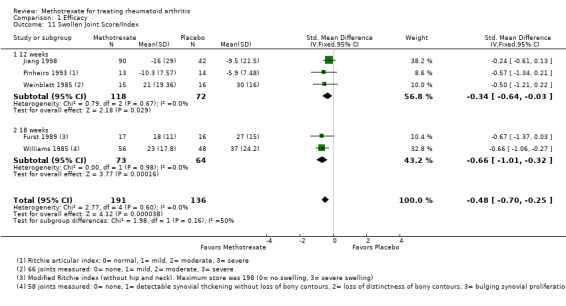
Comparison 1 Efficacy, Outcome 11 Swollen Joint Score/Index.
1.12. Analysis.
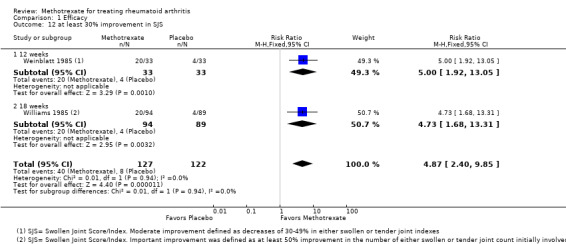
Comparison 1 Efficacy, Outcome 12 at least 30% improvement in SJS.
Physician global assessment of disease activity: four studies measured this outcome at 12 to 52 weeks (Furst 1989; Strand 1999 (ULTRA); Weinblatt 1985; Williams 1985). The pooled SMD was ‐1.1 (95% CI ‐1.5 to ‐0.74) (Analysis 1.13). The standard deviation for the placebo group at baseline that was used to back‐translate the effect estimate was 1.6 (Strand 1999 (ULTRA)). Therefore, on a 0 to 10 scale physicians assessing the methotrexate‐treated group rated a further reduction of 1.8 units in the patients' disease activity compared with the placebo group (95% CI 2.4 to 1.2). No statistically significant differences were observed between groups in the per cent of patients improving the physician global assessment of disease activity by at least by 50% (Analysis 1.14).
1.13. Analysis.
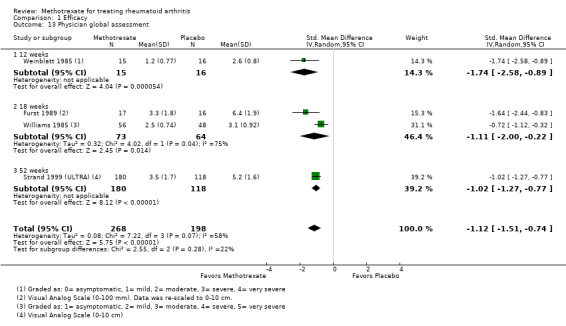
Comparison 1 Efficacy, Outcome 13 Physician global assessment.
1.14. Analysis.
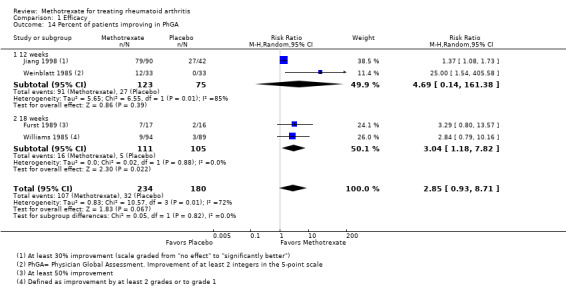
Comparison 1 Efficacy, Outcome 14 Percent of patients improving in PhGA.
Walking time: four studies measured walking time in seconds at 12 to 18 weeks (Furst 1989; Pinheiro 1993; Weinblatt 1985; Williams 1985). The pooled SMD was ‐0.43 (95% CI ‐0.85 to ‐0.01) (Analysis 1.15). No statistically significant differences were observed in the proportion of patients improving at least by 50% in walking time (Analysis 1.16).
1.15. Analysis.
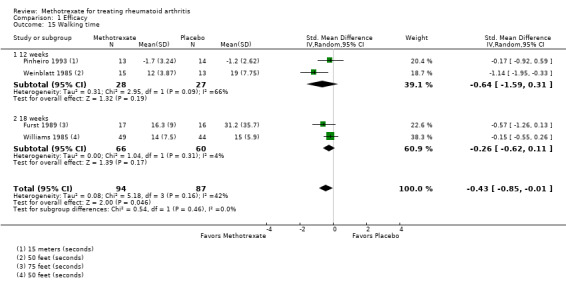
Comparison 1 Efficacy, Outcome 15 Walking time.
1.16. Analysis.

Comparison 1 Efficacy, Outcome 16 >50% improvement in walking time.
Grip strength: four studies measured this outcome. No statistically significant differences were found between groups (Analysis 1.17).
1.17. Analysis.
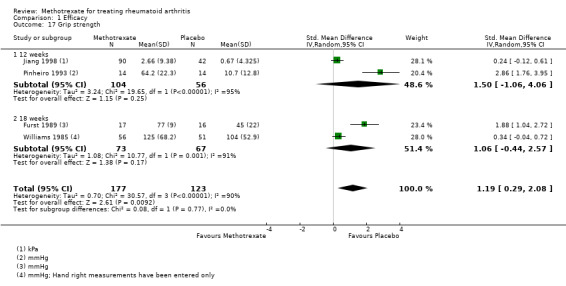
Comparison 1 Efficacy, Outcome 17 Grip strength.
Acute phase reactants: four studies measured ESR at 12 to 52 weeks (Furst 1989; Pinheiro 1993; Strand 1999 (ULTRA); Weinblatt 1985). Patients who received methotrexate lowered their ESR levels by 8.7 units compared to patients who received placebo (95% CI ‐13.9 to ‐3.5) (Analysis 1.18). No statistically significant differences were found for CRP (Analysis 1.19).
1.18. Analysis.
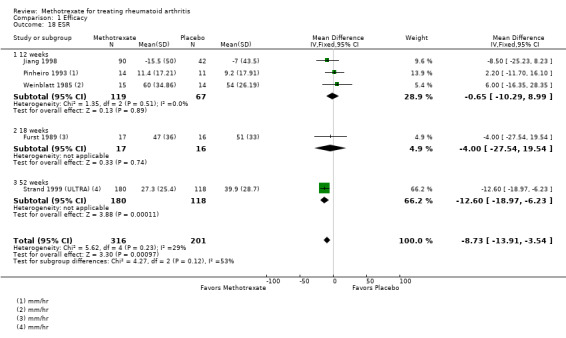
Comparison 1 Efficacy, Outcome 18 ESR.
1.19. Analysis.
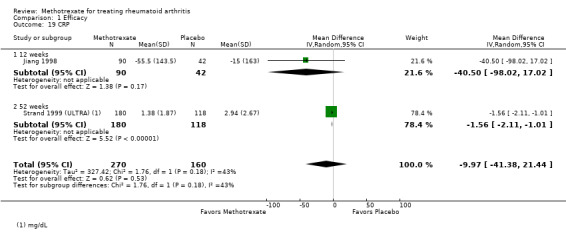
Comparison 1 Efficacy, Outcome 19 CRP.
Patient‐reported outcomes
Functional status: two studies reported data on HAQ disability index at 12 to 52 weeks (Pinheiro 1993; Strand 1999 (ULTRA)). People who took methotrexate rated the change in their disability to be 0.27 points lower on a scale of 0 to 3 compared with people who took placebo (95% CI ‐0.39 to ‐0.16) (Analysis 2.1; Table 1). The ATB was ‐9% (95% CI ‐13% to ‐5.3%) and NNT 4 (95% CI 3 to 7). Also, patients on methotrexate were more likely to report improvement of at least 20% or 50% in their HAQ disability index compared to patients on placebo (49% versus 27%; RR 1.8, 95% CI 1.3 to 2.6) and (30% versus 14%; RR 2.2, 95% CI 1.3 to 3.7), respectively (information from single trial: Strand 1999 (ULTRA)) (Analysis 2.2).
2.2. Analysis.
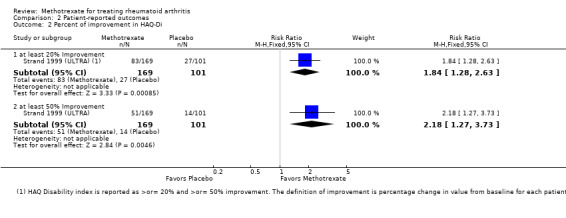
Comparison 2 Patient‐reported outcomes, Outcome 2 Percent of improvement in HAQ‐Di.
The modified HAQ was used in Strand 1999 (ULTRA). Patients receiving methotrexate rated the change in their disability to be 0.40 points lower on a scale of 0 to 3 after 52 weeks compared with patients receiving placebo (95% CI ‐0.52 to ‐0.28) (Analysis 2.3). In addition, patients on methotrexate were more likely to report improvement of at least 20% or 50% in their modified HAQ when compared to patients taking placebo (RR 1.7, 95% CI 1.4 to 2.2) (Analysis 2.4).
2.3. Analysis.

Comparison 2 Patient‐reported outcomes, Outcome 3 MHAQ.
2.4. Analysis.
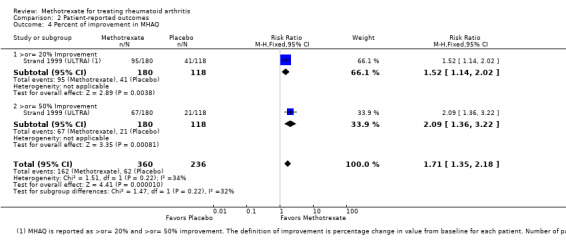
Comparison 2 Patient‐reported outcomes, Outcome 4 Percent of improvement in MHAQ.
The ADL score was used in Furst 1989. Patients receiving methotrexate rated the change in their disability to be 50 points lower on a scale of 0 to 180 after 18 weeks compared with patients receiving placebo (95% CI ‐67.8 to ‐32.2) (Analysis 2.5). No statistically significant differences were observed between groups in the rate of patients achieving a 50% improvement in ADL scores (Analysis 2.6).
2.5. Analysis.

Comparison 2 Patient‐reported outcomes, Outcome 5 Activities of Daily Living (ADL).
2.6. Analysis.

Comparison 2 Patient‐reported outcomes, Outcome 6 Activities of Daily Living (ADL).
Health‐related quality of life: quality of life was measured using the SF‐36 by one single trial (Strand 1999 (ULTRA)) at 52 weeks. Patients who were taking methotrexate were more likely to report an improvement of at least 20% or 50% in the SF‐36 physical component when compared to patients taking placebo (39% versus 17%; RR 1.5, 95% CI 1.0 to 2.1) and (23% versus 5%; RR 2.2, 95% CI 1.3 to 3.7), respectively (Analysis 2.7; Table 1). However, no statistically significant differences were observed between groups for the SF‐36 mental component (Analysis 2.8; Table 1).
Pain: four studies measured patient self‐reported pain at 12 to 52 weeks (Furst 1989; Pinheiro 1993; Strand 1999 (ULTRA); Williams 1985). People who took methotrexate rated their pain to be 2 points lower on a scale of 0 to 10 after 12 to 52 weeks with methotrexate compared with placebo (95% CI ‐2.4 to ‐1.6) (Analysis 2.9). No statistically significant differences were found in the rates of patients decreasing their pain by at least 50% between groups (information from single trial: Furst 1989) (Analysis 2.10). No studies reported data on improvement of at least 20% in pain.
2.9. Analysis.
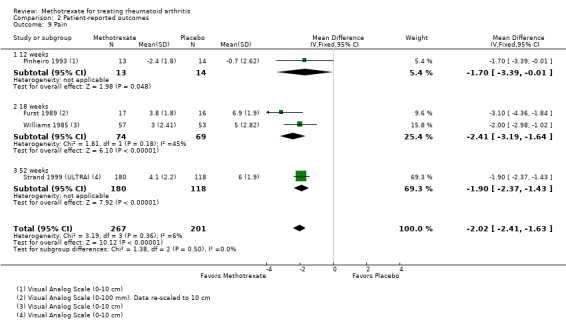
Comparison 2 Patient‐reported outcomes, Outcome 9 Pain.
2.10. Analysis.

Comparison 2 Patient‐reported outcomes, Outcome 10 Pain.
Patient global assessment of disease activity: four studies reported data for this outcome at 12 to 18 weeks (Furst 1989; Strand 1999 (ULTRA); Weinblatt 1985; Williams 1985). The pooled SMD was ‐1.2 (95% CI ‐1.6 to ‐0.68) (Analysis 2.11). The standard deviation for the placebo group at baseline that was used to back‐translate the effect estimate was 2.2 (Strand 1999 (ULTRA)). Therefore, on a 0 to 10 scale people who took methotrexate alone had a further reduction of 2.6 units in their global assessment of disease activity compared with people who took placebo (95% CI 3.6 to 1.5). No statistically significant differences were observed between groups in the per cent of patients improving in the patient global assessment of disease activity as defined by the authors (Analysis 2.12).
2.11. Analysis.
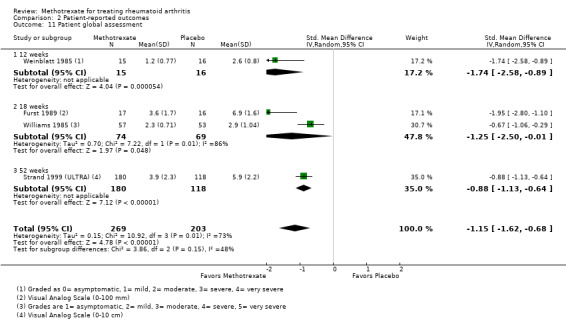
Comparison 2 Patient‐reported outcomes, Outcome 11 Patient global assessment.
2.12. Analysis.
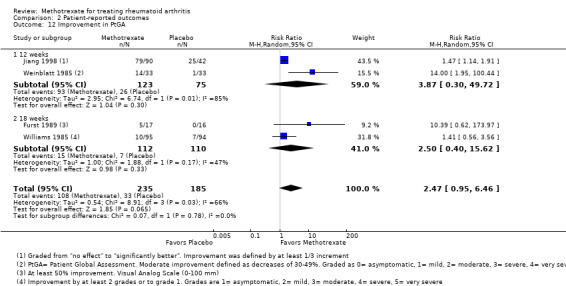
Comparison 2 Patient‐reported outcomes, Outcome 12 Improvement in PtGA.
Morning stiffness: four studies measured duration of morning stiffness in their study participants over a time period of 12 to 18 weeks (Furst 1989; Pinheiro 1993; Weinblatt 1985; Williams 1985). No statistically significant differences were observed between groups (Analysis 2.13; Analysis 2.14).
2.13. Analysis.

Comparison 2 Patient‐reported outcomes, Outcome 13 Morning stiffness.
2.14. Analysis.
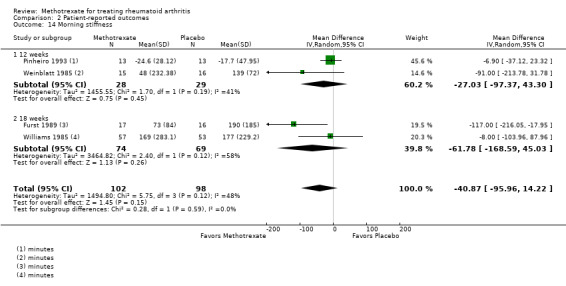
Comparison 2 Patient‐reported outcomes, Outcome 14 Morning stiffness.
Work productivity: one trial reported on work productivity (Strand 1999 (ULTRA)). Patients taking methotrexate were more likely to report at least 20% or 50% improvement in their work productivity when compared to patients taking placebo (RR 1.9, 95% CI 1.2 to 3.1 and RR 2.4, 95% CI 1.2 to 4.7, respectively). That is, only 20 people out 100 in the methotrexate group reported at least 20% improvement in their work productivity compared to 38 people out of 100 in the placebo group. Only 10 people out 100 in the methotrexate group reported at least 50% of improvement in their work productivity compared to 23 people out of 100 in the placebo group (Analysis 2.15).
2.15. Analysis.
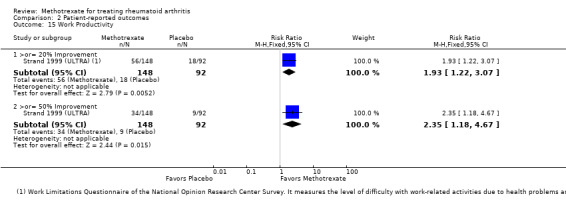
Comparison 2 Patient‐reported outcomes, Outcome 15 Work Productivity.
Structural damage
Radiographic progression: one trial reported Sharp radiographic scores (Strand 1999 (ULTRA)). Patients receiving methotrexate were less likely to have an increase in Sharp erosion scores of more than three units when compared to patients taking placebo (RR 0.31, 95% CI 0.11 to 0.86) (Analysis 3.1). Only 4 people out 100 in the methotrexate group had radiographic progression compared to 12 people out of 100 in the placebo group (ATB ‐8%, 95% CI ‐16% to ‐1%) (Table 1).
Total Sharp score, erosion score and joint space narrowing: only one study reported data on these outcomes (Strand 1999 (ULTRA)). No statistically significant differences were observed between groups at 52 weeks (Analysis 3.2; Analysis 3.3; Analysis 3.4).
3.2. Analysis.

Comparison 3 Radiographic outcomes, Outcome 2 Total Sharp Score.
3.3. Analysis.

Comparison 3 Radiographic outcomes, Outcome 3 Erosion Score.
3.4. Analysis.

Comparison 3 Radiographic outcomes, Outcome 4 Joint Space Narrowing.
New joint erosions: the proportion of patients with new joint erosions at 52 weeks were similar between groups (Analysis 3.5).
3.5. Analysis.
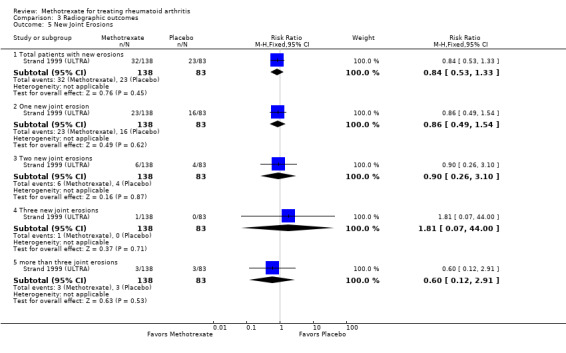
Comparison 3 Radiographic outcomes, Outcome 5 New Joint Erosions.
Discontinuations
Total number of discontinuations: patients in the methotrexate group were statistically significantly less likely to withdraw for any reason compared with the placebo group (RR 0.73, 95% CI 0.62 to 0.88) (Analysis 4.1).
4.1. Analysis.
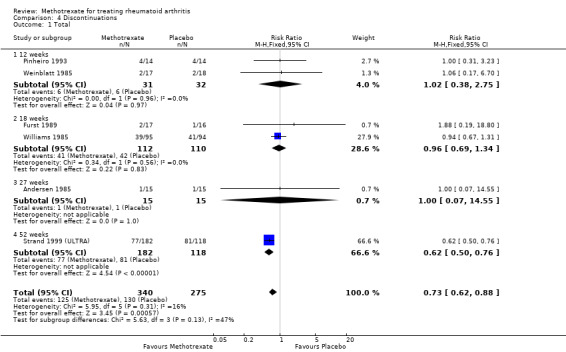
Comparison 4 Discontinuations, Outcome 1 Total.
Due to lack of efficacy and other reasons: similar rates of discontinuations due to lack of efficacy and other reasons including losses to follow‐up, non‐compliance, protocol violation, and voluntary or unclear reasons were observed between groups (Analysis 4.2; Analysis 4.4; Analysis 4.5; Analysis 4.6; Analysis 4.7).
4.2. Analysis.
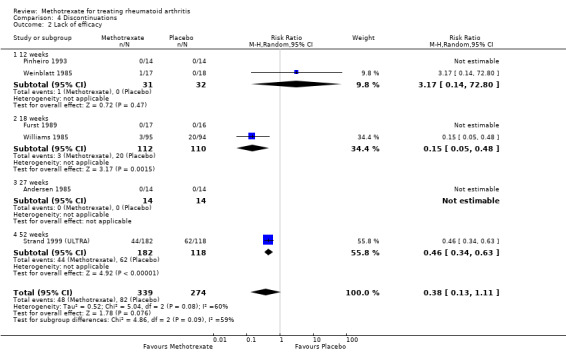
Comparison 4 Discontinuations, Outcome 2 Lack of efficacy.
4.4. Analysis.
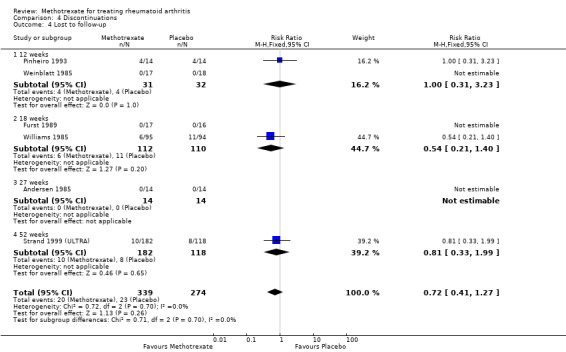
Comparison 4 Discontinuations, Outcome 4 Lost to follow‐up.
4.5. Analysis.
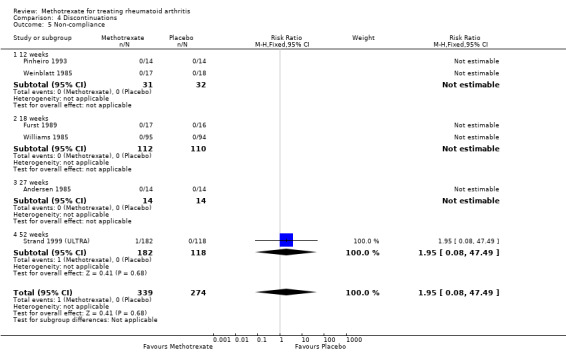
Comparison 4 Discontinuations, Outcome 5 Non‐compliance.
4.6. Analysis.
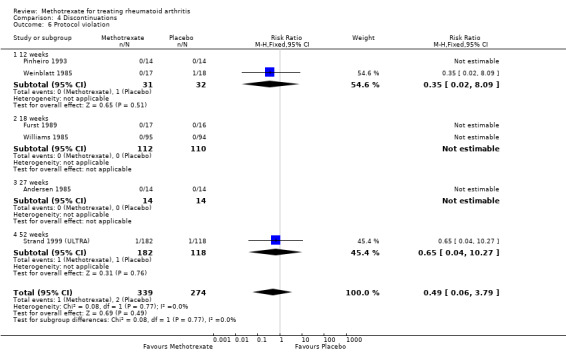
Comparison 4 Discontinuations, Outcome 6 Protocol violation.
4.7. Analysis.
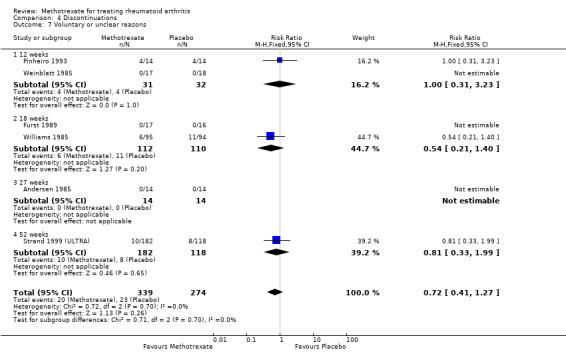
Comparison 4 Discontinuations, Outcome 7 Voluntary or unclear reasons.
Due to adverse events: patients treated with methotrexate were statistically significantly more likely to discontinue treatment and withdraw from the study due to adverse events compared to patients treated with placebo (RR 2.1, 95% CI 1.3 to 3.3) (Analysis 4.3). In the methotrexate group 16 patients out of 100 withdrew due to adverse events over 52 weeks, compared to 8 people out of 100 in the placebo group (95% CI 10 to 25) (ATB 9%, 95% CI 3% to 14%) (Table 1). Furthermore, patients in the methotrexate group were more likely to discontinue treatment because of liver enzyme abnormalities compared to patients in the placebo group at 12 to 52 weeks (8% versus 2%; RR 3.8, 95% CI 1.6 to 8.8) (Analysis 4.14). Rates of withdrawals due to other adverse events including alopecia, gastrointestinal events, hematological events, hypertension, infection, interstitial pneumonitis, mucocutaneous events, myocardial infarction and rash were similar between groups (Analysis 4.8; Analysis 4.9; Analysis 4.10; Analysis 4.11; Analysis 4.12; Analysis 4.13; Analysis 4.15; Analysis 4.16; Analysis 4.17).
4.14. Analysis.
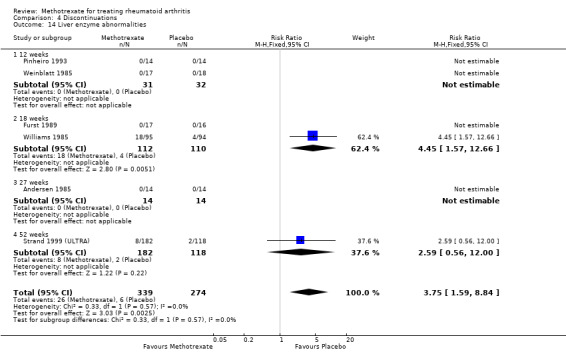
Comparison 4 Discontinuations, Outcome 14 Liver enzyme abnormalities.
4.8. Analysis.
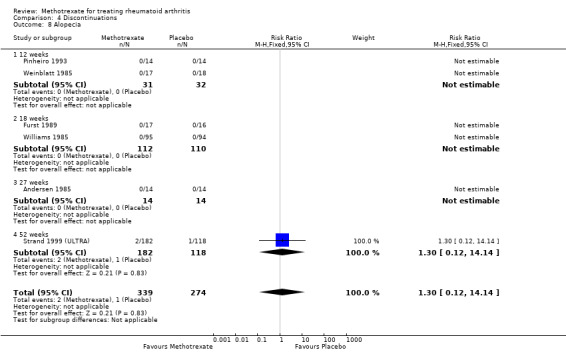
Comparison 4 Discontinuations, Outcome 8 Alopecia.
4.9. Analysis.
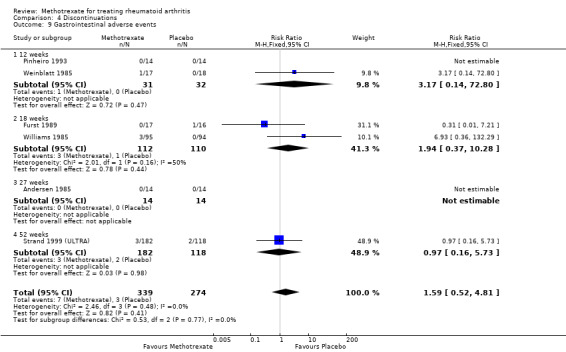
Comparison 4 Discontinuations, Outcome 9 Gastrointestinal adverse events.
4.10. Analysis.
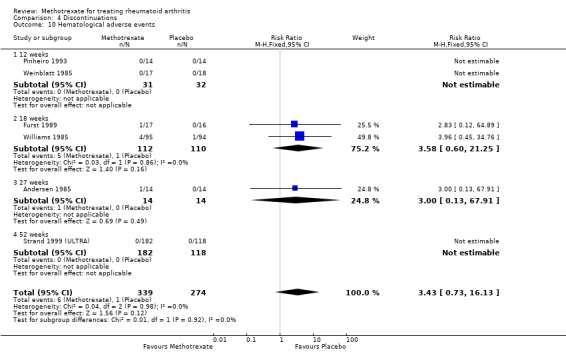
Comparison 4 Discontinuations, Outcome 10 Hematological adverse events.
4.11. Analysis.
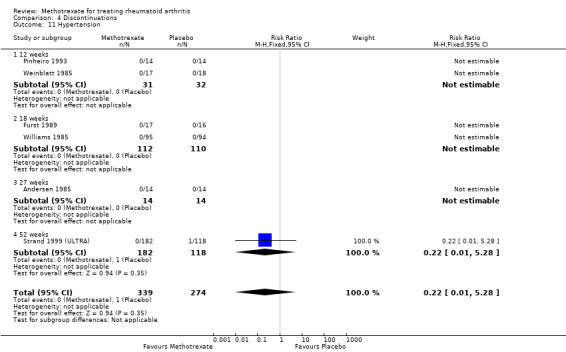
Comparison 4 Discontinuations, Outcome 11 Hypertension.
4.12. Analysis.
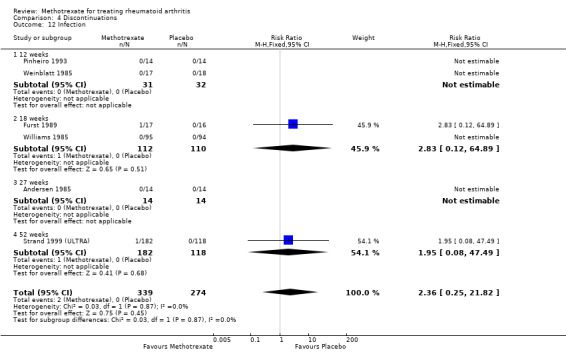
Comparison 4 Discontinuations, Outcome 12 Infection.
4.13. Analysis.
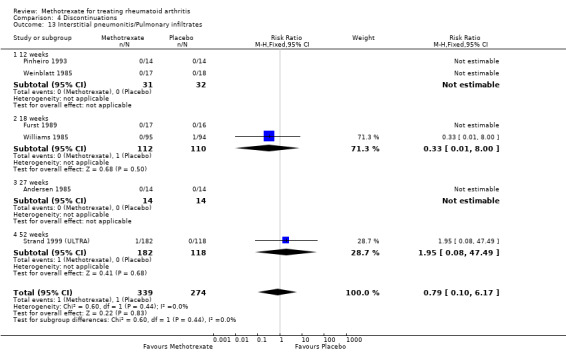
Comparison 4 Discontinuations, Outcome 13 Interstitial pneumonitis/Pulmonary infiltrates.
4.15. Analysis.
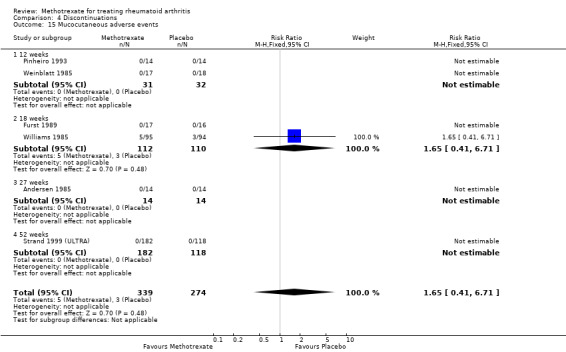
Comparison 4 Discontinuations, Outcome 15 Mucocutaneous adverse events.
4.16. Analysis.
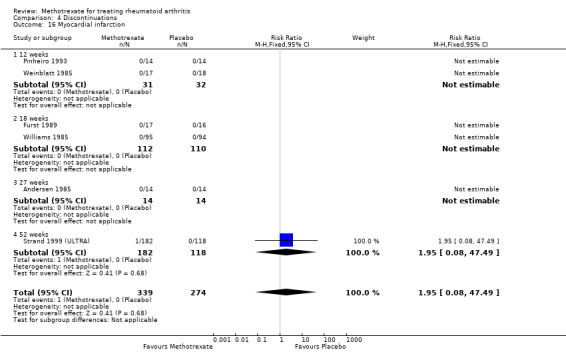
Comparison 4 Discontinuations, Outcome 16 Myocardial infarction.
4.17. Analysis.
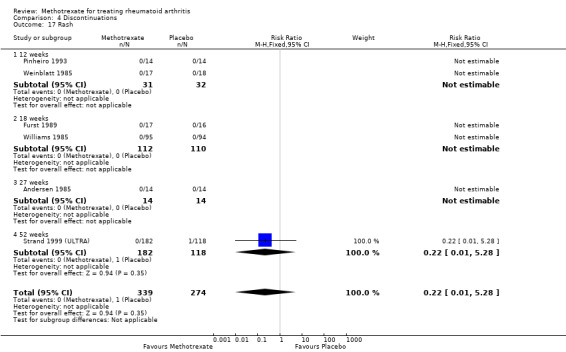
Comparison 4 Discontinuations, Outcome 17 Rash.
Toxicity
Total adverse events: patients in the methotrexate group were more likely to have any type of adverse event compared with the placebo group (RR 3.0, 95% CI 1.4 to 6.4). In the placebo group 15 people out of 100 had adverse events over 12 to 18 weeks, compared to 45 (95% CI 21 to 95) out of 100 for the methotrexate group (Analysis 5.1).
5.1. Analysis.

Comparison 5 Adverse events, Outcome 1 Total.
Serious adverse events: only 2% to 3% of the patients withdrew from the studies at 27 to 52 weeks due to serious adverse events (2% placebo, 3% methotrexate). There was only one study with one death reported in the methotrexate group caused by sepsis, but it was not clear if this was attributed to the drug. No statistically significant differences between groups were observed in the proportion of patients with serious adverse events at 27 to 52 weeks (Analysis 5.2; Table 1).
Statistically significant adverse events: patients who received methotrexate were more likely to have an infection when compared to patients who received placebo, at 12 to 52 weeks (49% versus 35%; RR 1.3, 95% CI 1.0 to 1.6) (Analysis 5.18). The most common infections were: upper respiratory infections, bronchitis and pneumonia. Rates of any type of liver enzyme abnormalities were higher in the methotrexate‐treated group compared to the placebo‐treated group at 12 to 52 weeks (15% versus 3%; RR 4.8, 95% CI 2.3 to 10.0) (Analysis 5.19). Stomatitis and oral ulcers at 12 to 18 weeks were more likely to be reported in the methotrexate group compared to the placebo group (9% versus 4%; RR 2.0, 95% CI 1.0 to 4.0) (Analysis 5.28). Also, alopecia and gastrointestinal distress rates were higher in the methotrexate group compared to the placebo group at 12 to 52 weeks (6% versus 1% (Analysis 5.4) and 9% versus 4% (Analysis 5.14), respectively).
5.18. Analysis.
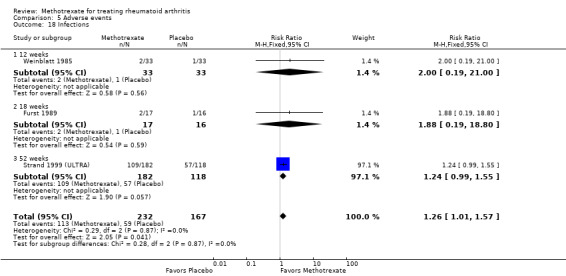
Comparison 5 Adverse events, Outcome 18 Infections.
5.19. Analysis.
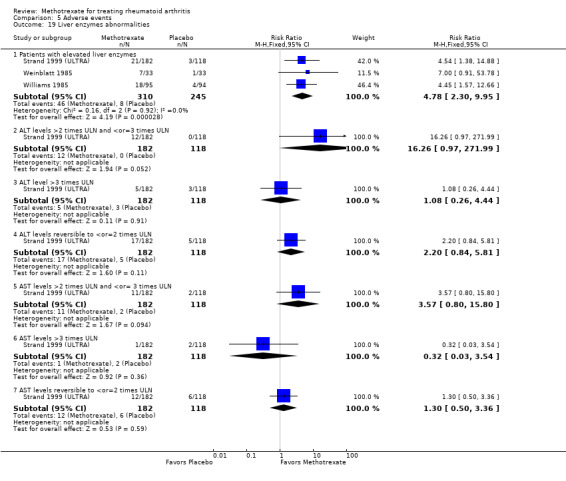
Comparison 5 Adverse events, Outcome 19 Liver enzymes abnormalities.
5.28. Analysis.
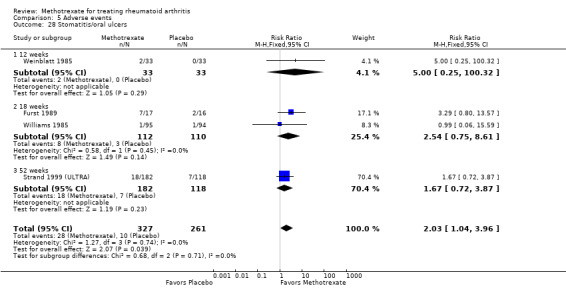
Comparison 5 Adverse events, Outcome 28 Stomatitis/oral ulcers.
5.4. Analysis.
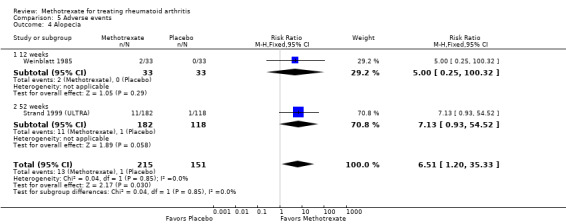
Comparison 5 Adverse events, Outcome 4 Alopecia.
5.14. Analysis.
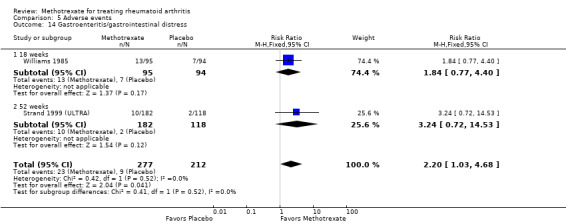
Comparison 5 Adverse events, Outcome 14 Gastroenteritis/gastrointestinal distress.
Other reported adverse events: non‐statistically significant differences in the rates of the following adverse events were observed between groups.
Abdominal pain at 12 to 52 weeks (Analysis 5.3).
Anorexia at 12 weeks (Analysis 5.5).
Allergic reactions at 52 weeks (Analysis 5.6).
Back pain at 12 weeks (Analysis 5.7).
Chest pain at 12 weeks (Analysis 5.8).
Central nervous system (CNS) side effects (nightmares and depression) at 12 to 18 weeks (Analysis 5.9).
Cough at 12 to 18 weeks (Analysis 5.10).
Deaths at 12 weeks (Analysis 5.11).
Diarrhea at 12 to 52 weeks (Analysis 5.12).
Dyspepsia at 18 to 52 weeks (Analysis 5.13).
Headache at 12 weeks (Analysis 5.15).
Hematological adverse events at 18 weeks (Analysis 5.16).
Hypertension at 52 weeks (Analysis 5.17).
Mucosal ulcers at 18 weeks (Analysis 5.20).
Nausea or vomiting, or both, at 12 to 52 weeks (Analysis 5.21).
New onset of hypertension at 52 weeks (Analysis 5.22).
Proteinuria at 12 weeks (Analysis 5.23).
Pruritus at 18 weeks (Analysis 5.24).
Psoriasis at 18 weeks (Analysis 5.25).
Pulmonary infiltrates (interstitial pneumonitis) at 18 weeks (Analysis 5.26).
Rash at 12 to 18 weeks (Analysis 5.27).
Stroke at 12 weeks (Analysis 5.29).
5.3. Analysis.
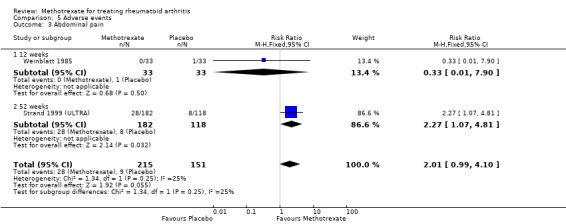
Comparison 5 Adverse events, Outcome 3 Abdominal pain.
5.5. Analysis.

Comparison 5 Adverse events, Outcome 5 Anorexia.
5.6. Analysis.

Comparison 5 Adverse events, Outcome 6 Allergic reactions.
5.7. Analysis.

Comparison 5 Adverse events, Outcome 7 Backpain.
5.8. Analysis.

Comparison 5 Adverse events, Outcome 8 Chest pain.
5.9. Analysis.
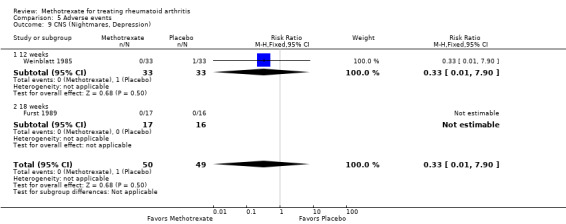
Comparison 5 Adverse events, Outcome 9 CNS (Nightmares, Depression).
5.10. Analysis.
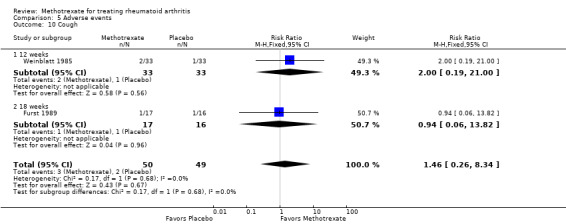
Comparison 5 Adverse events, Outcome 10 Cough.
5.11. Analysis.
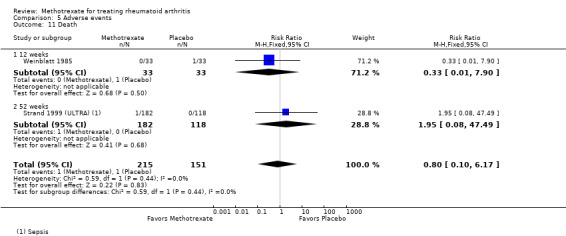
Comparison 5 Adverse events, Outcome 11 Death.
5.12. Analysis.
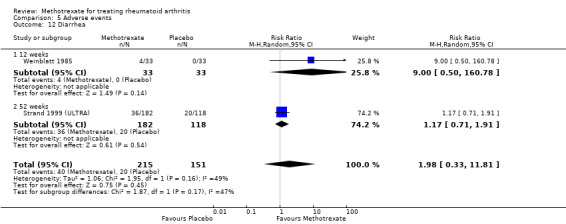
Comparison 5 Adverse events, Outcome 12 Diarrhea.
5.13. Analysis.
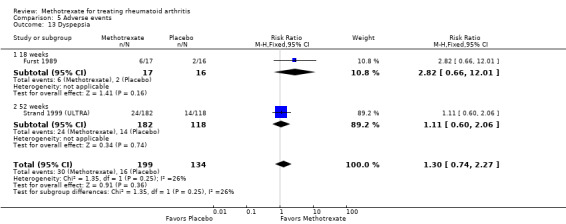
Comparison 5 Adverse events, Outcome 13 Dyspepsia.
5.15. Analysis.
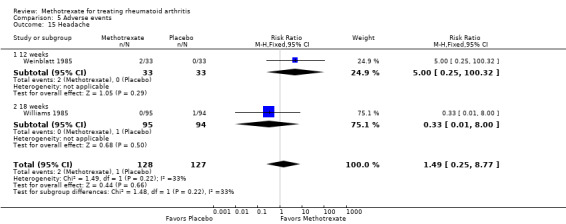
Comparison 5 Adverse events, Outcome 15 Headache.
5.16. Analysis.
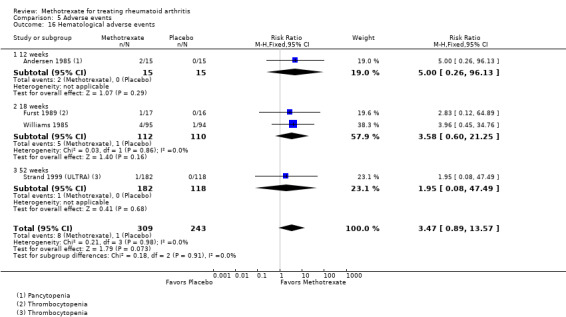
Comparison 5 Adverse events, Outcome 16 Hematological adverse events.
5.17. Analysis.

Comparison 5 Adverse events, Outcome 17 Hypertension.
5.20. Analysis.

Comparison 5 Adverse events, Outcome 20 Mucosal ulcers.
5.21. Analysis.
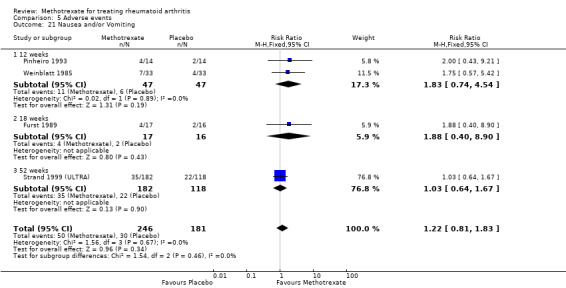
Comparison 5 Adverse events, Outcome 21 Nausea and/or Vomiting.
5.22. Analysis.

Comparison 5 Adverse events, Outcome 22 New onset Hypertension.
5.23. Analysis.

Comparison 5 Adverse events, Outcome 23 Proteinuria.
5.24. Analysis.

Comparison 5 Adverse events, Outcome 24 Pruritus.
5.25. Analysis.

Comparison 5 Adverse events, Outcome 25 Psoriasis.
5.26. Analysis.
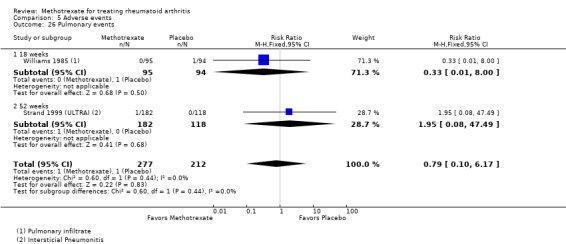
Comparison 5 Adverse events, Outcome 26 Pulmonary events.
5.27. Analysis.
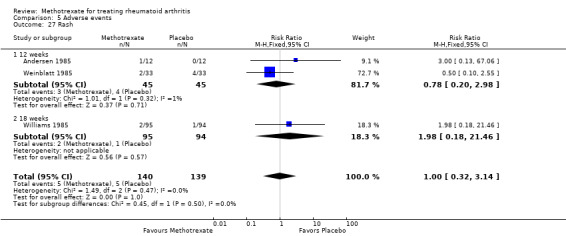
Comparison 5 Adverse events, Outcome 27 Rash.
5.29. Analysis.

Comparison 5 Adverse events, Outcome 29 Stroke.
Discussion
Summary of main results
Methotrexate was initially used for the treatment of RA in 1951 (Gubner 1951). Since then, several open studies, randomized controlled trials (RCTs) and controlled clinical trials (CCTs) have suggested beneficial effects. The purpose of this systematic review was to evaluate the efficacy and toxicity of methotrexate for the treatment of people with RA when compared to placebo. We only included in this review placebo controlled CCTs and RCTs reporting results after a minimum of 12 weeks of treatment. The dosage of methotrexate in these trials ranged from 7.5 to 25 mg per week.
Substantial differences between placebo and methotrexate were observed for measures of disease activity, in favour of methotrexate. These differences were clinically important and statistically significant for various efficacy and patient‐reported outcomes and structural damage measures. The standardized weighted differences between methotrexate and placebo for the various outcome measures varied between ‐0.43 and ‐1.2. These effects can be considered to be substantial. The minimum effect size considered to be clinically meaningful in RA has been estimated at 0.30 (Kazis 1989). The absolute treatment benefit (ATB) to achieve an ACR20 response was 20% and for an ACR50 was 15% with a NNT of 6 and 7, respectively. No statistically significant differences were observed in the overall number of withdrawals and dropouts, but methotrexate participants were statistically significantly more likely to discontinue treatment because of adverse reactions, specifically liver enzyme abnormalities and placebo participants because of lack of response. The most frequent side effects with methotrexate were infections, raised liver enzymes and stomatitis.
Overall completeness and applicability of evidence
Two new studies were included for this update (Jiang 1998; Strand 1999 (ULTRA). However, most studies were conducted between 1985 and 1993, before any definitions of improvement were published, thus only one study published in 1999 (Strand 1999 (ULTRA)) reported data on the per cent of people improving using the ACR core set. Evidence on radiographic outcomes was also derived from the same unique study (Strand 1999 (ULTRA)), which showed statistically significant delay in progression with methotrexate. This trial used state of the art study design and recommended outcome measures for trials in RA (Felson 1993; OMERACT 1993). This updated review provides confirmatory evidence of the benefit of methotrexate at weekly doses of 5 to 25 mg for patients with RA. The trials included in this review used similar inclusion criteria and the participant populations had longstanding severe RA (more than 4 years), were often seropositive, and had failed previous DMARDs (for example, gold therapy, D‐penicillamine, anti‐malarials). Despite the severity of the disease, the improvement was substantial. Both cross‐over trials reported a failure in the disease state after discontinuation of methotrexate, which suggests that the drug has to be continued to maintain the benefit. The long term effectiveness or safety profile of methotrexate cannot be established with this review.
Quality of the evidence
The Table 1 shows the overall quality of evidence. Evidence quality was mainly moderate to high with one outcome, remission, being graded as low quality. Statistically significant heterogeneity among trials was observed for various outcome measures. The heterogeneity remained significant with random‐effects models. As expected, random‐effects model pooling resulted in larger confidence intervals than those obtained from fixed‐effect models. Nevertheless, most efficacy outcome measures remained statistically significant. The reasons for heterogeneity are not apparent but are not likely to relate to the RA populations in the trials since participants were quite similar, having longstanding and severe RA. More likely, differences may have resulted from the various methods used to estimate these outcomes, which requires standardization. For instance, global assessments were measured in different trials with Likert scales or visual analogue scales (VAS).
Potential biases in the review process
A strength of this review is the electronic search strategy using the latest methodology. All important databases were searched, including trial registers. Two trials used a cross‐over design (Andersen 1985; Weinblatt 1985). Because of how the data were reported, we used the final results for the first arm, which was provided only in Weinblatt 1985. In two trials (Pinheiro 1993; Weinblatt 1985) we used the baseline standard deviation to pool the results. This procedure may have created some bias. It was similarly applied to both groups (treatment and control) and the overall impact on the estimation of differences between groups is probably small. Moreover, this bias is expected to result in decreased weighting of these studies, which was preferable, in our view, to excluding the trials.
Agreements and disagreements with other studies or reviews
Clinical practice guidelines recommend methotrexate to be used as a first DMARD in the majority of patients with RA (Singh 2012; Smolen 2013). Other published meta‐analyses have reported similar results (Felson 1992; Gotzsche 1992) but the studies included in these reviews did not include state of the art study design nor used the patient responder analyses as recommended by OMERACT (as reported in the Strand 1999 (ULTRA) study). These systematic reviews also concluded that methotrexate has a better benefit‐harm ratio compared to other alternatives. Furthermore, methotrexate has been proven to be effective even if re‐employed after previous failure (Kapral 2006).
Long term extensions of clinical trials have reported similar findings (Weinblatt 1998; Weinstein 1985). Weinblatt 1998 found that after 11 years of receiving methotrexate monotherapy only 11% of 26 patients discontinued due to toxicity. Weinstein 1985 evaluated 21 patients for five years and only two discontinued therapy due to gastrointestinal toxicity. In the TEMPO trial after three years of methotrexate exposure in 228 patients, non‐infectious serious adverse events were reported in 23% of the patients (van der Heijde 2007). Furthermore, a systematic review of 2008 to 2012 literature that was conducted for the Italian clinical recommendations for the use of methotrexate in rheumatic diseases found evidence suggesting that discontinuation rates due to toxicity are similar to those in patients treated with hydroxychloroquine or leflunomide, and lower than those in patients receiving gold salts or sulphasalazine (Todoerti 2013). The most frequent adverse events reported in the 70 included studies were gastrointestinal and liver toxicity, especially during the first five years. The discontinuation rate due to hepatotoxicity is about 5%. Nonetheless, a recently updated Cochrane review has found that when supplemented with folic acid, methotrexate side effects can be reduced (Shea 2003; Shea 2013).
Authors' conclusions
Implications for practice.
Based on mainly moderate to high quality evidence, methotrexate has a substantial clinical and statistically significant benefit compared to placebo in the short term treatment of people with RA. However, its use was associated with a 16% discontinuation rate due to adverse events.
Implications for research.
Although, the long term effectiveness or safety profile of methotrexate cannot be established with this review, time trend analyses indicate that methotrexate monotherapy has a two‐year drug survival (Aga 2013). Methotrexate continues to be the most prescribed drug for the treatment of RA. This review provides the centrepiece evidence to further compare the effects of methotrexate as the standard of care to other disease‐modifying antirheumatic drugs (traditional or biologic), monotherapy or combinations in network meta‐analyses.
What's new
| Date | Event | Description |
|---|---|---|
| 2 June 2014 | New citation required but conclusions have not changed | New authors added. |
| 2 June 2014 | New search has been performed | New search for studies (November 2013) with two new studies. In addition to including two new studies, the following methodology was updated:
|
History
Review first published: Issue 1, 1998
| Date | Event | Description |
|---|---|---|
| 5 November 2008 | Amended | Converted to new review format. CMSG ID: C052‐R |
Acknowledgements
We would like to thank Tamara Rader for running the search for this review update and Elaine Belseck for her contributions to the original publication of this review. In addition, we would like to thank Brenda Topliss and Vivian Welch for their assistance in editing the original publication.
Appendices
Appendix 1. MEDLINE search strategy via Ovid
Database: Ovid MEDLINE(R) In‐Process & Other Non‐Indexed Citations and Ovid MEDLINE(R) <1946 to Present>
Search Strategy:
‐‐‐‐‐‐‐‐‐‐‐‐‐‐‐‐‐‐‐‐‐‐‐‐‐‐‐‐‐‐‐‐‐‐‐‐‐‐‐‐‐‐‐‐‐‐‐‐‐‐‐‐‐‐‐‐‐‐‐‐‐‐‐‐‐‐‐‐‐‐‐‐‐‐‐‐‐‐‐‐
1 Methotrexate/ (30273)
2 Methotrexate.tw. (28916)
3 amet?opterine.tw. (18)
4 mexate.tw. (1)
5 Abitrexate.tw. (0)
6 A Met?opterine$.tw. (1)
7 Antifolan.tw. (0)
8 Emt?exate.tw. (1)
9 Enthexate.tw. (0)
10 Farmitrexate.tw. (0)
11 Folex.tw. (3)
12 Ledertrexate.tw. (1)
13 Methoblastin.tw. (0)
14 Methohexate.tw. (0)
15 Methotrate.tw. (0)
16 Methylaminopterin.tw. (7)
17 Metotrexat$.tw. (39)
18 Mtx.tw. (8008)
19 Novatrex.tw. (0)
20 Rheumatrex.tw. (3)
21 or/1‐20 (41106)
22 randomized controlled trial.pt. (338380)
23 controlled clinical trial.pt. (85027)
24 randomized.ab. (255787)
25 placebo.ab. (139913)
26 drug therapy.fs. (1570375)
27 randomly.ab. (187308)
28 trial.ab. (263549)
29 groups.ab. (1213057)
30 or/22‐29 (3031443)
31 (animals not (humans and animals)).sh. (3659106)
32 30 not 31 (2591488)
33 exp arthritis, rheumatoid/ (94388)
34 ((rheumatoid or reumatoid or revmatoid or rheumatic or reumatic or revmatic or rheumat$ or reumat$ or revmarthrit$) adj3 (arthrit$ or artrit$ or diseas$ or condition$ or nodule$)).tw. (88910)
35 (felty$ adj2 syndrome).tw. (662)
36 (caplan$ adj2 syndrome).tw. (110)
37 (sjogren$ adj2 syndrome).tw. (10508)
38 (sicca adj2 syndrome).tw. (715)
39 still$ disease.tw. (1514)
40 bechterew$ disease.tw. (366)
41 or/33‐40 (128329)
42 21 and 32 and 41 (5105)
Appendix 2. Cochrane CENTRAL via Wiley
#1 ((rheumatoid or reumatoid or revmatoid or rheumatic or reumatic or revmatic or rheumat* or reumat* or revmarthrit*) near/3 (arthrit* or artrit* or diseas* or condition* or nodule*)):ti,ab
#2 felty* near/2 syndrome:ti,ab
#3 caplan* near/2 syndrome:ti,ab
#4 sjogren* near/2 syndrome:ti,ab
#5 sicca near/2 syndrome:ti,ab
#6 still* next disease:ti,ab
#7 MeSH descriptor: [Arthritis, Rheumatoid] explode all trees
#8 #1 or #2 or #3 or #4 or #5 or #6 or #7
#9 MeSH descriptor: [Methotrexate] explode all trees
#10 Methotrexate:ti,ab
#11 ametopterine:ti,ab
#12 mexate:ti,ab
#13 Abitrexate:ti,ab
#14 "A Met?opterine":ti,ab
#15 Emtexate:ti,ab
#16 Farmitrexate:ti,ab
#17 Folex:ti,ab
#18 Ledertrexate:ti,ab
#19 Methoblastin:ti,ab
#20 Methohexate:ti,ab
#21 Methotrate:ti,ab
#22 Methylaminopterin:ti,ab
#23 Metotrexate:ti,ab
#24 mtx:ti,ab
#25 Novatrex:ti,ab
#26 Rheumatrex:ti,ab
#27 (#9 or #10 or #11 or #12 or #13 or #14 or #15 or #16 or #17 or #18 or #19 or #20 or #21 or #22 or #23 or #24 or #25 or #26)
#28 #8 and #27
Appendix 3. EMBASE via Ovid
Database: Embase <1980 to 2013>
Search Strategy:
‐‐‐‐‐‐‐‐‐‐‐‐‐‐‐‐‐‐‐‐‐‐‐‐‐‐‐‐‐‐‐‐‐‐‐‐‐‐‐‐‐‐‐‐‐‐‐‐‐‐‐‐‐‐‐‐‐‐‐‐‐‐‐‐‐‐‐‐‐‐‐‐‐‐‐‐‐‐‐‐
1 methotrexate/ (114026)
2 Methotrexate.tw. (37008)
3 mexate.tw. (65)
4 Abitrexate.tw. (16)
5 Amet?opterine.tw. (19)
6 mexate.tw. (65)
7 Abitrexate.tw. (16)
8 A Met?opterine.tw. (1)
9 Antifolan.tw. (5)
10 Emt?exate.tw. (38)
11 Enthexate.tw. (1)
12 Farmitrexate.tw. (3)
13 Folex.tw. (69)
14 Ledertrexate.tw. (181)
15 Methoblastin.tw. (46)
16 Methohexate.tw. (0)
17 Methotrate.tw. (3)
18 Methylaminopterin.tw. (6)
19 Metotrexat$.tw. (135)
20 Mtx.tw. (11042)
21 Novatrex.tw. (45)
22 Rheumatrex.tw. (174)
23 exp rheumatoid arthritis/ (130067)
24 ((rheumatoid or reumatoid or revmatoid or rheumatic or reumatic or revmatic or rheumat$ or reumat$ or revmarthrit$) adj3 (arthrit$ or artrit$ or diseas$ or condition$ or nodule$)).tw. (111636)
25 (felty$ adj2 syndrome).tw. (671)
26 (caplan$ adj2 syndrome).tw. (128)
27 (sjogren$ adj2 syndrome).tw. (13234)
28 (sicca adj2 syndrome).tw. (903)
29 still$ disease.tw. (1856)
30 bechterew$ disease.tw. (418)
31 or/23‐30 (170180)
32 random$.tw. (780033)
33 factorial$.tw. (20129)
34 crossover$.tw. (44931)
35 cross over.tw. (19865)
36 cross‐over.tw. (19865)
37 placebo$.tw. (184209)
38 (doubl$ adj blind$).tw. (133711)
39 (singl$ adj blind$).tw. (12983)
40 assign$.tw. (215590)
41 allocat$.tw. (72967)
42 volunteer$.tw. (163728)
43 crossover procedure/ (36069)
44 double blind procedure/ (112873)
45 randomized controlled trial/ (336292)
46 single blind procedure/ (16934)
47 or/32‐46 (1275004)
48 or/1‐22 (118612)
49 31 and 47 and 48 (2897)
Appendix 4. Web of Science Conference Proceedings via Web of Knowledge
Topic=(methotrexate) AND Topic=(rheumatoid arthritis)
Timespan=1997‐01‐01 ‐ 2013‐02‐21. Databases=CPCI‐S, CPCI‐SSH.
Appendix 5. Clinicaltrials.gov
Advanced search
Condition = Rheumatoid Arthritis Intervention = Methotrexate
Data and analyses
Comparison 1. Efficacy.
| Outcome or subgroup title | No. of studies | No. of participants | Statistical method | Effect size |
|---|---|---|---|---|
| 1 ACR 20 | 1 | 300 | Risk Ratio (M‐H, Fixed, 95% CI) | 1.76 [1.25, 2.47] |
| 2 ACR 50 | 1 | 300 | Risk Ratio (M‐H, Fixed, 95% CI) | 3.03 [1.53, 5.98] |
| 3 ACR 70 | 1 | 300 | Risk Ratio (M‐H, Fixed, 95% CI) | 2.07 [0.78, 5.51] |
| 4 Disease Remission | 1 | 189 | Risk Ratio (M‐H, Fixed, 95% CI) | 0.0 [0.0, 0.0] |
| 4.1 18 weeks | 1 | 189 | Risk Ratio (M‐H, Fixed, 95% CI) | 0.0 [0.0, 0.0] |
| 5 Number of tender joints | 4 | 565 | Std. Mean Difference (IV, Random, 95% CI) | ‐0.65 [‐0.91, ‐0.38] |
| 5.1 12 weeks | 2 | 163 | Std. Mean Difference (IV, Random, 95% CI) | ‐0.89 [‐1.92, 0.15] |
| 5.2 18 weeks | 1 | 104 | Std. Mean Difference (IV, Random, 95% CI) | ‐0.61 [‐1.00, ‐0.21] |
| 5.3 52 weeks | 1 | 298 | Std. Mean Difference (IV, Random, 95% CI) | ‐0.64 [‐0.88, ‐0.41] |
| 6 >50% improvement in TJC | 1 | 33 | Risk Ratio (M‐H, Fixed, 95% CI) | 4.24 [1.07, 16.70] |
| 7 Number of swollen joints | 4 | 565 | Std. Mean Difference (IV, Fixed, 95% CI) | ‐0.58 [‐0.75, ‐0.41] |
| 7.1 12 weeks | 2 | 163 | Std. Mean Difference (IV, Fixed, 95% CI) | ‐0.29 [‐0.62, 0.04] |
| 7.2 18 weeks | 1 | 104 | Std. Mean Difference (IV, Fixed, 95% CI) | ‐0.61 [‐1.01, ‐0.22] |
| 7.3 52 weeks | 1 | 298 | Std. Mean Difference (IV, Fixed, 95% CI) | ‐0.73 [‐0.97, ‐0.49] |
| 8 >50% improvement in SJC | 1 | 33 | Risk Ratio (M‐H, Fixed, 95% CI) | 2.51 [0.80, 7.83] |
| 9 Tender Joint Score/Index | 5 | 327 | Std. Mean Difference (IV, Random, 95% CI) | ‐0.73 [‐1.12, ‐0.34] |
| 9.1 12 weeks | 3 | 190 | Std. Mean Difference (IV, Random, 95% CI) | ‐0.65 [‐1.31, ‐0.00] |
| 9.2 18 weeks | 2 | 137 | Std. Mean Difference (IV, Random, 95% CI) | ‐0.85 [‐1.20, ‐0.50] |
| 10 at least 30% improvement in TJS | 2 | 249 | Risk Ratio (M‐H, Random, 95% CI) | 4.33 [1.58, 11.90] |
| 10.1 12 weeks | 1 | 66 | Risk Ratio (M‐H, Random, 95% CI) | 8.00 [2.67, 24.01] |
| 10.2 18 weeks | 1 | 183 | Risk Ratio (M‐H, Random, 95% CI) | 2.84 [1.48, 5.46] |
| 11 Swollen Joint Score/Index | 5 | 327 | Std. Mean Difference (IV, Fixed, 95% CI) | ‐0.48 [‐0.70, ‐0.25] |
| 11.1 12 weeks | 3 | 190 | Std. Mean Difference (IV, Fixed, 95% CI) | ‐0.34 [‐0.64, ‐0.03] |
| 11.2 18 weeks | 2 | 137 | Std. Mean Difference (IV, Fixed, 95% CI) | ‐0.66 [‐1.01, ‐0.32] |
| 12 at least 30% improvement in SJS | 2 | 249 | Risk Ratio (M‐H, Fixed, 95% CI) | 4.87 [2.40, 9.85] |
| 12.1 12 weeks | 1 | 66 | Risk Ratio (M‐H, Fixed, 95% CI) | 5.0 [1.92, 13.05] |
| 12.2 18 weeks | 1 | 183 | Risk Ratio (M‐H, Fixed, 95% CI) | 4.73 [1.68, 13.31] |
| 13 Physician global assessment | 4 | 466 | Std. Mean Difference (IV, Random, 95% CI) | ‐1.12 [‐1.51, ‐0.74] |
| 13.1 12 weeks | 1 | 31 | Std. Mean Difference (IV, Random, 95% CI) | ‐1.74 [‐2.58, ‐0.89] |
| 13.2 18 weeks | 2 | 137 | Std. Mean Difference (IV, Random, 95% CI) | ‐1.11 [0.00, ‐0.22] |
| 13.3 52 weeks | 1 | 298 | Std. Mean Difference (IV, Random, 95% CI) | ‐1.02 [‐1.27, ‐0.77] |
| 14 Percent of patients improving in PhGA | 4 | 414 | Risk Ratio (M‐H, Random, 95% CI) | 2.85 [0.93, 8.71] |
| 14.1 12 weeks | 2 | 198 | Risk Ratio (M‐H, Random, 95% CI) | 4.69 [0.14, 161.38] |
| 14.2 18 weeks | 2 | 216 | Risk Ratio (M‐H, Random, 95% CI) | 3.04 [1.18, 7.82] |
| 15 Walking time | 4 | 181 | Std. Mean Difference (IV, Random, 95% CI) | ‐0.43 [‐0.85, ‐0.01] |
| 15.1 12 weeks | 2 | 55 | Std. Mean Difference (IV, Random, 95% CI) | ‐0.64 [‐1.59, 0.31] |
| 15.2 18 weeks | 2 | 126 | Std. Mean Difference (IV, Random, 95% CI) | ‐0.26 [‐0.62, 0.11] |
| 16 >50% improvement in walking time | 1 | 33 | Risk Ratio (M‐H, Fixed, 95% CI) | 1.25 [0.33, 4.76] |
| 17 Grip strength | 4 | 300 | Std. Mean Difference (IV, Random, 95% CI) | 1.19 [0.29, 2.08] |
| 17.1 12 weeks | 2 | 160 | Std. Mean Difference (IV, Random, 95% CI) | 1.50 [‐1.06, 4.06] |
| 17.2 18 weeks | 2 | 140 | Std. Mean Difference (IV, Random, 95% CI) | 1.06 [‐0.44, 2.57] |
| 18 ESR | 5 | 517 | Mean Difference (IV, Fixed, 95% CI) | ‐8.73 [‐13.91, ‐3.54] |
| 18.1 12 weeks | 3 | 186 | Mean Difference (IV, Fixed, 95% CI) | ‐0.65 [‐10.29, 8.99] |
| 18.2 18 weeks | 1 | 33 | Mean Difference (IV, Fixed, 95% CI) | ‐4.0 [‐27.54, 19.54] |
| 18.3 52 weeks | 1 | 298 | Mean Difference (IV, Fixed, 95% CI) | ‐12.60 [‐18.97, ‐6.23] |
| 19 CRP | 2 | 430 | Mean Difference (IV, Random, 95% CI) | ‐9.97 [‐41.38, 21.44] |
| 19.1 12 weeks | 1 | 132 | Mean Difference (IV, Random, 95% CI) | ‐40.5 [‐98.02, 17.02] |
| 19.2 52 weeks | 1 | 298 | Mean Difference (IV, Random, 95% CI) | ‐1.56 [‐2.11, ‐1.01] |
Comparison 2. Patient‐reported outcomes.
| Outcome or subgroup title | No. of studies | No. of participants | Statistical method | Effect size |
|---|---|---|---|---|
| 1 HAQ Disability Index | 2 | 298 | Mean Difference (IV, Fixed, 95% CI) | ‐0.27 [‐0.39, ‐0.16] |
| 1.1 12 weeks | 1 | 28 | Mean Difference (IV, Fixed, 95% CI) | ‐0.14 [‐0.41, 0.13] |
| 1.2 52 weeks | 1 | 270 | Mean Difference (IV, Fixed, 95% CI) | ‐0.30 [‐0.42, ‐0.18] |
| 2 Percent of improvement in HAQ‐Di | 1 | Risk Ratio (M‐H, Fixed, 95% CI) | Subtotals only | |
| 2.1 at least 20% Improvement | 1 | 270 | Risk Ratio (M‐H, Fixed, 95% CI) | 1.84 [1.28, 2.63] |
| 2.2 at least 50% Improvement | 1 | 270 | Risk Ratio (M‐H, Fixed, 95% CI) | 2.18 [1.27, 3.73] |
| 3 MHAQ | 1 | 298 | Mean Difference (IV, Fixed, 95% CI) | ‐0.4 [‐0.52, ‐0.28] |
| 4 Percent of improvement in MHAQ | 1 | 596 | Risk Ratio (M‐H, Fixed, 95% CI) | 1.71 [1.35, 2.18] |
| 4.1 >or= 20% Improvement | 1 | 298 | Risk Ratio (M‐H, Fixed, 95% CI) | 1.52 [1.14, 2.02] |
| 4.2 >or= 50% Improvement | 1 | 298 | Risk Ratio (M‐H, Fixed, 95% CI) | 2.09 [1.36, 3.22] |
| 5 Activities of Daily Living (ADL) | 1 | 33 | Mean Difference (IV, Random, 95% CI) | ‐50.0 [‐67.81, ‐32.19] |
| 6 Activities of Daily Living (ADL) | 1 | 33 | Risk Ratio (M‐H, Fixed, 95% CI) | 10.39 [0.62, 173.97] |
| 7 SF‐36 Physical component | 1 | Risk Ratio (M‐H, Fixed, 95% CI) | Subtotals only | |
| 7.1 >or= 20% Improvement | 1 | 263 | Risk Ratio (M‐H, Fixed, 95% CI) | 1.45 [1.00, 2.12] |
| 7.2 >or= 50% Improvement | 1 | 263 | Risk Ratio (M‐H, Fixed, 95% CI) | 4.61 [1.88, 11.35] |
| 8 SF‐36 Mental component | 1 | Risk Ratio (M‐H, Fixed, 95% CI) | Subtotals only | |
| 8.1 >or= 20% Improvement | 1 | 263 | Risk Ratio (M‐H, Fixed, 95% CI) | 1.25 [0.79, 1.98] |
| 8.2 >or= 50% Improvement | 1 | 263 | Risk Ratio (M‐H, Fixed, 95% CI) | 1.71 [0.56, 5.24] |
| 9 Pain | 4 | 468 | Mean Difference (IV, Fixed, 95% CI) | ‐2.02 [‐2.41, ‐1.63] |
| 9.1 12 weeks | 1 | 27 | Mean Difference (IV, Fixed, 95% CI) | ‐1.70 [‐3.39, ‐0.01] |
| 9.2 18 weeks | 2 | 143 | Mean Difference (IV, Fixed, 95% CI) | ‐2.41 [‐3.19, ‐1.64] |
| 9.3 52 weeks | 1 | 298 | Mean Difference (IV, Fixed, 95% CI) | ‐1.90 [‐2.37, ‐1.43] |
| 10 Pain | 1 | 33 | Risk Ratio (M‐H, Fixed, 95% CI) | 5.65 [0.76, 41.89] |
| 11 Patient global assessment | 4 | 472 | Std. Mean Difference (IV, Random, 95% CI) | ‐1.15 [‐1.62, ‐0.68] |
| 11.1 12 weeks | 1 | 31 | Std. Mean Difference (IV, Random, 95% CI) | ‐1.74 [‐2.58, ‐0.89] |
| 11.2 18 weeks | 2 | 143 | Std. Mean Difference (IV, Random, 95% CI) | ‐1.25 [‐2.50, ‐0.01] |
| 11.3 52 weeks | 1 | 298 | Std. Mean Difference (IV, Random, 95% CI) | ‐0.88 [‐1.13, ‐0.64] |
| 12 Improvement in PtGA | 4 | 420 | Risk Ratio (M‐H, Random, 95% CI) | 2.47 [0.95, 6.46] |
| 12.1 12 weeks | 2 | 198 | Risk Ratio (M‐H, Random, 95% CI) | 3.87 [0.30, 49.72] |
| 12.2 18 weeks | 2 | 222 | Risk Ratio (M‐H, Random, 95% CI) | 2.50 [0.40, 15.62] |
| 13 Morning stiffness | 1 | 33 | Risk Ratio (M‐H, Fixed, 95% CI) | 2.82 [0.93, 8.60] |
| 14 Morning stiffness | 4 | 200 | Mean Difference (IV, Random, 95% CI) | ‐40.87 [‐95.96, 14.22] |
| 14.1 12 weeks | 2 | 57 | Mean Difference (IV, Random, 95% CI) | ‐27.03 [‐97.37, 43.30] |
| 14.2 18 weeks | 2 | 143 | Mean Difference (IV, Random, 95% CI) | ‐61.78 [‐168.59, 45.03] |
| 15 Work Productivity | 1 | Risk Ratio (M‐H, Fixed, 95% CI) | Subtotals only | |
| 15.1 >or= 20% Improvement | 1 | 240 | Risk Ratio (M‐H, Fixed, 95% CI) | 1.93 [1.22, 3.07] |
| 15.2 >or= 50% Improvement | 1 | 240 | Risk Ratio (M‐H, Fixed, 95% CI) | 2.35 [1.18, 4.67] |
Comparison 3. Radiographic outcomes.
| Outcome or subgroup title | No. of studies | No. of participants | Statistical method | Effect size |
|---|---|---|---|---|
| 1 Radiographic Progression | 1 | 219 | Risk Ratio (M‐H, Fixed, 95% CI) | 0.31 [0.11, 0.86] |
| 2 Total Sharp Score | 1 | 221 | Mean Difference (IV, Fixed, 95% CI) | ‐3.89 [‐13.25, 5.47] |
| 3 Erosion Score | 1 | 221 | Mean Difference (IV, Fixed, 95% CI) | ‐1.59 [‐5.92, 2.74] |
| 4 Joint Space Narrowing | 1 | 221 | Mean Difference (IV, Fixed, 95% CI) | ‐2.22 [‐8.15, 3.71] |
| 5 New Joint Erosions | 1 | Risk Ratio (M‐H, Fixed, 95% CI) | Subtotals only | |
| 5.1 Total patients with new erosions | 1 | 221 | Risk Ratio (M‐H, Fixed, 95% CI) | 0.84 [0.53, 1.33] |
| 5.2 One new joint erosion | 1 | 221 | Risk Ratio (M‐H, Fixed, 95% CI) | 0.86 [0.49, 1.54] |
| 5.3 Two new joint erosions | 1 | 221 | Risk Ratio (M‐H, Fixed, 95% CI) | 0.90 [0.26, 3.10] |
| 5.4 Three new joint erosions | 1 | 221 | Risk Ratio (M‐H, Fixed, 95% CI) | 1.81 [0.07, 44.00] |
| 5.5 more than three joint erosions | 1 | 221 | Risk Ratio (M‐H, Fixed, 95% CI) | 0.60 [0.12, 2.91] |
Comparison 4. Discontinuations.
| Outcome or subgroup title | No. of studies | No. of participants | Statistical method | Effect size |
|---|---|---|---|---|
| 1 Total | 6 | 615 | Risk Ratio (M‐H, Fixed, 95% CI) | 0.73 [0.62, 0.88] |
| 1.1 12 weeks | 2 | 63 | Risk Ratio (M‐H, Fixed, 95% CI) | 1.02 [0.38, 2.75] |
| 1.2 18 weeks | 2 | 222 | Risk Ratio (M‐H, Fixed, 95% CI) | 0.96 [0.69, 1.34] |
| 1.3 27 weeks | 1 | 30 | Risk Ratio (M‐H, Fixed, 95% CI) | 1.0 [0.07, 14.55] |
| 1.4 52 weeks | 1 | 300 | Risk Ratio (M‐H, Fixed, 95% CI) | 0.62 [0.50, 0.76] |
| 2 Lack of efficacy | 6 | 613 | Risk Ratio (M‐H, Random, 95% CI) | 0.38 [0.13, 1.11] |
| 2.1 12 weeks | 2 | 63 | Risk Ratio (M‐H, Random, 95% CI) | 3.17 [0.14, 72.80] |
| 2.2 18 weeks | 2 | 222 | Risk Ratio (M‐H, Random, 95% CI) | 0.15 [0.05, 0.48] |
| 2.3 27 weeks | 1 | 28 | Risk Ratio (M‐H, Random, 95% CI) | 0.0 [0.0, 0.0] |
| 2.4 52 weeks | 1 | 300 | Risk Ratio (M‐H, Random, 95% CI) | 0.46 [0.34, 0.63] |
| 3 Adverse events | 6 | 613 | Risk Ratio (M‐H, Fixed, 95% CI) | 2.06 [1.30, 3.25] |
| 3.1 12 weeks | 2 | 63 | Risk Ratio (M‐H, Fixed, 95% CI) | 3.17 [0.14, 72.80] |
| 3.2 18 weeks | 2 | 222 | Risk Ratio (M‐H, Fixed, 95% CI) | 2.87 [1.53, 5.38] |
| 3.3 27 weeks | 1 | 28 | Risk Ratio (M‐H, Fixed, 95% CI) | 3.0 [0.13, 67.91] |
| 3.4 52 weeks | 1 | 300 | Risk Ratio (M‐H, Fixed, 95% CI) | 1.23 [0.59, 2.56] |
| 4 Lost to follow‐up | 6 | 613 | Risk Ratio (M‐H, Fixed, 95% CI) | 0.72 [0.41, 1.27] |
| 4.1 12 weeks | 2 | 63 | Risk Ratio (M‐H, Fixed, 95% CI) | 1.0 [0.31, 3.23] |
| 4.2 18 weeks | 2 | 222 | Risk Ratio (M‐H, Fixed, 95% CI) | 0.54 [0.21, 1.40] |
| 4.3 27 weeks | 1 | 28 | Risk Ratio (M‐H, Fixed, 95% CI) | 0.0 [0.0, 0.0] |
| 4.4 52 weeks | 1 | 300 | Risk Ratio (M‐H, Fixed, 95% CI) | 0.81 [0.33, 1.99] |
| 5 Non‐compliance | 6 | 613 | Risk Ratio (M‐H, Fixed, 95% CI) | 1.95 [0.08, 47.49] |
| 5.1 12 weeks | 2 | 63 | Risk Ratio (M‐H, Fixed, 95% CI) | 0.0 [0.0, 0.0] |
| 5.2 18 weeks | 2 | 222 | Risk Ratio (M‐H, Fixed, 95% CI) | 0.0 [0.0, 0.0] |
| 5.3 27 weeks | 1 | 28 | Risk Ratio (M‐H, Fixed, 95% CI) | 0.0 [0.0, 0.0] |
| 5.4 52 weeks | 1 | 300 | Risk Ratio (M‐H, Fixed, 95% CI) | 1.95 [0.08, 47.49] |
| 6 Protocol violation | 6 | 613 | Risk Ratio (M‐H, Fixed, 95% CI) | 0.49 [0.06, 3.79] |
| 6.1 12 weeks | 2 | 63 | Risk Ratio (M‐H, Fixed, 95% CI) | 0.35 [0.02, 8.09] |
| 6.2 18 weeks | 2 | 222 | Risk Ratio (M‐H, Fixed, 95% CI) | 0.0 [0.0, 0.0] |
| 6.3 27 weeks | 1 | 28 | Risk Ratio (M‐H, Fixed, 95% CI) | 0.0 [0.0, 0.0] |
| 6.4 52 weeks | 1 | 300 | Risk Ratio (M‐H, Fixed, 95% CI) | 0.65 [0.04, 10.27] |
| 7 Voluntary or unclear reasons | 6 | 613 | Risk Ratio (M‐H, Fixed, 95% CI) | 0.72 [0.41, 1.27] |
| 7.1 12 weeks | 2 | 63 | Risk Ratio (M‐H, Fixed, 95% CI) | 1.0 [0.31, 3.23] |
| 7.2 18 weeks | 2 | 222 | Risk Ratio (M‐H, Fixed, 95% CI) | 0.54 [0.21, 1.40] |
| 7.3 27 weeks | 1 | 28 | Risk Ratio (M‐H, Fixed, 95% CI) | 0.0 [0.0, 0.0] |
| 7.4 52 weeks | 1 | 300 | Risk Ratio (M‐H, Fixed, 95% CI) | 0.81 [0.33, 1.99] |
| 8 Alopecia | 6 | 613 | Risk Ratio (M‐H, Fixed, 95% CI) | 1.30 [0.12, 14.14] |
| 8.1 12 weeks | 2 | 63 | Risk Ratio (M‐H, Fixed, 95% CI) | 0.0 [0.0, 0.0] |
| 8.2 18 weeks | 2 | 222 | Risk Ratio (M‐H, Fixed, 95% CI) | 0.0 [0.0, 0.0] |
| 8.3 27 weeks | 1 | 28 | Risk Ratio (M‐H, Fixed, 95% CI) | 0.0 [0.0, 0.0] |
| 8.4 52 weeks | 1 | 300 | Risk Ratio (M‐H, Fixed, 95% CI) | 1.30 [0.12, 14.14] |
| 9 Gastrointestinal adverse events | 6 | 613 | Risk Ratio (M‐H, Fixed, 95% CI) | 1.59 [0.52, 4.81] |
| 9.1 12 weeks | 2 | 63 | Risk Ratio (M‐H, Fixed, 95% CI) | 3.17 [0.14, 72.80] |
| 9.2 18 weeks | 2 | 222 | Risk Ratio (M‐H, Fixed, 95% CI) | 1.94 [0.37, 10.28] |
| 9.3 27 weeks | 1 | 28 | Risk Ratio (M‐H, Fixed, 95% CI) | 0.0 [0.0, 0.0] |
| 9.4 52 weeks | 1 | 300 | Risk Ratio (M‐H, Fixed, 95% CI) | 0.97 [0.16, 5.73] |
| 10 Hematological adverse events | 6 | 613 | Risk Ratio (M‐H, Fixed, 95% CI) | 3.43 [0.73, 16.13] |
| 10.1 12 weeks | 2 | 63 | Risk Ratio (M‐H, Fixed, 95% CI) | 0.0 [0.0, 0.0] |
| 10.2 18 weeks | 2 | 222 | Risk Ratio (M‐H, Fixed, 95% CI) | 3.58 [0.60, 21.25] |
| 10.3 27 weeks | 1 | 28 | Risk Ratio (M‐H, Fixed, 95% CI) | 3.0 [0.13, 67.91] |
| 10.4 52 weeks | 1 | 300 | Risk Ratio (M‐H, Fixed, 95% CI) | 0.0 [0.0, 0.0] |
| 11 Hypertension | 6 | 613 | Risk Ratio (M‐H, Fixed, 95% CI) | 0.22 [0.01, 5.28] |
| 11.1 12 weeks | 2 | 63 | Risk Ratio (M‐H, Fixed, 95% CI) | 0.0 [0.0, 0.0] |
| 11.2 18 weeks | 2 | 222 | Risk Ratio (M‐H, Fixed, 95% CI) | 0.0 [0.0, 0.0] |
| 11.3 27 weeks | 1 | 28 | Risk Ratio (M‐H, Fixed, 95% CI) | 0.0 [0.0, 0.0] |
| 11.4 52 weeks | 1 | 300 | Risk Ratio (M‐H, Fixed, 95% CI) | 0.22 [0.01, 5.28] |
| 12 Infection | 6 | 613 | Risk Ratio (M‐H, Fixed, 95% CI) | 2.36 [0.25, 21.82] |
| 12.1 12 weeks | 2 | 63 | Risk Ratio (M‐H, Fixed, 95% CI) | 0.0 [0.0, 0.0] |
| 12.2 18 weeks | 2 | 222 | Risk Ratio (M‐H, Fixed, 95% CI) | 2.83 [0.12, 64.89] |
| 12.3 27 weeks | 1 | 28 | Risk Ratio (M‐H, Fixed, 95% CI) | 0.0 [0.0, 0.0] |
| 12.4 52 weeks | 1 | 300 | Risk Ratio (M‐H, Fixed, 95% CI) | 1.95 [0.08, 47.49] |
| 13 Interstitial pneumonitis/Pulmonary infiltrates | 6 | 613 | Risk Ratio (M‐H, Fixed, 95% CI) | 0.79 [0.10, 6.17] |
| 13.1 12 weeks | 2 | 63 | Risk Ratio (M‐H, Fixed, 95% CI) | 0.0 [0.0, 0.0] |
| 13.2 18 weeks | 2 | 222 | Risk Ratio (M‐H, Fixed, 95% CI) | 0.33 [0.01, 8.00] |
| 13.3 27 weeks | 1 | 28 | Risk Ratio (M‐H, Fixed, 95% CI) | 0.0 [0.0, 0.0] |
| 13.4 52 weeks | 1 | 300 | Risk Ratio (M‐H, Fixed, 95% CI) | 1.95 [0.08, 47.49] |
| 14 Liver enzyme abnormalities | 6 | 613 | Risk Ratio (M‐H, Fixed, 95% CI) | 3.75 [1.59, 8.84] |
| 14.1 12 weeks | 2 | 63 | Risk Ratio (M‐H, Fixed, 95% CI) | 0.0 [0.0, 0.0] |
| 14.2 18 weeks | 2 | 222 | Risk Ratio (M‐H, Fixed, 95% CI) | 4.45 [1.57, 12.66] |
| 14.3 27 weeks | 1 | 28 | Risk Ratio (M‐H, Fixed, 95% CI) | 0.0 [0.0, 0.0] |
| 14.4 52 weeks | 1 | 300 | Risk Ratio (M‐H, Fixed, 95% CI) | 2.59 [0.56, 12.00] |
| 15 Mucocutaneous adverse events | 6 | 613 | Risk Ratio (M‐H, Fixed, 95% CI) | 1.65 [0.41, 6.71] |
| 15.1 12 weeks | 2 | 63 | Risk Ratio (M‐H, Fixed, 95% CI) | 0.0 [0.0, 0.0] |
| 15.2 18 weeks | 2 | 222 | Risk Ratio (M‐H, Fixed, 95% CI) | 1.65 [0.41, 6.71] |
| 15.3 27 weeks | 1 | 28 | Risk Ratio (M‐H, Fixed, 95% CI) | 0.0 [0.0, 0.0] |
| 15.4 52 weeks | 1 | 300 | Risk Ratio (M‐H, Fixed, 95% CI) | 0.0 [0.0, 0.0] |
| 16 Myocardial infarction | 6 | 613 | Risk Ratio (M‐H, Fixed, 95% CI) | 1.95 [0.08, 47.49] |
| 16.1 12 weeks | 2 | 63 | Risk Ratio (M‐H, Fixed, 95% CI) | 0.0 [0.0, 0.0] |
| 16.2 18 weeks | 2 | 222 | Risk Ratio (M‐H, Fixed, 95% CI) | 0.0 [0.0, 0.0] |
| 16.3 27 weeks | 1 | 28 | Risk Ratio (M‐H, Fixed, 95% CI) | 0.0 [0.0, 0.0] |
| 16.4 52 weeks | 1 | 300 | Risk Ratio (M‐H, Fixed, 95% CI) | 1.95 [0.08, 47.49] |
| 17 Rash | 6 | 613 | Risk Ratio (M‐H, Fixed, 95% CI) | 0.22 [0.01, 5.28] |
| 17.1 12 weeks | 2 | 63 | Risk Ratio (M‐H, Fixed, 95% CI) | 0.0 [0.0, 0.0] |
| 17.2 18 weeks | 2 | 222 | Risk Ratio (M‐H, Fixed, 95% CI) | 0.0 [0.0, 0.0] |
| 17.3 27 weeks | 1 | 28 | Risk Ratio (M‐H, Fixed, 95% CI) | 0.0 [0.0, 0.0] |
| 17.4 52 weeks | 1 | 300 | Risk Ratio (M‐H, Fixed, 95% CI) | 0.22 [0.01, 5.28] |
Comparison 5. Adverse events.
| Outcome or subgroup title | No. of studies | No. of participants | Statistical method | Effect size |
|---|---|---|---|---|
| 1 Total | 2 | 94 | Risk Ratio (M‐H, Fixed, 95% CI) | 3.0 [1.41, 6.37] |
| 1.1 12 weeks | 2 | 94 | Risk Ratio (M‐H, Fixed, 95% CI) | 3.0 [1.41, 6.37] |
| 2 Serious Adverse Events | 2 | 330 | Risk Ratio (M‐H, Fixed, 95% CI) | 1.44 [0.36, 5.74] |
| 2.1 27 weeks | 1 | 30 | Risk Ratio (M‐H, Fixed, 95% CI) | 1.0 [0.07, 14.55] |
| 2.2 52 weeks | 1 | 300 | Risk Ratio (M‐H, Fixed, 95% CI) | 1.62 [0.32, 8.22] |
| 3 Abdominal pain | 2 | 366 | Risk Ratio (M‐H, Fixed, 95% CI) | 2.01 [0.99, 4.10] |
| 3.1 12 weeks | 1 | 66 | Risk Ratio (M‐H, Fixed, 95% CI) | 0.33 [0.01, 7.90] |
| 3.2 52 weeks | 1 | 300 | Risk Ratio (M‐H, Fixed, 95% CI) | 2.27 [1.07, 4.81] |
| 4 Alopecia | 2 | 366 | Risk Ratio (M‐H, Fixed, 95% CI) | 6.51 [1.20, 35.33] |
| 4.1 12 weeks | 1 | 66 | Risk Ratio (M‐H, Fixed, 95% CI) | 5.0 [0.25, 100.32] |
| 4.2 52 weeks | 1 | 300 | Risk Ratio (M‐H, Fixed, 95% CI) | 7.13 [0.93, 54.52] |
| 5 Anorexia | 1 | 66 | Risk Ratio (M‐H, Fixed, 95% CI) | 3.0 [0.13, 71.07] |
| 5.1 12 weeks | 1 | 66 | Risk Ratio (M‐H, Fixed, 95% CI) | 3.0 [0.13, 71.07] |
| 6 Allergic reactions | 1 | 300 | Risk Ratio (M‐H, Fixed, 95% CI) | 1.18 [0.69, 2.04] |
| 6.1 52 weeks | 1 | 300 | Risk Ratio (M‐H, Fixed, 95% CI) | 1.18 [0.69, 2.04] |
| 7 Backpain | 1 | 66 | Risk Ratio (M‐H, Fixed, 95% CI) | 5.0 [0.25, 100.32] |
| 7.1 12 weeks | 1 | 66 | Risk Ratio (M‐H, Fixed, 95% CI) | 5.0 [0.25, 100.32] |
| 8 Chest pain | 1 | 66 | Risk Ratio (M‐H, Fixed, 95% CI) | 2.0 [0.19, 21.00] |
| 8.1 12 weeks | 1 | 66 | Risk Ratio (M‐H, Fixed, 95% CI) | 2.0 [0.19, 21.00] |
| 9 CNS (Nightmares, Depression) | 2 | 99 | Risk Ratio (M‐H, Fixed, 95% CI) | 0.33 [0.01, 7.90] |
| 9.1 12 weeks | 1 | 66 | Risk Ratio (M‐H, Fixed, 95% CI) | 0.33 [0.01, 7.90] |
| 9.2 18 weeks | 1 | 33 | Risk Ratio (M‐H, Fixed, 95% CI) | 0.0 [0.0, 0.0] |
| 10 Cough | 2 | 99 | Risk Ratio (M‐H, Fixed, 95% CI) | 1.46 [0.26, 8.34] |
| 10.1 12 weeks | 1 | 66 | Risk Ratio (M‐H, Fixed, 95% CI) | 2.0 [0.19, 21.00] |
| 10.2 18 weeks | 1 | 33 | Risk Ratio (M‐H, Fixed, 95% CI) | 0.94 [0.06, 13.82] |
| 11 Death | 2 | 366 | Risk Ratio (M‐H, Fixed, 95% CI) | 0.80 [0.10, 6.17] |
| 11.1 12 weeks | 1 | 66 | Risk Ratio (M‐H, Fixed, 95% CI) | 0.33 [0.01, 7.90] |
| 11.2 52 weeks | 1 | 300 | Risk Ratio (M‐H, Fixed, 95% CI) | 1.95 [0.08, 47.49] |
| 12 Diarrhea | 2 | 366 | Risk Ratio (M‐H, Random, 95% CI) | 1.98 [0.33, 11.81] |
| 12.1 12 weeks | 1 | 66 | Risk Ratio (M‐H, Random, 95% CI) | 9.00 [0.50, 160.78] |
| 12.2 52 weeks | 1 | 300 | Risk Ratio (M‐H, Random, 95% CI) | 1.17 [0.71, 1.91] |
| 13 Dyspepsia | 2 | 333 | Risk Ratio (M‐H, Fixed, 95% CI) | 1.30 [0.74, 2.27] |
| 13.1 18 weeks | 1 | 33 | Risk Ratio (M‐H, Fixed, 95% CI) | 2.82 [0.66, 12.01] |
| 13.2 52 weeks | 1 | 300 | Risk Ratio (M‐H, Fixed, 95% CI) | 1.11 [0.60, 2.06] |
| 14 Gastroenteritis/gastrointestinal distress | 2 | 489 | Risk Ratio (M‐H, Fixed, 95% CI) | 2.20 [1.03, 4.68] |
| 14.1 18 weeks | 1 | 189 | Risk Ratio (M‐H, Fixed, 95% CI) | 1.84 [0.77, 4.40] |
| 14.2 52 weeks | 1 | 300 | Risk Ratio (M‐H, Fixed, 95% CI) | 3.24 [0.72, 14.53] |
| 15 Headache | 2 | 255 | Risk Ratio (M‐H, Fixed, 95% CI) | 1.49 [0.25, 8.77] |
| 15.1 12 weeks | 1 | 66 | Risk Ratio (M‐H, Fixed, 95% CI) | 5.0 [0.25, 100.32] |
| 15.2 18 weeks | 1 | 189 | Risk Ratio (M‐H, Fixed, 95% CI) | 0.33 [0.01, 8.00] |
| 16 Hematological adverse events | 4 | 552 | Risk Ratio (M‐H, Fixed, 95% CI) | 3.47 [0.89, 13.57] |
| 16.1 12 weeks | 1 | 30 | Risk Ratio (M‐H, Fixed, 95% CI) | 5.0 [0.26, 96.13] |
| 16.2 18 weeks | 2 | 222 | Risk Ratio (M‐H, Fixed, 95% CI) | 3.58 [0.60, 21.25] |
| 16.3 52 weeks | 1 | 300 | Risk Ratio (M‐H, Fixed, 95% CI) | 1.95 [0.08, 47.49] |
| 17 Hypertension | 1 | 300 | Risk Ratio (M‐H, Fixed, 95% CI) | 0.54 [0.17, 1.73] |
| 17.1 52 weeks | 1 | 300 | Risk Ratio (M‐H, Fixed, 95% CI) | 0.54 [0.17, 1.73] |
| 18 Infections | 3 | 399 | Risk Ratio (M‐H, Fixed, 95% CI) | 1.26 [1.01, 1.57] |
| 18.1 12 weeks | 1 | 66 | Risk Ratio (M‐H, Fixed, 95% CI) | 2.0 [0.19, 21.00] |
| 18.2 18 weeks | 1 | 33 | Risk Ratio (M‐H, Fixed, 95% CI) | 1.88 [0.19, 18.80] |
| 18.3 52 weeks | 1 | 300 | Risk Ratio (M‐H, Fixed, 95% CI) | 1.24 [0.99, 1.55] |
| 19 Liver enzymes abnormalities | 3 | Risk Ratio (M‐H, Fixed, 95% CI) | Subtotals only | |
| 19.1 Patients with elevated liver enzymes | 3 | 555 | Risk Ratio (M‐H, Fixed, 95% CI) | 4.78 [2.30, 9.95] |
| 19.2 ALT levels >2 times ULN and <or=3 times ULN | 1 | 300 | Risk Ratio (M‐H, Fixed, 95% CI) | 16.26 [0.97, 271.99] |
| 19.3 ALT level >3 times ULN | 1 | 300 | Risk Ratio (M‐H, Fixed, 95% CI) | 1.08 [0.26, 4.44] |
| 19.4 ALT levels reversible to <or=2 times ULN | 1 | 300 | Risk Ratio (M‐H, Fixed, 95% CI) | 2.20 [0.84, 5.81] |
| 19.5 AST levels >2 times ULN and <or= 3 times ULN | 1 | 300 | Risk Ratio (M‐H, Fixed, 95% CI) | 3.57 [0.80, 15.80] |
| 19.6 AST levels >3 times ULN | 1 | 300 | Risk Ratio (M‐H, Fixed, 95% CI) | 0.32 [0.03, 3.54] |
| 19.7 AST levels reversible to <or=2 times ULN | 1 | 300 | Risk Ratio (M‐H, Fixed, 95% CI) | 1.30 [0.50, 3.36] |
| 20 Mucosal ulcers | 1 | 189 | Risk Ratio (M‐H, Fixed, 95% CI) | 1.65 [0.41, 6.71] |
| 20.1 18 weeks | 1 | 189 | Risk Ratio (M‐H, Fixed, 95% CI) | 1.65 [0.41, 6.71] |
| 21 Nausea and/or Vomiting | 4 | 427 | Risk Ratio (M‐H, Fixed, 95% CI) | 1.22 [0.81, 1.83] |
| 21.1 12 weeks | 2 | 94 | Risk Ratio (M‐H, Fixed, 95% CI) | 1.83 [0.74, 4.54] |
| 21.2 18 weeks | 1 | 33 | Risk Ratio (M‐H, Fixed, 95% CI) | 1.88 [0.40, 8.90] |
| 21.3 52 weeks | 1 | 300 | Risk Ratio (M‐H, Fixed, 95% CI) | 1.03 [0.64, 1.67] |
| 22 New onset Hypertension | 1 | 300 | Risk Ratio (M‐H, Fixed, 95% CI) | 4.55 [0.24, 87.33] |
| 22.1 52 weeks | 1 | 300 | Risk Ratio (M‐H, Fixed, 95% CI) | 4.55 [0.24, 87.33] |
| 23 Proteinuria | 1 | 24 | Risk Ratio (M‐H, Fixed, 95% CI) | 3.0 [0.13, 67.06] |
| 23.1 12 weeks | 1 | 24 | Risk Ratio (M‐H, Fixed, 95% CI) | 3.0 [0.13, 67.06] |
| 24 Pruritus | 1 | 189 | Risk Ratio (M‐H, Fixed, 95% CI) | 0.20 [0.01, 4.07] |
| 24.1 18 weeks | 1 | 189 | Risk Ratio (M‐H, Fixed, 95% CI) | 0.20 [0.01, 4.07] |
| 25 Psoriasis | 1 | 33 | Risk Ratio (M‐H, Fixed, 95% CI) | 2.83 [0.12, 64.89] |
| 25.1 18 weeks | 1 | 33 | Risk Ratio (M‐H, Fixed, 95% CI) | 2.83 [0.12, 64.89] |
| 26 Pulmonary events | 2 | 489 | Risk Ratio (M‐H, Fixed, 95% CI) | 0.79 [0.10, 6.17] |
| 26.1 18 weeks | 1 | 189 | Risk Ratio (M‐H, Fixed, 95% CI) | 0.33 [0.01, 8.00] |
| 26.2 52 weeks | 1 | 300 | Risk Ratio (M‐H, Fixed, 95% CI) | 1.95 [0.08, 47.49] |
| 27 Rash | 3 | 279 | Risk Ratio (M‐H, Fixed, 95% CI) | 1.00 [0.32, 3.14] |
| 27.1 12 weeks | 2 | 90 | Risk Ratio (M‐H, Fixed, 95% CI) | 0.78 [0.20, 2.98] |
| 27.2 18 weeks | 1 | 189 | Risk Ratio (M‐H, Fixed, 95% CI) | 1.98 [0.18, 21.46] |
| 28 Stomatitis/oral ulcers | 4 | 588 | Risk Ratio (M‐H, Fixed, 95% CI) | 2.03 [1.04, 3.96] |
| 28.1 12 weeks | 1 | 66 | Risk Ratio (M‐H, Fixed, 95% CI) | 5.0 [0.25, 100.32] |
| 28.2 18 weeks | 2 | 222 | Risk Ratio (M‐H, Fixed, 95% CI) | 2.54 [0.75, 8.61] |
| 28.3 52 weeks | 1 | 300 | Risk Ratio (M‐H, Fixed, 95% CI) | 1.67 [0.72, 3.87] |
| 29 Stroke | 1 | 66 | Risk Ratio (M‐H, Fixed, 95% CI) | 0.33 [0.01, 7.90] |
| 29.1 12 weeks | 1 | 66 | Risk Ratio (M‐H, Fixed, 95% CI) | 0.33 [0.01, 7.90] |
Characteristics of studies
Characteristics of included studies [ordered by study ID]
Andersen 1985.
| Methods | Randomized allocation Double blind allocation and assessment Cross‐over design Duration ‐ 27 weeks Sample size at entry ‐ 15 Completed crossover ‐ 12 | |
| Participants | Patients with active RA Mean age ‐ 60.4 yrs Females ‐ 75% Mean duration of disease ‐ 14 yrs Prevalence of RF ‐ 91.5% Concomitant use of steroids ‐ 90% No concomitant use of other DMARDs Previous DMARD use ‐ 100% | |
| Interventions | IM MTX ‐ 1 patient 20mg /wk 11 patients 25 mg /wk | |
| Outcomes | Tender joints Swollen joints Pain (joint discomfort) Patient global (0‐10 VAS) Physician global (0‐4) Walking time ESR | |
| Notes | 12 completed cross‐over, included in efficacy analysis
14 included in toxicity analysis (1 moved away) Non‐industrial source of funding for the study |
|
| Risk of bias | ||
| Bias | Authors' judgement | Support for judgement |
| Random sequence generation (selection bias) | Low risk | Random assignment by random number tables |
| Allocation concealment (selection bias) | Unclear risk | Methods for allocation concealment were not reported |
| Blinding (performance bias and detection bias) All outcomes | High risk | Physicians and patients were blinded until the end of the study. But during the study one patient in the Methotrexate arm developed pancytopenia which required breaking the code |
| Incomplete outcome data (attrition bias) All outcomes | High risk | Withdrawal rate was 33% in methotrexate group and 33% placebo group. Patients withdrawn were excluded form the analysis |
| Selective reporting (reporting bias) | Low risk | All outcomes including adverse events were reported |
| Other bias | Low risk | Randomization was done to avoid baseline imbalance |
Furst 1989.
| Methods | Randomized allocation Double blind allocation and assessment Parallel group design Sample size at entry: 52 MTX ‐ 17 Placebo ‐ 16 Duration ‐ 18wks | |
| Participants | Patients with active RA Mean age ‐ 55.6 Females ‐ 63% Duration of disease ‐ unknown Positive rheumatoid factor ‐ 87% Concomitant steroid use ‐ 54% No concomitant DMARD use Previous DMARD use ‐ 100% | |
| Interventions | Oral MTX 10 mg/m2/wk Study comparing 2 dosages (5 and 10mg/m2/wk) ‐ only higher dose included | |
| Outcomes | Tender joints Swollen joints Pain (0‐100 VAS) Physician global (0‐100 VAS) Patient global (0‐100 VAS) Walking time Function (ADL score) ESR | |
| Notes | Intent to treat Non‐industrial source of funding for the study |
|
| Risk of bias | ||
| Bias | Authors' judgement | Support for judgement |
| Random sequence generation (selection bias) | Unclear risk | Patients were randomly assigned to either methotrexate or placebo, but the methods for sequence generation were not reported |
| Allocation concealment (selection bias) | Unclear risk | Methods for allocation concealment were not reported |
| Blinding (performance bias and detection bias) All outcomes | Low risk | Double blinding design was employed in the study |
| Incomplete outcome data (attrition bias) All outcomes | Low risk | Withdrawal rate was 6%, 8% and 13% in placebo, MTX (5mg/m2) and MTX (10mg/m2) groups respectively All patients were analysed on intention‐to‐treat basis |
| Selective reporting (reporting bias) | Low risk | All outcomes were reported including adverse events |
| Other bias | Low risk | Randomization was done to avoid baseline imbalance |
Jiang 1998.
| Methods | Random allocation Sample size at entry ‐ 132 MTX ‐ 90 Placebo (NSAIDs) ‐ 42 Duration ‐ 12 weeks |
|
| Participants | Patients with active RA Mean age ‐ Females ‐ Duration of disease ‐ unknown Positive rheumatoid factor ‐ Concomitant steriod use ‐ No concomitant DMARD use Previous DMARD use ‐ | |
| Interventions | MTX ‐ 7.5mg‐15mg NSAIDs |
|
| Outcomes | Joint tenderness count Joint tenderness score Joint swelling count Joint swelling score Hand grip strength ESR CRP |
|
| Notes | Funding source was not reported | |
| Risk of bias | ||
| Bias | Authors' judgement | Support for judgement |
| Random sequence generation (selection bias) | Unclear risk | Patients were randomly allocated, but no description on the methods used was provided |
| Allocation concealment (selection bias) | Unclear risk | Methods for allocation concealment not reported |
| Blinding (performance bias and detection bias) All outcomes | Low risk | Double‐blinding design was employed in the study |
| Incomplete outcome data (attrition bias) All outcomes | High risk | Withdrawal rates were not provided. Unclear if analyses were performed on an intention‐to‐treat population or completers |
| Selective reporting (reporting bias) | High risk | Adverse event rates for the placebo arm were not provided |
| Other bias | Low risk | Randomization was done to avoid baseline imbalance |
Pinheiro 1993.
| Methods | Randomized allocation Double blind allocation and assessment Sample size at entry ‐ 28 Duration ‐ 12 weeks | |
| Participants | Patients with active RA Mean age ‐ 47.4 yrs Females ‐ 89%% Mean duration of disease ‐ 8 yrs Prevalence of RF ‐ 90% Concomitant use of steroids ‐ 57%% No concomitant use of other DMARDs Previous DMARD use ‐ 100% | |
| Interventions | Oral MTX 15mg/wk | |
| Outcomes | Tender joints Pain (0‐10 VAS) Walking time Function (modified HAQ) ESR | |
| Notes | Source of funding was not reported | |
| Risk of bias | ||
| Bias | Authors' judgement | Support for judgement |
| Random sequence generation (selection bias) | Unclear risk | No mention on the method of sequence generation |
| Allocation concealment (selection bias) | Unclear risk | No mention on the method of allocation concealment |
| Blinding (performance bias and detection bias) All outcomes | Low risk | All patients received indistinct capsules of MTX or placebo |
| Incomplete outcome data (attrition bias) All outcomes | High risk | Withdrawal rate was 77%. All efficacy statistical analyses were performed on the completer population |
| Selective reporting (reporting bias) | Low risk | Protocol was not available, but results for all the outcomes listed in the methods section were reported including adverse events |
| Other bias | Low risk | Randomization was done to avoid baseline imbalance |
Strand 1999 (ULTRA).
| Methods | Randomized, double‐blind, placebo, active controlled 12 month study Multicenter study (42 sites) Sample size at entry: 485 No. analysed: 482 MTX group: 182 Placebo group: 118 Duration of therapy: 52 weeks Sample size provided 90% power |
|
| Participants | Patients with active RA Mean Age: MTX: 53.3±11.8 years PBO: 54.6±10.7 years Females: MTX: 75.3% PBO: 70.3% Duration of disease: MTX: 6.5±8.1 years PBO: 6.9±8.0 years Positive Rheumatoid Factor: MTX: 59.4% PBO: 60.2% Concomitant use of steroids: MTX: 52.7% PBO: 55.1% Concomitant use of NSAIDs: MTX: 69.7% PBO: 65.2% Previous DMARD use: MTX: 44% PBO: 39.8% |
|
| Interventions | Methotrexate 7.5‐15mg/wk | |
| Outcomes | ACR 20, 50, 70 AUC for duration of ACR 20 Patient and Physician Global Assessments of disease activity (VAS) Patient assessment of pain (VAS) MHAQ, HAQ, SF‐36 Tender joint count (TJC), swollen Joint count (SJC) ESR, CRP Joint damage (TSS, ESS, JSN, new joint erosions) Adverse events |
|
| Notes | Intent to treat (last observation carried forward) Non‐industrial source of funding for the study |
|
| Risk of bias | ||
| Bias | Authors' judgement | Support for judgement |
| Random sequence generation (selection bias) | Low risk | Using computerised adaptive algorithm to assign treatment based on stratum and to maintain balance the number of patients previously assigned at that site to each arm |
| Allocation concealment (selection bias) | Low risk | Calling a randomization centre to obtain unique patient numbers |
| Blinding (performance bias and detection bias) All outcomes | Low risk | To preserve the blind, all patients received an oral dose of MTX or matching MTX placebo |
| Incomplete outcome data (attrition bias) All outcomes | Low risk | Withdrawal rate was 47% and 68.6% in methotrexate and placebo groups respectively. All efficacy statistical analyses were performed on the intention‐to‐treat population. Analyses used the last observation carried forward method |
| Selective reporting (reporting bias) | Low risk | All outcomes were reported including the adverse events |
| Other bias | Low risk | Randomization was done to avoid baseline imbalance |
Weinblatt 1985.
| Methods | Randomized allocation Double blind allocation and assessment Cross‐over design Duration 12 weeks Sample size at entry ‐ 35 First arm MTX ‐ 17 Placebo ‐ 18 | |
| Participants | Patients with active RA Mean age ‐ 60 Females ‐ 71.4% Mean duration of disease ‐ 119 months Positive rheumatoid factor ‐ 97% Concomitant use of steroids ‐ 54.2% Concomitant use of other DMARDS ‐ unknown Previous DMARD use ‐ 100% | |
| Interventions | Oral MTX ‐ 15mg/wk | |
| Outcomes | Tender joints Swollen joints Physician global (0‐4) Patient global (0‐4) Walking time ESR | |
| Notes | Results pooled for first arm Non‐industrial source of funding for the study |
|
| Risk of bias | ||
| Bias | Authors' judgement | Support for judgement |
| Random sequence generation (selection bias) | Unclear risk | No mention on the method of sequence generation |
| Allocation concealment (selection bias) | Unclear risk | No mention on the method of allocation concealment |
| Blinding (performance bias and detection bias) All outcomes | Low risk | Patients, their rheumatologists and the investigators remained unaware of drug assignments until the study was completed |
| Incomplete outcome data (attrition bias) All outcomes | Low risk | Withdrawal rate was 12% in MTX group and 11% in placebo group |
| Selective reporting (reporting bias) | Low risk | All outcomes were reported including the adverse events |
| Other bias | Low risk | Randomization was done to avoid baseline imbalance |
Williams 1985.
| Methods | Randomize allocation Double blind allocation and assessment Parallel group design Duration 18 weeks Sample size at entry: 189 MTX ‐ 95 Placebo ‐ 94 | |
| Participants | Patients with active RA Mean age ‐ 54 Females ‐ 71.9% Mean duration of disease ‐ 13.5 yrs Prevalence of RF ‐ not reported Concomitant steroid use ‐ 54% Previous use of DMARDS ‐ 100% No concomitant use of other DMARDS | |
| Interventions | Oral MTX ‐ 7.5mg (33%) ‐ 15mg (66%) /wk | |
| Outcomes | Tender joints Swollen joints Pain (0‐100 VAS) Physician global (1‐5) Patient global (1‐5) Function (MACTAR) ESR (measured but reported in format not suitable for pooling) | |
| Notes | MACTAR scores from publication by Tugwell 1990
ESR differences favoured MTX (P<0.0001) Non‐industrial source of funding for the study |
|
| Risk of bias | ||
| Bias | Authors' judgement | Support for judgement |
| Random sequence generation (selection bias) | Low risk | Study was randomised. Sequence generated by a coordinating centre |
| Allocation concealment (selection bias) | Low risk | Random assignment by coordinating centre |
| Blinding (performance bias and detection bias) All outcomes | Low risk | Double blinding design of the study |
| Incomplete outcome data (attrition bias) All outcomes | High risk | 41% in MTX group and 43% in the placebo group withdrew from the study because of adverse effects. Statistical analysis was not done based on intention‐to‐treat |
| Selective reporting (reporting bias) | Low risk | All outcomes including adverse events were reported |
| Other bias | Low risk | Randomization was done to avoid baseline imbalance |
Characteristics of excluded studies [ordered by study ID]
| Study | Reason for exclusion |
|---|---|
| Cannon 1990 | Inadequate data for inclusion in the analysis |
| Cohen 2001 | 2‐year follow‐up from Strand 1999 (ULTRA) trial. Data in the placebo group were not reported |
| Jones 2010 (AMBITION) | The AMBITION trial evaluated tocilizumab versus methotrexate versus placebo. However the patients enrolled in the placebo controlled substudy could receive rescue treatment with tocilizumab 8 mg/kg within the first 8 weeks of double‐blind treatment. In addition, data for the placebo group were not reported |
| Szanto 1986 | Inadequate data for inclusion in the analysis |
| Thompson 1984 | Short duration of trial: 6 weeks |
| Weinblatt 1998 | Long term extension trial from Weinblatt 1985. Data are not reported for the placebo group at 132 months of follow‐up |
Differences between protocol and review
The three major changes from the original version were the following.
In the first publication of this review, pooled odds ratios (OR) for withdrawals and toxicity were estimated using Peto's method (Petitti 1994). However, in most of the analyses the criteria for using this method were not fulfilled, therefore we have used RR. The RR estimate is very similar to the OR in rare outcomes (Higgins 2011). Toxicity was analysed for total withdrawals from adverse reactions, and withdrawals for system‐specific side effects.
The methodological quality of the studies was assessed using a quality scale validated and published by Jadad 1996. This scale includes an assessment of randomization, double‐blinding procedures and description of withdrawals. The possible range of scores is 0 (worst) to 5 (best). Three studies had a score of 5 and the other two a score of 4. For this update all studies have been assessed using the Cochrane Collaboration risk of bias tool (Higgins 2011).
Andersen 1985 was removed from the efficacy analyses because the authors did not provide separate data for period 1 (before cross‐over) of the study.
Three studies (Furst 1989; Pinheiro 1993; Strand 1999 (ULTRA)) assessed patient functional status through ADL, HAQ disability index and modified HAQ, respectively. In the original review, functional status was analysed combining two studies reporting data on ADL and HAQ. For the update, a separate analysis was performed for each instrument.
Contributions of authors
Link with editorial base and coordinate contributions from co‐authors (MSA) Draft protocol (MLO, MSA) Run search (LF) Identify relevant titles and abstracts from searches (HS, MLO) Obtain copies of trials (HS) Selection of trials (HS, MLO, MSA) Extract data from trials (HS, MLO) Enter data into RevMan (HS, MLO) Carry out analysis (MLO) Interpret data (MLO, MSA) Draft final review (MLO and MSA) Update review (MLO, MSA)
Sources of support
Internal sources
-
The University of Texas, MD Anderson Cancer Center, USA.
Office space and supplies, computer access, information retrieval system
External sources
No sources of support supplied
Declarations of interest
Dr Suarez‐Almazor is the recipient of a K24 career award from the National Institute for Musculoskeletal and Skin Disorders. She is also the Director of the Houston Centre for Education and Research on Therapeutics, funded by the Agency for Healthcare Research and Quality (AHRQ).
New search for studies and content updated (no change to conclusions)
References
References to studies included in this review
Andersen 1985 {published data only}
- Andersen PA, West SG, O'Dell JR, Via CS, Claypool RG, Kotzin BL. Weekly pulse methotrexate in rheumatoid arthritis. Clinical and immunologic effects in a randomized, double‐blind study. Annals of Internal Medicine 1985;103(4):489‐96. [DOI] [PubMed] [Google Scholar]
Furst 1989 {published data only}
- Furst DE, Erikson N, Clute L, Koehnke R, Burmeister LF, Kohler JA. Adverse experience with methotrexate during 176 weeks of a long‐term prospective trial in patients with rheumatoid arthritis. Journal of Rheumatology 1990;17(12):1628‐35. [PubMed] [Google Scholar]
- Furst DE, Koehnke R, Burmeister LF, Kohler J, Cargill I. Increasing methotrexate effect with increasing dose in the treatment of resistant rheumatoid arthritis. Journal of Rheumatology 1989;16(3):313‐20. [PubMed] [Google Scholar]
Jiang 1998 {published data only}
- Jiang LD, Wang JY, Mei ZW, Ni LQ. Clinical effectiveness of methotrexate treatment in rheumatoid arthritis patients: a randomized controlled trial. Chinese Journal of Rheumatology 1998;4:204‐7. [Google Scholar]
Pinheiro 1993 {published data only}
- Pinheiro GR, Helfenstein Junior M, Ferraz MB, Atra E. [A short‐term randomized controlled study with methotrexate in rheumatoid arthritis]. [Portuguese]. Revista Da Associacao Medica Brasileira 1993;39(2):91‐4. [PubMed] [Google Scholar]
Strand 1999 (ULTRA) {published data only}
- Schiff MH. Leflonomide versus methotrexate: A comparison of the European and American experience. Scandinavian Journal of Rheumatology 1999;28 Suppl 112:31‐5. [DOI] [PubMed] [Google Scholar]
- Sharp JT, Strand V, Leung H, Hurley F, Loew‐Friedrich I. Treatment with leflunomide slows radiographic progression of rheumatoid arthritis: results from three randomized controlled trials of leflunomide in patients with active rheumatoid arthritis. Leflunomide Rheumatoid Arthritis Investigators Group. Arthritis and Rheumatism 2000;43(3):495‐505. [PUBMED: 10728741] [DOI] [PubMed] [Google Scholar]
- Strand V, Cohen S, Schiff M, Weaver A, Fleischmann R, Cannon G, et al. Treatment of active rheumatoid arthritis with leflunomide compared with placebo and methotrexate. Leflunomide Rheumatoid Arthritis Investigators Group. Archives of Internal Medicine 1999;159(21):2542‐50. [PUBMED: 10573044] [DOI] [PubMed] [Google Scholar]
- Strand V, Tugwell P, Bombardier C, Maetzel A, Crawford B, Dorrier C, et al. Function and health‐related quality of life: results from a randomized controlled trial of leflunomide versus methotrexate or placebo in patients with active rheumatoid arthritis. Leflunomide Rheumatoid Arthritis Investigators Group. Arthritis and Rheumatism 1999;42(9):1870‐8. [PUBMED: 10513801] [DOI] [PubMed] [Google Scholar]
- Tugwell P, Wells G, Strand V, Maetzel A, Bombardier C, Crawford B, et al. Clinical improvement as reflected in measures of function and health‐related quality of life following treatment with leflunomide compared with methotrexate in patients with rheumatoid arthritis: sensitivity and relative efficiency to detect a treatment effect in a twelve‐month, placebo‐controlled trial. Leflunomide Rheumatoid Arthritis Investigators Group. Arthritis and Rheumatism 43;3:506‐14. [PUBMED: 10728742] [DOI] [PubMed] [Google Scholar]
Weinblatt 1985 {published data only}
- Weinblatt ME, Coblyn JS, Fox DA, Fraser PA, Holdsworth DE, Glass DN, Trentham DE. Efficacy of low‐dose methotrexate in rheumatoid arthritis. New England Journal of Medicine 1985;312(13):818‐22. [DOI] [PubMed] [Google Scholar]
Williams 1985 {published data only}
- Alarcon GS, Billingsley LM, Clegg DO, Hardin JG, Klippel, Luggen ME, et al. Lack of association between HLA‐DR2 and clinical response to methotrexate in patients with rheumatoid arthritis. Arthritis and Rheumatism 1987;30(2):218‐20. [DOI] [PubMed] [Google Scholar]
- Tugwell P, Bombardier C, Buchanan WW, Goldsmith C, Grace E, Bennett KJ, et al. Methotrexate in rheumatoid arthritis. Impact on quality of life assessed by traditional standard‐item and individualized patient preference health status questionnaires. Archives of Internal Medicine 1990;150(150):59‐62. [DOI] [PubMed] [Google Scholar]
- Williams HJ, Willkens RF, Samuelson CO Jr, Alarcon GS, Guttadauria M, Yarboro C, et al. Comparison of low‐dose oral pulse methotrexate and placebo in the treatment of rheumatoid arthritis. A controlled clinical trial. Arthritis and Rheumatism 1985;28(7):721‐30. [DOI] [PubMed] [Google Scholar]
References to studies excluded from this review
Cannon 1990 {published data only}
- Cannon GW, Reading JC, Ward JR, Blonquist LJ, Collette LB. Clinical and laboratory outcomes during the treatment of rheumatoid arthritis with methotrexate. Scandinavian Journal of Rheumatology 1990;19:285‐94. [DOI] [PubMed] [Google Scholar]
Cohen 2001 {published data only}
- Cohen S, Cannon GW, Schiff M, Weaver A, Fox R, Olsen N, et al. Two‐year, blinded, randomized, controlled trial of treatment of active rheumatoid arthritis with leflunomide compared with methotrexate. Utilization of Leflunomide in the Treatment of Rheumatoid Arthritis Trial Investigator Group. Arthritis and Rheumatism 2001;44(9):1984‐92. [PUBMED: 11592358] [DOI] [PubMed] [Google Scholar]
Jones 2010 (AMBITION) {published data only}
- Jones G, Sebba A, Gu J, Lowenstein MB, Calvo A, Gomez‐Reino JJ, et al. Comparison of tocilizumab monotherapy versus methotrexate monotherapy in patients with moderate to severe rheumatoid arthritis: the AMBITION study. Annals of the Rheumatic Diseases 2010;69(1):88‐96. [PUBMED: 19297346] [DOI] [PMC free article] [PubMed] [Google Scholar]
Szanto 1986 {published data only}
- Szanto E. Low‐dose methotrexate in rheumatoid arthritis: effect and tolerance. An open trial and a double‐blind randomized study. Scandinavian Journal of Rheumatology 1986;15:97‐102. [DOI] [PubMed] [Google Scholar]
Thompson 1984 {published data only}
- Thompson RN, Watts C, Edelman J, Esdaile J, Russell AS. A controlled two‐centre trial of parenteral methotrexate therapy for refractory rheumatoid arthritis. Journal of Rheumatology 1984;11:760‐3. [PubMed] [Google Scholar]
Weinblatt 1998 {published data only}
- Weinblatt ME, Maier AL, Fraser PA, Coblyn JS. Longterm prospective study of methotrexate in rheumatoid arthritis: conclusion after 132 months of therapy. Journal of Rheumatology 1998;25(2):238‐42. [PUBMED: 9489813] [PubMed] [Google Scholar]
Additional references
Aga 2013
- Aga AB, Lie E, Uhlig T, Olsen IC, Wierød A, Kalstad S, et al. Time trends in disease activity, response and remission rates in rheumatoid arthritis during the past decade: results from the NOR‐DMARD study 2000‐2010. Annals of the Rheumatic Diseases 2013;Nov 27:epub. [doi: 10.1136/annrheumdis‐2013‐204020; PUBMED: 24285493] [DOI] [PubMed] [Google Scholar]
Cates 2008
- Visual Rx [Computer program]. Version 3.. Dr. Christopher Cates EBM web site 2008:URL: http://www.nntonline.net.
Dickersin 1994
- Dickersin K, Scherer R, Lefebvre C. Identifying relevant studies for systematic reviews. BMJ 1994;309:1286‐91. [DOI] [PMC free article] [PubMed] [Google Scholar]
Felson 1992
- Felson DT, Anderson JJ, Meenan RF. Use of short‐term efficacy/toxicity tradeoffs to select second‐line drugs in rheumatoid arthritis. A meta‐analysis of published clinical trials. Arthritis and Rheumatism 1992;35:1117‐25. [DOI] [PubMed] [Google Scholar]
Felson 1993
- Felson DT, Anderson JJ, Boers M, et al. The American College of Rheumatology preliminary core set of disease activity measures for rheumatoid arthritis clinical trials. Arthritis and Rheumatism 1993;36:729‐40. [DOI] [PubMed] [Google Scholar]
Felson 1995
- Felson DT, Anderson JJ, Boers M, et al. American College of Rheumatology preliminary definition of improvement in rheumatoid arthritis. Arthritis and Rheumatism 1995;38:727‐35. [DOI] [PubMed] [Google Scholar]
Gotzsche 1992
- Gøtzsche PC, Pødenphant J, Olesen M, Halberg P. Meta‐analysis of second‐line antirheumatic drugs: sample size bias and uncertain benefit. Journal of Clinical Epidemiology 1992;45(6):587‐94. [PUBMED: 1535101] [DOI] [PubMed] [Google Scholar]
Groff 1983
- Groff BD, Shenberger KN, Wilke WS, Taylor TH. Low dose oral methotrexate in rheumatoid arthritis: An uncontrolled trial and review of the literature. Seminars in Arthritis and Rheumatism 1983;12:333‐47. [DOI] [PubMed] [Google Scholar]
Gubner 1951
- Gubner R, August S, Ginsburg V. Therapeutic suppression of tissue reactivity.II. Effects of aminopterin in rheumatoid arthritis and psoriasis. American Journal of Medicine 1951;221(2):176‐82. [PubMed] [Google Scholar]
Higgins 2011
- Higgins JPT, Altman DG, Sterne JAC (editors). Chapter 8: Assessing risk of bias in included studies. In: Higgins JPT, Green S (editors), Cochrane Handbook for Systematic Reviews of InterventionsVersion 5.1.0 (updated March 2011). The Cochrane Collaboration 2011;Available from www.cochrane‐handbook.org.:Accessed on: 09/16/2013. [Google Scholar]
Jadad 1996
- Jadad A, Moore A, Carrol D, et al. Assessing the quality of reports of randomized trials: is blinding necessary?. Controlled Clinical Trials 1996;17:1‐12. [DOI] [PubMed] [Google Scholar]
Kapral 2006
- Kapral T, Stamm T, Machold KP, Montag K, Smolen JS, Aletaha D. Methotrexate in rheumatoid arthritis is frequently effective, even if re‐employed after a previous failure. Arthritis Research & Therapy 2006;8(2):R46. [PUBMED: 16507172] [DOI] [PMC free article] [PubMed] [Google Scholar]
Kazis 1989
- Kazis LEE, Anderson JJ, Meenan RF. Effect sizes for interpreting changes in health status. Medical Care 1989;27(S3):S178‐89. [DOI] [PubMed] [Google Scholar]
Mueller 2007
- Mueller PS1, Montori VM, Bassler D, Koenig BA, Guyatt GH. Ethical issues in stopping randomised trials early because of apparent benefit. Annals of Internal Medicine 2007;146(12):878‐81. [PUBMED: 17577007] [DOI] [PubMed] [Google Scholar]
OMERACT 1993
- OMERACT. Conference on Outcome Measures in Rheumatoid Arthritis Clinical Trials. Journal of Rheumatology 1993;20:526‐91. [PubMed] [Google Scholar]
Petitti 1994
- Petitti D. Meta‐analysis, decision analysis, and cost‐effectiveness analysis: methods for quantitative synthesis in medicine. Meta‐analysis, decision analysis, and cost‐effectiveness analysis: methods for quantitative synthesis in medicine. New York: Oxford University Press, 1994:90‐114. [Google Scholar]
Shea 2003
- Shea B, Swinden MV, Tanjong Ghogomu E, Ortiz Z, Katchamart W, Rader T, et al. Folic acid and folinic acid for reducing side effects in patients receiving methotrexate for rheumatoid arthritis. Cochrane Database of Systematic Reviews 2013;5(CD000951):doi: 10.1002/14651858.CD000951.pub2.. [PUBMED: 23728635] [DOI] [PMC free article] [PubMed] [Google Scholar]
Shea 2013
- Shea B, Swinden MV, Tanjong Ghogomu E, Ortiz Z, Katchamart W, Rader T, et al. Folic acid and folinic acid for reducing side effects in patients receiving methotrexate for rheumatoid arthritis. Cochrane Database of Systematic Reviews 2013;5:CD000951. [DOI: 10.1002/14651858.CD000951.pub2] [DOI] [PMC free article] [PubMed] [Google Scholar]
Singh 2012
- Singh JA, Furst DE, Bharat A, Curtis JR, Kavanaugh AF, Kremer JM, et al. 2012 update of the 2008 American College of Rheumatology recommendations for the use of disease‐modifying antirheumatic drugs and biologic agents in the treatment of rheumatoid arthritis. Arthritis Care and Research (Hoboken) 2012;64(5):625‐39. [DOI] [PMC free article] [PubMed] [Google Scholar]
Smolen 2013
- Smolen JS, Landewé R, Breedveld FC, Buch M, Burmester G, Dougados M, et al. EULAR recommendations for the management of rheumatoid arthritis with synthetic and biological disease‐modifying antirheumatic drugs: 2013 update. Annals of the Rheumatic Diseases 2013;Oct 25:doi: 10.1136/annrheumdis‐2013‐204573. [DOI] [PMC free article] [PubMed] [Google Scholar]
Steinsson 1982
- Steinsson K, Weinstein A, Korn J, Abeles M. Low dose methotrexate in rheumatoid arthritis. Journal of Rheumatology 1982;9:860‐6. [PubMed] [Google Scholar]
Todoerti 2013
- Todoerti M, Maglione W, Bernero E, Bortoluzzi A, Colaci M, Galuppi E, et al. Systematic review of 2008‐2012 literature and update of recommendations for the use of methotrexate in rheumatic diseases, with a focus on rheumatoid arthritis. Reumatismo 2013;65(5):207‐18. [PUBMED: 24399184] [DOI] [PubMed] [Google Scholar]
van der Heijde 2005
- Heijde D, Klareskog L, Boers M, Landewe R, Codreanu C, Bolosiu HD. Comparison of different definitions to classify remission and sustained remission: 1 year TEMPO results. Annals of the Rheumatic Diseases 2005;64:1582–7. [DOI] [PMC free article] [PubMed] [Google Scholar]
van der Heijde 2007
- Heijde D, Klareskog L, Landewé R, Bruyn GA, Cantagrel A, Durez P, et al. Disease remission and sustained halting of radiographic progression with combination etanercept and methotrexate in patients with rheumatoid arthritis. Arthritis and Rheumatism 2007;56(1):3928‐39. [PUBMED: 18050208] [DOI] [PubMed] [Google Scholar]
Weinstein 1985
- Weinstein A, Marlowe S, Korn J, Farouhar F. Low‐dose methotrexate treatment of rheumatoid arthritis. Long‐term observations. American Journal of Medicine 1985;79(3):331‐7. [PUBMED: 4036984] [DOI] [PubMed] [Google Scholar]
Willkens 1980
- Willkens RF, Watson MA, Paxson CS. Low dose pulse methotrexate therapy in rheumatoid arthritis. Journal of Rheumatology 1980;7:501‐5. [PubMed] [Google Scholar]


