Abstract
A combination of X-ray ptychography and X-ray fluorescence tomography (XRF) has been used to study the fragmentation behavior of an individual Ziegler–Natta catalyst particle, ∼40 μm in diameter, in the early stages of propylene polymerization with submicron spatial resolution. The electron density signal obtained from X-ray ptychography gives the composite phases of the Ziegler–Natta catalyst particle fragments and isotactic polypropylene, while 3-D XRF visualizes multiple isolated clusters, rich in Ti, of several microns in size. The radial distribution of Ti species throughout the polymer–catalyst composite particle shows that the continuous bisection fragmentation model is the main contributor to the fragmentation pathway of the catalyst particle as a whole. Furthermore, within the largest Ti clusters the fragmentation pathway was found to occur through both the continuous bisection and layer-by-layer models. The fragmentation behavior of polyolefin catalysts was for the first time visualized in 3-D by directly imaging and correlating the distribution of the Ti species to the polymer–catalyst composite phase.
Ziegler–Natta catalysts are considered to be the grand work horses for the production of polyolefins, such as polyethylene and isotactic polypropylene (iPP), a market of which the total volume exceeds 160 million tonnes produced annually.1 Current generation Ziegler–Natta catalysts are typically based on a highly porous MgCl2 support, chemisorbed TiCl4 as the active site precursor and a trialkylaluminum cocatalyst. In the case of iPP production Lewis base molecules, such as diesters and diethers, and silanes, are added to enhance the activity and stereoselectivity of the Ti active site species.1,2 To ensure good and continuous reactor operability on such large scales, discrete polymer particle formation is crucial and therefore requires heterogeneous catalysts.2
However, due to the formation of polymer on the catalyst particle’s surface, monomer diffusion to the active site can become severely limited and a fragmentation of the catalyst particle’s framework is required to sustain polymerization activity.1−5 The formation of the polyolefin at the Ti active site within the porous framework leads to a buildup of stress and force exerted on the framework finally resulting in the fragmentation of the framework.6 The fragmentation behavior of the catalyst particles is an interplay of the properties of the catalyst framework in terms of not only pore size, pore size distribution, and lattice strength but also crystallinity of the polymer product.7 The fragmentation behavior, as typically studied with cross-sectional electron microscopy techniques, is considered to be a mixture of two limiting modes of fragmentation. The first fragmentation model is called shrinking core or layer-by-layer, with fragmentation starting at the outer particle surface by peeling off framework species until the core is reached. The second fragmentation model is called continuous bisection where the breakup of the particle occurs through internal cleavage at the particle’s core into successively smaller fragments (see Figure S1).7−9 However, a powerful experimental toolbox for a full 3-D study on the fragmentation behavior is lacking while this stage in the polymerization reaction has direct consequences on the polymerization rate and more importantly the evolution of the particle morphology.7−16
Pioneering work on the use of synchrotron radiation for the imaging of both polyethylene and polypropylene particles was done with X-ray computed microtomography (CMT).17−22 However, these studies have focused on the polymer phases with 3-D voxel sizes of several microns therefore neglecting the role of the catalyst fragmentation stage occurring at significantly smaller size scales, i.e. on the order of submicron to a few tens of microns.
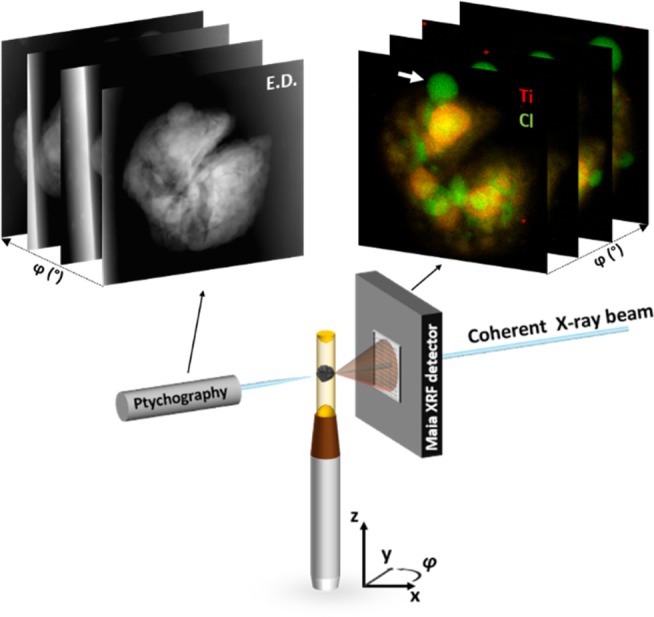
To tackle this length-scale gap we have focused in this work on the combination of two powerful X-ray nano-tomography microscopy techniques, namely 3-D X-ray ptychography and X-ray fluorescence (XRF) imaging to correlate the elemental distribution of Ti, comprising the active site species, to the fragmentation behavior of an individual Ziegler–Natta propylene polymerized catalyst particle in the early stages of polymerization. Significant progress has been made over the past years in the field of X-ray imaging of full catalyst particles such as for Fluid Catalytic Cracking and Fischer–Tropsch Synthesis processes by pushing the spatial resolution into the nanometer regime. Furthermore, besides absorption-contrast based X-ray microscopy there is now also the possibility for (correlated-) 3-D chemical, elemental, and diffraction imaging.23−38 X-ray ptychography is a coherent diffraction imaging technique that provides quantitative information about the phase changes introduced by the object,39 whereas 3-D XRF imaging gives the spatial distribution of elements of interest, such as the Ti (Kα1 4510 eV) and Cl (Kα1 2622 eV) species for a Ziegler–Natta catalyst. The X-ray ptychography and fluorescence nanotomographs are collected simultaneously by raster-scanning a single propylene polymerized Ziegler–Natta catalyst particle at low polymer yields of ∼9 g iPP/g catalyst (Figure 1) with a highly coherent X-ray beam focused down to 160 nm × 140 nm (H × V) at 12 keV. Additional information about the methodology of sealing the particles inside a polyimide capillary is available in the Supporting Information.
Figure 1.

Schematic layout of the combined 3-D X-ray ptychography and fluorescence imaging setup at the P06 beamline at PETRA III. The 2-D projections of electron density, E.D., in greyscale and elemental distribution of Ti (red) and Cl (green) are obtained from, respectively, the X-ray ptychographic and fluorescence imaging at different angles by mounting a single polymerized Ziegler–Natta catalyst particle on a rotation stage. The white arrow indicates a region, rich in Cl and poor in Ti signal, on the particle’s external surface.
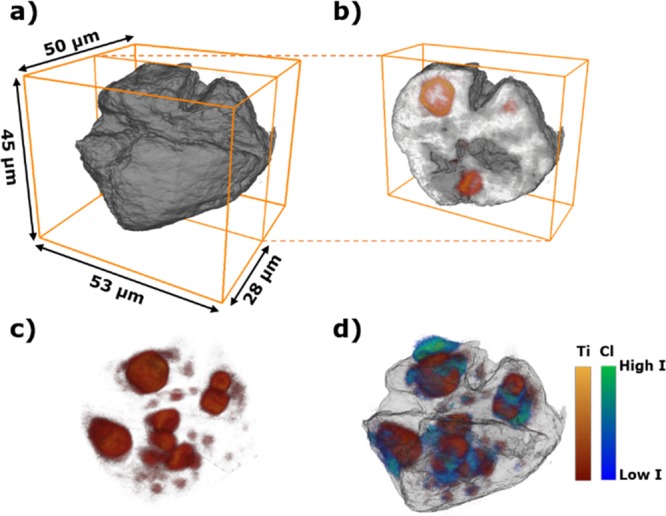
Ziegler–Natta catalysts are highly sensitive to moisture and air making them considerably more challenging to measure. Indeed, morphology changes as a function of X-ray beam exposure were observed over time, which limited the useable 2-D projections in this work to 70 leading to an average collection angle spacing of ∼4.3°. Interestingly, these changes were correlated to the Cl-rich bubbles observed in Figure 1 (indicated by the white arrow), absent in Ti signal, and the possible origin is discussed in the Supporting Information. In Figure 2, the reconstructed 3-D volume rendering of the electron density showing the polymer–catalyst composite phase and Ti and Cl elemental distributions are visualized. The electron density tomograph shows two major cracks through the center of the catalyst particle. Complementary Scanning Electron Microscopy (SEM) data, given in Figures S2–S3, show that these cracks are present in both the pristine and polymerized catalyst particles and originate from the final drying step in the catalyst synthesis. The combination of X-ray ptychography and XRF shows that there are isolated clusters rich in Ti and Cl, which are encapsulated by the formed iPP. The mismatch in the overlay of the Ti and Cl elemental distributions is most likely due to strong beam-induced morphology changes in the Cl signal, whereas the Ti signal is significantly more stable. For this reason, the focus for the fragmentation behavior is centered on the Ti species, which are epitaxially chemisorbed on the unsaturated lateral surfaces of the MgCl2 primary crystals (see Figure S5 for further discussion). The achieved 3-D resolution was estimated by fitting multiple line profiles, due to the limited amount of 2-D projections because of beam-induced morphology changes, and was found to be on the order of 400 nm for the ptychography data set and 600 nm for the Ti XRF data set (see Figures S6, S7).
Figure 2.

Reconstructed 3-D volume rendering of a propylene polymerized Ziegler–Natta catalyst particle, ∼41 μm in diameter. (a) Electron density reconstruction (gray scale) with a voxel size of 43.2 × 43.2 × 43.2 nm3. (b) Extracted volume showing the position of the Ti species (in red) within the polymer–catalyst composite particle. (c) Elemental distribution of the Ti species (red color map) with a voxel size of 150 × 150 × 150 nm3. (d) Elemental distribution of Ti and Cl (in green) within the composite particle (only external surface rendered).
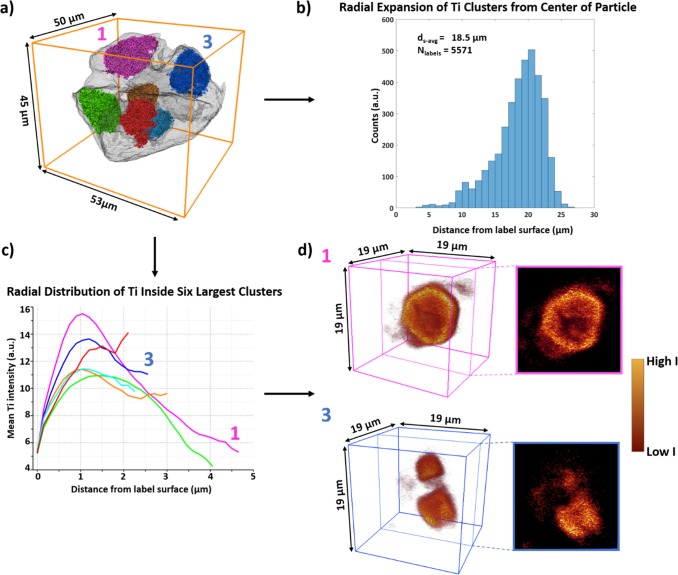
As the polymerization of propylene starts, the framework begins to break up and these catalyst fragments or clusters will expand radially in conjunction with the growing polymer phase.16 For the imaged composite particle the Ti clusters were segmented and labeled in the 3-D data set so that the radial expansion of each Ti cluster label, referred to as label, from the center of the composite particle could be computed. In Table 1, the distances of the six largest labels, visualized in Figure 3a using the same color coding, with respect to the center of the composite particle are given. The average distances of the center, dc, and surface, ds, of these six labels with respect to the center of the composite particles are, respectively, 14.6 and 7.7 μm with the latter value correcting for the irregular size and shape of each label. The separation of these clusters from each other is due to the internal cleavage of the catalyst particle caused by the formed polymer as described by the continuous bisection model.
Table 1. Volume, V, and the Distance from the Center, dc, and Surface, ds, of the Six Largest Ti Cluster Labels with Respect to the Center of the Composite Particle.
| Ti cluster label | V (μm3) | dc (μm) | ds (μm) |
|---|---|---|---|
| 1. Pink | 1449 | 15.7 | 8.5 |
| 2. Green | 1155 | 16.8 | 10.0 |
| 3. Blue | 794 | 16.9 | 9.4 |
| 4. Orange | 486 | 12.4 | 4.9 |
| 5. Cyan | 411 | 11.6 | 5.3 |
| 6. Red | 380 | 14.4 | 8.0 |
Figure 3.
(a) The six largest Ti cluster labels (Table 1 color coding) shown within the composite particle surface rendering. (b) Histogram showing the distance from the surface, ds, of all labels larger than 4 voxels in volume (5571 labels) with respect to the composite particle’s center. (c) The radial distribution of Ti within the six largest labels is calculated as a function of the mean Ti intensity from the surface of each corresponding label toward the center voxels. (d) 3-D cut-throughs and 2-D extracted slices of the Ti clusters within respectively label #1 pink and label #3 blue visualizing the fragmentation behavior.
The histogram in Figure 3b shows the distance of the surface of each label (larger than 4 voxels due to the estimated 3-D resolution) from the center of the composite particle. While the six largest labels account for over 85% of the total segmented Ti XRF 3-D volume, there are 5571 labels in total of which most are only several voxels in volume as shown in Figure S10. The presence of so many small labels, of which 5443 labels have a volume smaller than 0.135 μm3 or 40 voxels in size, that are also on average 18.5 μm away from the center of the composite particle shows that the layer-by-layer fragmentation model is also occurring throughout the composite particle as these smaller labels must originate from the surfaces of the six largest labels.
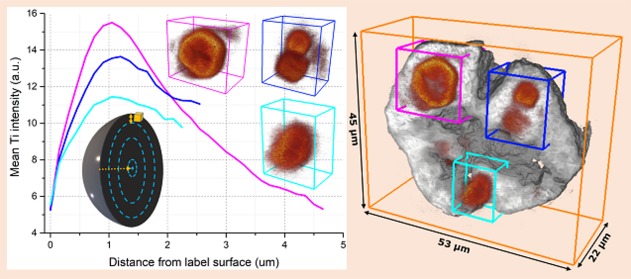
The fragmentation behavior of the Ti clusters within each of the six largest labels was also investigated. This was done by calculating the radial distribution of Ti within the labels and visualizing the cut-throughs of the Ti clusters within these labels (Figure 3c–d). All labels, with the exception of the red label, show a similar behavior with a maximum in the mean Ti intensity as we move ∼1 μm from the label’s surface toward the interior followed by a decay in the intensity as the center voxels are reached. Visualized cut-throughs and the corresponding extracted 2-D slices of the labels #1 pink and #3 blue (Figure 3d) confirm the observations made with the calculated radial distribution of Ti. For the pink label, first a diffuse cloud of Ti is observed at the label’s surface followed by a clear and highly intense edge of the Ti cluster within the label and finally a lower intensity of Ti inside the core of these clusters where even clear cracks can be observed. Interestingly, there is not one single larger cluster inside the blue label but instead two subclusters that are likely to have been separated from each other through internal cleavage at an earlier polymerization stage than what we captured here. The depletion of Ti at the core shows that also within these clusters internal cleavage is playing a significant role in the fragmentation process, whereas the diffuse Ti cloud is due to the peeling-off framework species as polymer is also being formed on the clusters surface. A further discussion and visualization on the fragmentation behavior of all of the six largest cluster labels is found in the Supporting Information (Table S2 and Figures S11–12).
In conclusion, we have shown the strength of correlated 3-D X-ray ptychography and X-ray fluorescence to investigate the fragmentation behavior of individual polyolefin catalyst particles in the early stages of α-olefin polymerization with submicron 3-D spatial resolution. Both the experimental and analytical toolboxes shown here on the highly air- and moisture-sensitive Ziegler–Natta catalysts are directly applicable to all olefin polymerization catalyst types such as the immobilized metallocenes and provide a route for researchers to find structure–activity–polymer product relationships that could ultimately lead to rational catalyst designing for specific polymer grades. The calculated expansion of the Ti clusters from the center of the polymer–catalyst composite particle and the radial distribution of Ti within the six Ti largest clusters show that while both fragmentation models, shrinking core and continuous bisection, are present, the continuous bisection is dominating under these specific experimental conditions.3−5,7−9 Therefore, to the best knowledge of the authors it was demonstrated for the first time in 3-D while directly obtaining the elemental distribution of all Ti species how this Ziegler–Natta catalyst-type behaves in the early stages of α-olefin polymerization.
Acknowledgments
We acknowledge DESY (Hamburg, Germany), a member of the Helmholtz Association HGF, for the provision of experimental facilities. Parts of this research were carried out at PETRA III. We would like to thank Dennis Brückner (Universität Hamburg), Dr. Matthias Alfeld (TU Delft), and Max Werny (Utrecht University, UU) for assistance in using the P06 microprobe beamline; Robert Chan (SABIC) for performing SEM measurements; and Dr. Martin Veselý (UU, UCT Prague) and Dr. John Severn (DSM Materials Science Center) for helpful discussions. This research was supported in part through the Maxwell computational resources operated at Deutsches Elektronen-Synchrotron (DESY), Hamburg, Germany. This work was funded by The Netherlands Organization for Scientific Research (NWO) in the frame of a NWO-TA grant (No. 731.015.203) with SABIC, DSM Resolve, and the University of Maastricht and a VIDI grant (No. 723.015.007).
Supporting Information Available
The Supporting Information is available free of charge at https://pubs.acs.org/doi/10.1021/jacs.9b13485.
The authors declare no competing financial interest.
Supplementary Material
References
- Kaminsky W., Ed. Polyolefins: 50 years after Ziegler and Natta I; Springer: Berlin, 2013. [Google Scholar]
- Severn J.; Jones R. J.. Stereospecific α-Olefin Polymerization with Heterogeneous Catalysts. In Handbook of Transition Metal Polymerization Catalysts; Hoff R., Ed.; John Wiley & Sons, Inc.: Hoboken, NJ, 2018. [Google Scholar]
- Ferrero M. A.; Chiovetta M. G. Catalyst fragmentation during propylene polymerization: Part I. The effects of grain size and structure. Polym. Eng. Sci. 1987, 27, 1436–1447. 10.1002/pen.760271903. [DOI] [Google Scholar]
- Ferrero M. A.; Chiovetta M. G. Catalyst fragmentation during propylene polymerization: Part II. Microparticle diffusion and reaction effects. Polym. Eng. Sci. 1987, 27, 1448–1460. 10.1002/pen.760271904. [DOI] [Google Scholar]
- Ferrero M. A.; Chiovetta M. G. Catalyst fragmentation during propylene polymerization: Part III. Bulk polymerization process simulation. Polym. Eng. Sci. 1991, 31, 886–903. 10.1002/pen.760311208. [DOI] [Google Scholar]
- Grof Z.; Kosek J.; Marek M. Modelling of morphogenesis of growing polyolefin particles. AIChE J. 2005, 51, 2048–2067. 10.1002/aic.10549. [DOI] [Google Scholar]
- Zheng X.; Loos J. Morphology Evolution in the Early Stages of Olefin Polymerization. Macromol. Symp. 2006, 236, 249–258. 10.1002/masy.200690063. [DOI] [Google Scholar]
- Horácková B.; Grof Z.; Kosek J. Dynamics of fragmentation of catalyst carries in catalytic polymerization of olefins. Chem. Eng. Sci. 2007, 62, 5264–5270. 10.1016/j.ces.2007.03.022. [DOI] [Google Scholar]
- Pater J. T. M.; Weickert G.; Loos J.; van Swaaij W. P. M. High precision prepolymerization of propylene at extremely low reaction rates—kinetics and morphology. Chem. Eng. Sci. 2001, 56, 4107–4120. 10.1016/S0009-2509(01)00081-1. [DOI] [Google Scholar]
- Laurence R. L.; Chiovetta M. G. In Polymer Reaction Engineering; Reicher K. H., Geisler G., Eds.; Hasuer-Verlag: München, 1983; pp 74–112. [Google Scholar]
- Fink G.; Steinmetz B.; Zechlin J.; Przybyla C.; Tesche B. Propylene Polymerization with Silica-Supported Metallocene/MAO Catalysts. Chem. Rev. 2000, 100, 1377–1390. 10.1021/cr9804689. [DOI] [PubMed] [Google Scholar]
- Weickert G.; Meier G. B.; Pater J. T. M.; Westerterp K. R. The particle as microreactor: Catalytic propylene polymerizations with supported metallocenes and Ziegler-Natta catalysts. Chem. Eng. Sci. 1999, 54, 3291–3296. 10.1016/S0009-2509(98)00441-2. [DOI] [Google Scholar]
- Hammawa H.; Wanke S. E. Influence of support friability and concentration of a-olefins on gas-phase ethylene polymerization over polymer-supported metallocene/methylaluminoxane catalysts. J. Appl. Polym. Sci. 2007, 104, 514–527. 10.1002/app.25527. [DOI] [Google Scholar]
- Rönkkö H.-L.; Korpela T.; Knuuttila H.; Pakkanen T. T.; Denifl P.; Leinonen T.; Kemell M.; Leskelä M. Particle growth and fragmentation of solid self-supported Ziegler-Natta-type catalysts in propylene polymerization. J. Mol. Catal. A: Chem. 2009, 309, 40–49. 10.1016/j.molcata.2009.04.013. [DOI] [Google Scholar]
- Abboud M.; Denifl P.; Reichert K.-H. Fragmentation of Ziegler-Natta Catalyst Particles During Propylene Polymerization. Macromol. Mater. Eng. 2005, 290, 558–564. 10.1002/mame.200500049. [DOI] [Google Scholar]
- McKenna T. F. L.; Di Martino A.; Weickert G.; Soares J. B. P. Particle Growth During the Polymerisation of Olefins on Supported Catalysts, 1 – Nascent Polymer Structures. Macromol. React. Eng. 2010, 4, 40–64. 10.1002/mren.200900025. [DOI] [Google Scholar]
- Conner W. C.; Webb S. W.; Spanne P.; Jones K. W. Use of X-ray microscopy and synchrotron microtomography to characterize polyethylene polymerization particles. Macromolecules 1990, 23, 4742–4747. 10.1021/ma00224a002. [DOI] [Google Scholar]
- Ferrero M. A.; Sommer R.; Spanne P.; Jones K. W.; Conner W. C. X-ray microtomography studies of nascent polyolefin particles polymerized over magnesium chloride-supported catalysts. J. Polym. Sci., Part A: Polym. Chem. 1993, 31, 2507–2512. 10.1002/pola.1993.080311011. [DOI] [Google Scholar]
- Jones K. W.; Spanne P.; Lindquist W. B.; Conner W. C.; Ferrero M. Determination of polymerization particle morphology using synchrotron computed microtomography. Nucl. Instrum. Methods Phys. Res., Sect. B 1992, 68, 105–110. 10.1016/0168-583X(92)96059-8. [DOI] [Google Scholar]
- Boden S.; Bieberle M.; Weickert G.; Hampel U. Three-dimensional analysis of macroporosity distributions in polyolefin particles using X-ray microtomography. Powder Technol. 2008, 188, 81–88. 10.1016/j.powtec.2008.03.018. [DOI] [Google Scholar]
- Seda L.; Zubov A.; Bobak M.; Kosek J.; Kantzas A. Transport and Reaction Characteristics of Reconstructed Polyolefin Particles. Macromol. React. Eng. 2008, 2, 495–512. 10.1002/mren.200800026. [DOI] [Google Scholar]
- Meisterová L.; Zubov A.; Smolná K.; Štěpánek F. Kosek, X-ray Tomography Imaging of Porous Polyolefin Particles in an Electron Microscope. Macromol. React. Eng. 2013, 7, 277–288. 10.1002/mren.201300002. [DOI] [Google Scholar]
- Cats K. H.; Gonzalez-Jimenez I. D.; Liu Y.; Nelson J.; Van Campen D.; Meirer F.; van der Eerden A. M. J.; De Groot F. M. F.; Andrews J. C.; Weckhuysen B. M. X-ray nanoscopy of cobalt Fischer–Tropsch catalysts at work. Chem. Commun. 2013, 49, 4622–4624. 10.1039/c3cc00160a. [DOI] [PubMed] [Google Scholar]
- Bare S. R.; Charochak M. E.; Kelly S. D.; Lai B.; Wang J.; Chen-Wiegart Y. K. Characterization of a Fluidized Catalytic Cracking Catalyst on Ensemble and Individual Particle Level by X-ray Micro- and Nanotomography, Micro-X-ray Fluorescence, and micro-X-ray Diffraction. ChemCatChem 2014, 6, 1427–1437. 10.1002/cctc.201300974. [DOI] [Google Scholar]
- Beale A. M.; Jacques S. D. M.; Gibson E. K.; Di Michiel M. Progress towards five dimensional diffraction imaging of functional materials under process conditions. Coord. Chem. Rev. 2014, 277, 208–223. 10.1016/j.ccr.2014.05.008. [DOI] [Google Scholar]
- Price S. W. T.; Ignatyev K.; Geraki K.; Basham M.; Filik J.; Vo N. T.; Witte P. T.; Beale A. M.; Mosselmans J. F. W. Chemical imaging of single catalyst particles with scanning μ-XANES-CT and μ-XRF-CT. Phys. Chem. Chem. Phys. 2015, 17, 521–529. 10.1039/C4CP04488F. [DOI] [PubMed] [Google Scholar]
- Meirer F.; Morris D. T.; Kalirai S.; Liu Y.; Andrews J. C.; Weckhuysen B. M. Mapping Metals Incorporation of a Whole Single Catalyst Particle Using Element Specific X-ray Nanotomography. J. Am. Chem. Soc. 2015, 137, 102–105. 10.1021/ja511503d. [DOI] [PMC free article] [PubMed] [Google Scholar]
- Meirer F.; Kalirai S.; Morris D.; Soparawalla S.; Liu Y.; Mesu G.; Andrews J. C.; Weckhuysen B. M. Life and death of a single catalytic cracking particle. Sci. Adv. 2015, 1, e1400199 10.1126/sciadv.1400199. [DOI] [PMC free article] [PubMed] [Google Scholar]
- Baier S.; Damsgaard C. D.; Scholz M.; Benzi F.; Rochet A.; Hoppe R.; Scherer T.; Shi J.; Wittstock A.; Weinhausen B.; Wagner J. B.; Schroer C. G.; Grunwaldt J.-D. In-situ Ptychography of Heterogeneous Catalysts using Hard X-rays: High Resolution Imaging at Ambient Pressure and Elevated Temperature. Microsc. Microanal. 2016, 22, 178–188. 10.1017/S1431927615015573. [DOI] [PubMed] [Google Scholar]
- Cats K. H.; Andrews J. C.; Stéphan O.; March K.; Karunakaran C.; Meirer F.; De Groot F. M. F.; Weckhuysen B. M. Active phase distribution changes within a catalyst particle during Fischer–Tropsch synthesis as revealed by multi-scale microscopy. Catal. Sci. Technol. 2016, 6, 4438–4449. 10.1039/C5CY01524C. [DOI] [Google Scholar]
- Price S. W. T.; Martin D. J.; Parsons A. D.; Sławiński W. A.; Vamvakeros A.; Keylock S. J.; Beale A. M.; Mosselmans J. F. W. Chemical Imaging of Fischer–Tropsch catalysts under operating conditions. Sci. Adv. 2017, 3, e1602838 10.1126/sciadv.1602838. [DOI] [PMC free article] [PubMed] [Google Scholar]
- Ihli J.; Sanchez D. F.; Jacob R. R.; Cuartero V.; Mathon O.; Krumeich F.; Borca C.; Huthwelker T.; Cheng W.-C.; Shu Y.; Pascarelli S.; Grolimund D.; Menzel A.; van Bokhoven J. A. Localization and Speciation of Iron Impurities within a Fluid Catalytic Cracking Catalyst. Angew. Chem., Int. Ed. 2017, 56, 14031–14035. 10.1002/anie.201707154. [DOI] [PubMed] [Google Scholar]
- Ihli J.; Jacob R. R.; Holler M.; Guizar-Sicairos M.; Diaz A.; Da Silva J. C.; Ferreira Sanchez D.; Krumeich F.; Grolimund D.; Taddei M.; Cheng W.-C.; Shu Y.; Menzel A.; Van Bokhoven J. A. A three-dimensional view of structural changes caused by deactivation of fluid catalytic cracking catalysts. Nat. Commun. 2017, 8, 809. 10.1038/s41467-017-00789-w. [DOI] [PMC free article] [PubMed] [Google Scholar]
- Sheppard T. L.; Price S. W. T.; Benzi F.; Baier S.; Klumpp M.; Dittmeyer R.; Schwieger W.; Grunwaldt J.-D. In Situ Multimodal 3D Chemical Imaging of a Hierarchically Structured Core@Shell Catalyst. J. Am. Chem. Soc. 2017, 139, 7855–7863. 10.1021/jacs.7b02177. [DOI] [PubMed] [Google Scholar]
- Vamvakeros A.; Jacques S. D. M.; Di Michiel M.; Matras D.; Middelkoop V.; Ismagilov I. Z.; Matus E. V.; Kuznetsov V. V.; Drnec J.; Senecal P.; Beale A. M. 5D operando tomographic diffraction imaging of a catalyst bed. Nat. Commun. 2018, 9, 4751. 10.1038/s41467-018-07046-8. [DOI] [PMC free article] [PubMed] [Google Scholar]
- Ihli J.; Diaz A.; Shu Y.; Guizar-Sicairos M.; Holler M.; Wakonig K.; Odstrcil M.; Li T.; Krumeich F.; Müller E.; Cheng W.-C.; van Bokhoven J. A.; Menzel A. Resonant Ptychographic Tomography Facilitates Three-Dimensional Quantitative Colocalization of Catalyst Components and Chemical Elements. J. Phys. Chem. C 2018, 122, 22920–22929. 10.1021/acs.jpcc.8b05624. [DOI] [Google Scholar]
- Fam Y.; Sheppard T. L.; Diaz A.; Scherer T.; Holler M.; Wang W.; Wang D.; Brenner P.; Wittstock A.; Grunwaldt J.-D. Correlative Multiscale 3D Imaging of a Hierarchical Nanoporous Gold Catalyst by Electron, Ion and X-ray Nanotomography. ChemCatChem 2018, 10, 2858–2867. 10.1002/cctc.201800230. [DOI] [PMC free article] [PubMed] [Google Scholar]
- Meirer F.; Weckhuysen B. M. Spatial and temporal exploration of heterogeneous catalysts with synchrotron radiation. Nat. Rev. Mater. 2018, 3, 324–340. 10.1038/s41578-018-0044-5. [DOI] [Google Scholar]
- Pfeiffer F. X-ray ptychography. Nat. Photonics 2018, 12, 9–17. 10.1038/s41566-017-0072-5. [DOI] [Google Scholar]
Associated Data
This section collects any data citations, data availability statements, or supplementary materials included in this article.


