Abstract
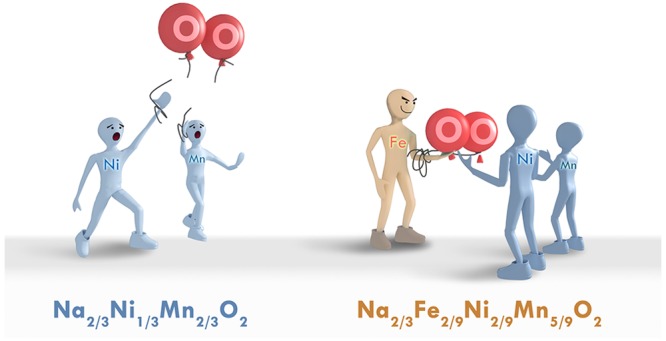
Sodium layered transition metal oxides have been considered as promising cathode materials for sodium ion batteries due to their large capacity and high operating voltage. However, mechanism investigations of chemical evolution and capacity failure at high voltage are inadequate. As a representative cathode, Na2/3Ni1/3Mn2/3O2, the capacity contribution at a 4.2 V plateau has long been assigned to the redox of the Ni3+/Ni4+ couple, while at the same time it suffers large irreversible capacity loss during the initial discharging process. In this work, we prove that the capacity at the 4.2 V plateau is contributed to the irreversible O2–/O2n–/O2 evolution based on in situ differential electrochemical mass spectrometry and density functional theory calculation results. Besides, a phenomenon of oxygen release and subsequent surface lattice densification is observed, which is responsible for the large irreversible capacity loss during the initial cycle. Furthermore, the oxygen release is successfully suppressed by Fe substitution due to the formation of a unique Fe-(O–O) species, which effectively stabilizes the reversibility of the O2–/O2 redox at high operating voltage. Our findings provide a new understanding of the chemical evolution in layered transition metal oxides at high operating voltage. Increasing the covalency of the TM–O bond has been proven to be effective in suppressing the oxygen release and hence improving the electrochemical performance.
Short abstract
A new understanding of the oxygen evolution in layered transition metal oxides is proposed and the reductive coupling mechanism is employed to suppress the oxygen release through increasing the covalency of the TM–O bond.
Introduction
Rechargeable sodium-ion batteries (SIB) are regarded as a highly promising alternative to commercialized lithium-ion batteries (LIB) for grid energy storage applications because of the richer natural abundance and relatively lower cost of Na resources.1−7 Since the discovery of the NaxCoO2 cathode by Delmas in 1981,8 various sodium layered transition metal oxides (NaxTMO2) have been investigated as a Na-ion host.9−13 In 2001, Lu et al. first reported that P2-Na2/3Ni1/3Mn2/3O2 delivered a large capacity (about 165 mAh g–1) with a high operating voltage.14,15 After that, most of following research on Na2/3Ni1/3Mn2/3O2 claimed that the capacity in the voltage range of 2.2 ≤ V ≤ 4.1 (∼85 mAh g–1) is contributed by the Ni2+/Ni3+ redox couple, and the capacity around the 4.2 V long plateau (∼80 mAh g–1) is associated with the Ni3+/Ni4+ couple.16−21 However, this viewpoint has recently been faced with challenges.22,23 In 2017, Ma et al. designed a TM-deficient (TM = transition metal) Na0.78Ni0.23Mn0.69O2 compound (NaxTMyO2, y < 1) and proved that Ni2+ was oxidized to Ni4+ when charged to 4.1 V, while the plateau above 4.2 V was dominated by the O2–/O2n- couple due to TM vacancies.22 In 2018, Risthaus et al. observed the change of oxygen state at 4.5 V in Na2/3Ni1/3Mn2/3O2.23 Therefore, it is necessary to determine the sodium storage mechanism and capacity contribution around the 4.2 V plateau.
Besides, the Na2/3Ni1/3Mn2/3O2 cathode suffers rapid capacity degradation during the charging/discharging process. Numerous research studies focus on the structure evolution, and it is believed that the “P2 → O2 phase transition” is the main reason because it can cause large volume variation (about 20%).16−21,24 Strategies such as element doping17−20,25 or inert layer coating26,27 are commonly used to suppress the phase transition or alleviate the volume change. However, a large irreversible capacity loss still occurs during the initial cycle. Wu et al. designed a Na0.67Ni0.26Zn0.07Mn0.67O2 cathode without the P2 → O2 phase transition and found 14% irreversible capacity loss at the first cycle.25 Liu et al. modified the Na2/3Ni1/3Mn2/3O2 surface with an Al2O3 buffer layer and observed a 16% irreversible capacity sacrifice during the first cycle.26 The TM-deficient Na0.78Ni0.23Mn0.69O2 compound also suffered a 23% irreversible capacity loss at the first cycle.22 It is highly probable that the previous studies on the failure mechanism of Na2/3Ni1/3Mn2/3O2 are not comprehensive. Therefore, understanding the mechanism for this irreversible capacity loss at the initial cycle and solving the capacity degradation problem have become an urgent issue with great significance.
In this work, we present an evident understanding of the chemical evolution in Na2/3Ni1/3Mn2/3O2. We find that the capacity around the 4.2 V plateau is dominated by oxygen redox according to the X-ray photoelectron spectroscopy (XPS) analysis combined with density functional theory (DFT) calculations. Meanwhile, the oxygen release behavior of Na2/3Ni1/3Mn2/3O2 is observed via in situ differential electrochemical mass spectrometry (DEMS). At the high voltage region, the oxygen functions as the electron donor, and the irreversible O2–/O2n–/O2 evolution occurs due to the lack of TM-O hybridization. Significantly, we find that the loss of O2 gas causes surface densification on Na2/3Ni1/3Mn2/3O2 particles. According to the calculated results, this dense surface is not available for Na+ intercalation, resulting in a large irreversible capacity loss at the initial cycle. Accordingly, we propose a highly efficient method to suppress the oxygen release behavior in Na2/3Ni1/3Mn2/3O2 by Fe doping to form Fe-(O–O) species associated with reductive coupling behavior. The well-designed Na2/3Fe2/9Ni2/9Mn5/9O2 SIB cathode material shows an excellent reversibility of the O2–/O2 couple at high operating voltage, which reduces the irreversible capacity loss from 25% to 4% at the initial cycle. The specific energy density is achieved as high as 500 Wh kg–1 with excellent cycling stability.
Results and Discussion
Oxygen Redox Activity in Na2/3Ni1/3Mn2/3O2
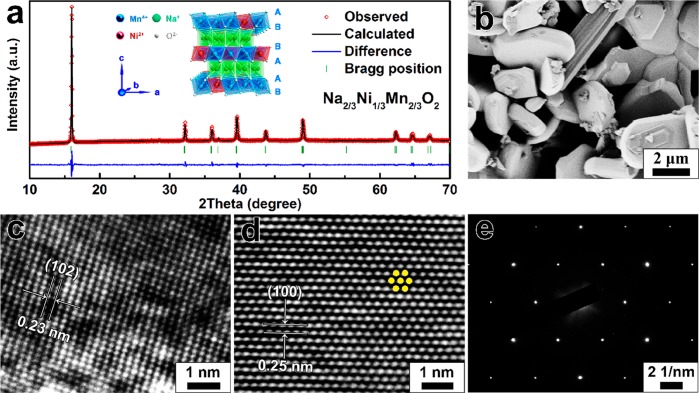
P2-Na2/3Ni1/3Mn2/3O2 was synthesized through a simple sol–gel method followed by high-temperature treatment under O2 atmosphere. As illustrated in Figure 1a, the crystal structure of P2-Na2/3Ni1/3Mn2/3O2 is built on the alternate arrangement of Na+ layers and TM ions layers. All the Na ions occupy the “prismatic” sites, and the oxygen ion framework is stacked with “ABBA” mode. The X-ray diffraction (XRD) pattern of P2-Na2/3Ni1/3Mn2/3O2 is indexed to the hexagonal P63/mmc space group. The refined crystallographic data are listed in Table S1. Figure 1b shows the SEM image of the Na2/3Ni1/3Mn2/3O2 particles with a hexagonal shape. The 102 and 100 planes are clearly observed in Figure 1c and d, respectively. The corresponding selected area electron diffraction (SAED) pattern in Figure 1e confirms that the Na2/3Ni1/3Mn2/3O2 sample has the typical single-crystal characteristics.
Figure 1.
(a) XRD pattern and Rietveld refinement of the Na2/3Ni1/3Mn2/3O2 sample. The inset shows the P2 type structure with “ABBAAB” arrangement. (b) SEM image of Na2/3Ni1/3Mn2/3O2 particles. (c–d) 102 and 100 planes of Na2/3Ni1/3Mn2/3O2. (e) The corresponding SAED image of Na2/3Ni1/3Mn2/3O2.
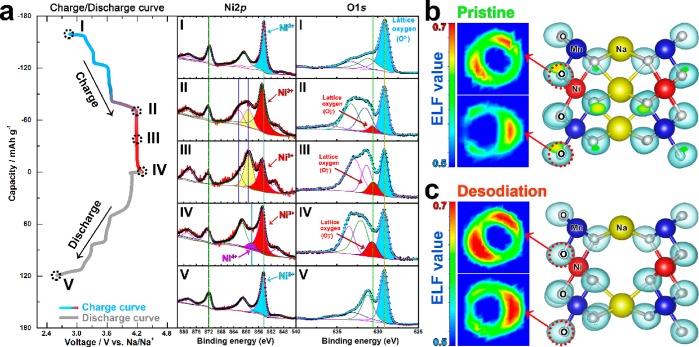
To investigate the chemical evolution in Na2/3Ni1/3Mn2/3O2 in detail, the XPS spectra were collected at various states (Figure 2 and Figure S1, marked with I, II, III, IV, and V). For the Mn element, the binding energy of the Mn 2p peaks almost remains unchanged during the whole charge/discharge process (2.6 ≤ V ≤ 4.3); hence, Mn4+ is not involved in the electrochemical reaction. For the Ni element, the Ni 2p peak at 854.4 eV shifts toward a higher binding energy (855 eV) from point I to II, indicating the occurrence of the Ni2+/Ni3+ oxidation reaction below 4.2 V.28−31 However, all Ni3+ peaks show no shift from point II to III, demonstrating that Ni still maintains a trivalent state without oxidation in this region. As the charging process continues, a small peak of 858.1 eV starts to appear at point IV (4.3 V), which could be assigned to Ni4+.29,30,32 This Ni4+ shoulder peak gets stronger when the voltage reaches 4.5 V (Figure S2). Therefore, the main voltage region for the Ni3+/Ni4+ reaction is above 4.3 V, while the charge compensation process at the 4.2 V plateau shows almost no correlation to the oxidation of Ni3+. To further verify this viewpoint, all Ni2+ ions in Na2/3Ni1/3Mn2/3O2 were replaced by Mn4+ for the charge/discharge test (Figure S3a,b). As illustrated in Figure S3d, the Ni-free counterpart of the Na2/3Mn5/6O2 compound still shows a long plateau at 4.2 V with a capacity of about 60 mAh g–1. For the O element, only lattice O2– anions peaks (529.5 eV) exist in a pristine state (point I). However, an extra O 1s peak emerges at 530.5 eV when charged to 4.2 V (point II), which can be attributed to the formation of the O2n– species.33−37 From point II to IV, this O2 peak becomes stronger gradually, indicating that the charge compensation process at the 4.2 V plateau is dominated by the O2–/O2n– couple.
Figure 2.
(a) Galvanostatic charge/discharge curves of the Na2/3Ni1/3Mn2/3O2 electrode for the first cycle at 0.1 C and the corresponding XPS spectra of Ni 2p and O 1s core at various charge states. (b–c) Representative ELF cross sections of lattice oxygen at pristine and desodiation (charged to 4.2 V) states, respectively. The oxygen lone-pair tends to locate at a position with a high ELF value.
The participation of lattice oxygen in the charge compensation process is relevant to the oxygen lone-pair.38−40 Here, electron localization function (ELF) was employed to characterize and visualize the oxygen lone-pair in Na2/3Ni1/3Mn2/3O2. The area with a high ELF value (red zone) signifies the position with lone-pairs, while the value of 0.5 (blue zone) corresponds to an electron gas-like pair probability.41,42 At the pristine stage (Figure 2b), the lone-pair area in lattice oxygen is rather limited. When charged to 4.2 V (0.33 Na+ removal), the area for lone-pair electrons becomes more extensive (Figure 2c), indicating that the lattice oxygen tends to participate in the electrochemical reaction at a high operating voltage.
Oxygen Release and Surface Densification
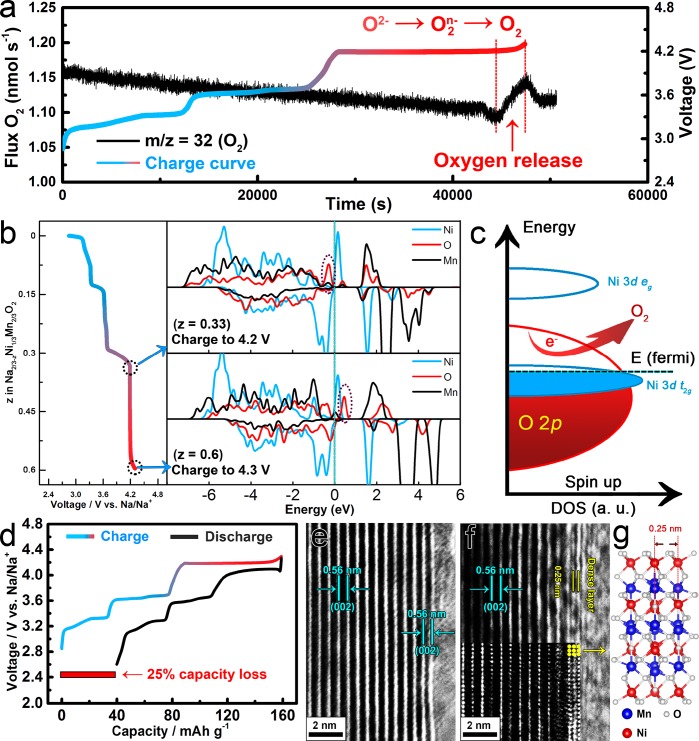
In situ DEMS was employed to analyze the gas release behavior of Na2/3Ni1/3Mn2/3O2 during the charge process (Figure 3a and Figure S4). When the electrode was charged from the initial state to 4.2 V, no O2 release was detected. However, a sudden increase of O2 gas flux was observed from 4.2 to 4.3 V, indicating the oxygen loss behavior of Na2/3Ni1/3Mn2/3O2 at high operating voltage. On the basis of the calculation results, 0.0061 mol of O2 gas was released per mol of Na2/3Ni1/3Mn2/3O2 at 4.3 V high voltage. To understand this phenomenon, density of states (DOS) is calculated at 4.2 V (0.33 Na+ removal) and 4.3 V (0.6 Na+ removal) to investigate the chemical evolution of O2– (Figure 3b). The O 2p band exceeds the Fermi level from 4.2 to 4.3 V, demonstrating that the charge compensation process is mainly carried out by the oxidation of lattice oxygen in this voltage region, which agrees with the XPS result of O spectra and the ELF results (Figure 2). However, there is almost no Ni or Mn 3d band overlap in the front part of the O 2p band at 4.3 V, which probably leads to the decoordination of the O2n– species and even the loss of oxygen because of the lack of TM-O hybridization (Figure 3c).33,39,43,44 Meanwhile, the whole charge process shows a large capacity of 158 mAh g–1, but only 119 mAh g–1 is delivered during the subsequent discharge process, implying the large irreversible capacity loss (25%) at the initial cycle (Figure 3d). We consider that this severe capacity loss is related to the irreversible evolution of O2–/O2/O2 in Na2/3Ni1/3Mn2/3O2.
Figure 3.
(a) In situ DEMS analysis of oxygen release during the first charge for the Na2/3Ni1/3Mn2/3O2 electrode. The charge current density is 10 μA mg–1, and the cut off voltage is 4.3 V. (b) DOS of Na2/3Ni1/3Mn2/3O2 cathode at 4.2 V (0.33 Na removal) and 4.3 V (0.6 Na removal). The Fermi level is indicated by the dash line. (c) Schematic representation of the energy level versus DOS and the loss of oxygen. (d) Galvanostatic charge/discharge curves of Na2/3Ni1/3Mn2/3O2 electrode and the irreversible capacity loss for the first cycle at 0.1 C. (e) HRTEM image of Na2/3Ni1/3Mn2/3O2 at the pristine state. (f) HRTEM image of Na2/3Ni1/3Mn2/3O2 after one cycle. (g) The calculated structure of the dense surface.
O2 release in a Li-rich compound usually causes undesired crystal reconstruction.33−35,45−47 HRTEM was used to analyze the crystal structure evolution of Na2/3Ni1/3Mn2/3O2 during the charge/discharge process. At the pristine stage, the interlayer distance at surface is 0.56 nm (Figure 3e), corresponding to the 002 plane. However, after one cycle in the voltage range between 2.6 and 4.3 V, a new structure with a contracted interlayer distance of 0.25 nm is formed on the particle surface (Figure 3f), which still exists after 10 cycles (Figure S5a). The dense layer compound can not be detected by XRD analysis due to the trace amount (Figure S5b). Therefore, we can only propose a probable Ni2Mn2O7 structure with an interlayer distance of 0.25 nm for this dense layer based on DFT calculations (Figure 3g). According to the calculated results, when Na+ ions insert into the interlayer space of the Ni2Mn2O7 compound, the ΔE (ΔE is the energy difference of the Ni2Mn2O7 system in which a Na atom is embedded) shows a huge increase, proving that the dense layer is not suitable for Na+ intercalation (Figure S6). Therefore, we consider that the formation of the inactive dense surface caused by oxygen release is the main reason for the large irreversible capacity loss at the initial cycle.
Suppressing of Oxygen Release
Since the oxygen release behavior seriously affects the crystal structure as well as electrochemical performance of Na2/3Ni1/3Mn2/3O2, how to address this issue is of great significance. Previous research on the Li-rich Li2Ru1–ySnyO3 cathode suggested that Ru5+ could form a Ru–O–O covalent bond to minimize oxygen release at a high operating voltage.34 Considering the similar electronic configuration of Fe and Ru, we employ Fe substitution to suppress the oxygen release behavior in Na2/3Ni1/3Mn2/3O2. By replacing Ni2+ and Mn4+ with Fe3+, the Na2/3Fe2/9Ni2/9Mn5/9O2 cathode was synthesized under the same condition as Na2/3Ni1/3Mn2/3O2.
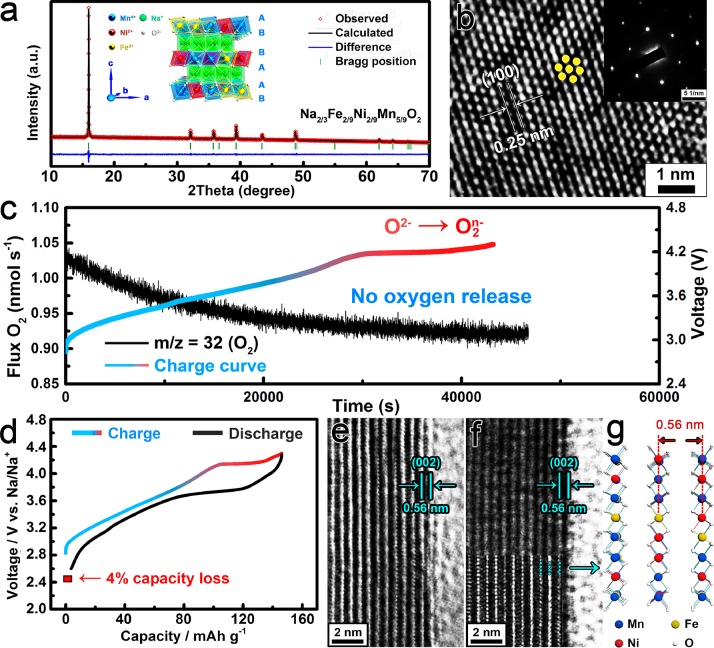
The XRD pattern of Na2/3Fe2/9Ni2/9Mn5/9O2 reveals that the substitution of Fe3+ still maintains the original hexagonal structure with P63/mmc space group (Figure 4a). The refined crystallographic data are listed in Table S1. Figure 4b shows the 100 plane with a distance of 0.25 nm. The corresponding SAED pattern in the inset of Figure 4b confirms the typical single-crystal feature of the Na2/3Fe2/9Ni2/9Mn5/9O2 sample. XPS analysis for Ni, Mn, and O was carried out at different charge states in Na2/3Fe2/9Ni2/9Mn5/9O2 (Figure S7). For the O element, the peak of 529.5 eV at the pristine stage refers to lattice O2– anions. When charged to 4.15 V, the peak of O2n– species emerges at 530.5 eV, suggesting the triggering of oxygen activity.33−37 With further charging to 4.3 V, the peak of O2 is well maintained, indicating that the O2–/O2n– couple participates in the charge compensation process at a high operating voltage. According to the in situ DEMS test (Figure 4c), no O2 gas is detected during the whole charge process, proving that the oxygen release behavior at a high operating voltage has been successfully suppressed by Fe substitution. Meanwhile, the irreversible capacity loss has been reduced from 25% to 4% at the initial cycle (Figure 4d), demonstrating the improvement of the electrochemical reversibility after the suppressing of oxygen release.
Figure 4.
(a) XRD and Rietveld plots of the Na2/3Fe2/9Ni2/9Mn5/9O2 sample. The inset shows the P2 type structure with “ABBAAB” arrangement. (b) HRTEM image of the Na2/3Fe2/9Ni2/9Mn5/9O2 sample. The inset image is the corresponding SAED pattern. (c) In situ DEMS analysis of oxygen evolution during the first charge for Na2/3Fe2/9Ni2/9Mn5/9O2 electrode. The current density is 10 μA mg–1, and the cut off voltage is 4.3 V. (d) Galvanostatic charge/discharge curves of the Na2/3Fe2/9Ni2/9Mn5/9O2 electrode and the irreversible capacity loss for the first cycle at 0.1 C. (e) HRTEM image at the pristine state. (f) HRTEM image after 1 cycle. (g) The P2 crystal structure for the surface layer.
HRTEM was used to observe the crystal structure evolution of Na2/3Fe2/9Ni2/9Mn5/9O2 particles. At the pristine state (Figure 4e), the surface shows a P2 structure with a interlayer distance of 0.56 nm. After the charge/discharge process for one cycle, the surface structure shows no obvious change (Figure 4f); hence, the interlayer space is suitable for the Na+ intercalation/deintercalation process. Even after 10 cycles, the P2 structure at the surface almost remains unchanged (Figure S5c). The corresponding XRD pattern of Na2/3Fe2/9Ni2/9Mn5/9O2 is shown in Figure S5d. Compared with the surface lattice densification on Na2/3Ni1/3Mn2/3O2 particles, no surface reconstruction occurs on Na2/3Fe2/9Ni2/9Mn5/9O2 after the charge/discharge process (Figure 4g). Therefore, Fe substitution plays a crucial role in suppressing oxygen release and surface densification during the electrochemical reaction.
Reductive Coupling Mechanism
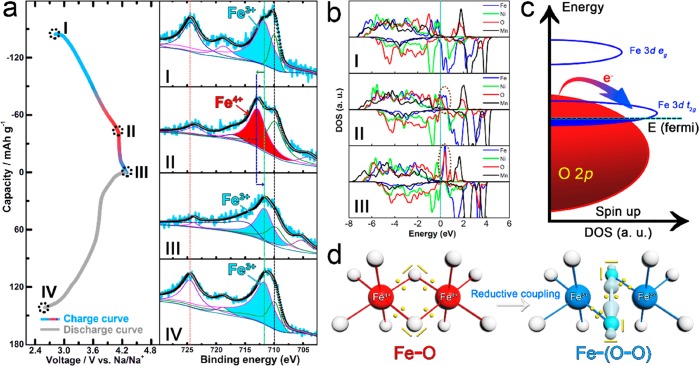
XPS analysis at different states was used to understand the mechanism of Fe substitution on the suppressing of oxygen release at high operating voltage (Figure 5a). At the pristine stage, the peak at 711.8 eV of the Fe 2p core spectra is assigned to Fe3+.48,49 When charged to 4.15 V, the peak of Fe3+ shifts toward higher energy binding at 713.1 eV, indicative of the oxidation reaction of Fe3+ → Fe4+.48 However, with further charging to 4.3 V, this peak unexpectedly moves back to 711.8 eV, which means that the Fe4+ has been reduced to Fe3+ in this voltage region. A similar TM-reductive behavior was reported in the Li-rich Li2Ru1–ySnyO3 cathode.34 Ru5+ was reduced to Ru4+at a high operating voltage, which is associated with a reductive coupling mechanism.
Figure 5.
(a) XPS spectra of Fe 2p core at various charge states. (b) DOS of Na2/3Fe2/9Ni2/9Mn5/9O2 at different charge states. (c) Schematic representation of the energy level versus DOS and the charge transfer from O 2p to Fe 3d. (d) Reductive coupling mechanism for the formation of Fe-(O–O) species. The oxidized Fe4+ at point II was reduced to Fe3+ at point III though electronic redistribution.
DOS was calculated at various states to elucidate the reductive coupling behavior in Na2/3Fe2/9Ni2/9Mn5/9O2 (Figure 5b). At the initial stage (point I), the Ni and Fe 3d bands are near the Fermi level, and oxidation proceeds through removing electrons from the Ni and Fe 3d orbital. When charged to 4.15 V (point II), the O 2p band gets close to the Fermi level, and hence the lattice oxygen start to participate in the oxidation process. With further charging to 4.3 V (point III), O 2p states exceed the Fermi level, leading to the removal of electrons along with the creation of O-hole or O–O pairing.38,43 Meanwhile, the Fe 3d bands are strongly hybridized with the O 2p band (dashed ellipse in Figure 5b, point II and point III), favoring the formation of a stable Fe-(O–O) bonding states through a charge-transfer system (O to Fe charge transfer, as shown in Figure 5c).38,50−52 This reductive behavior of Fe4+ → Fe3+ is induced by the electronic redistribution from the Fe–O bonding state to a high covalent Fe-(O–O) bonding state (Figure 5d). The high covalent binding between the Fe and O–O peroxo-like species effectively prevents O2 gas release, promoting the reversibility of O2–/O2n– redox at a high operating voltage.
Structure Evolution and Electrochemical Performance
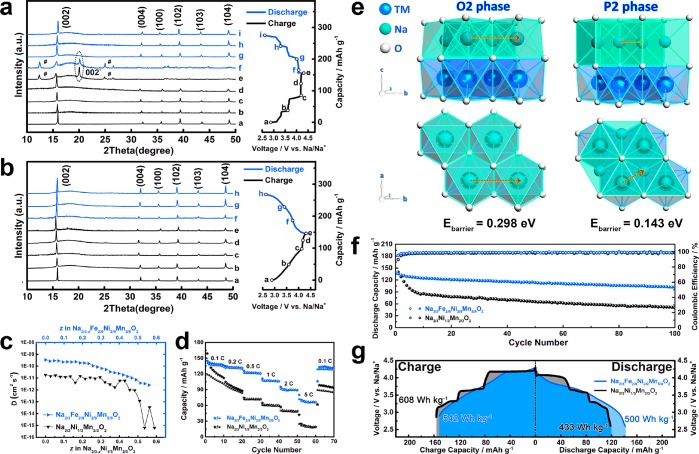
To analyze the structure evolution of Na2/3Ni1/3Mn2/3O2 during the charge/discharge process, ex situ XRD tests were carried out at various potentials (marked with a, b, c, d, e, f, j, h, and i in Figure 6a). From point a (initial state) to d (about the middle position of the 4.2 V plateau), the P2 phase is well maintained with only slight peak shifts. When the charge state reaches point e (4.3 V), a new peak (referred as 002′) appears at 21° with the weakening of the 002 peak, suggesting the phase transition of P2 → O2 in the voltage region from point d to e.14,20 The two peaks marked with the “#” symbol belong to the hydrated phase.15 After Fe substitution, the XRD patterns show no phase transition behavior during the whole charge/discharge process (Figure 6b).
Figure 6.
(a, b) Ex situ XRD patterns of Na2/3Ni1/3Mn2/3O2 and Na2/3Fe2/9Ni2/9Mn5/9O2 at various potentials. (c) The Na+ diffusion coefficients in Na2/3Ni1/3Mn2/3O2 and Na2/3Fe2/9Ni2/9Mn5/9O2 calculated from GITT. (d) Rate capability of Na2/3Ni1/3Mn2/3O2 and Na2/3Fe2/9Ni2/9Mn5/9O2. (e) The diffusion paths of Na+ in O2 and P2 phase and the corresponding energy barrier. (f) Cycling stability of Na2/3Ni1/3Mn2/3O2 and Na2/3Fe2/9Ni2/9Mn5/9O2 at 0.5 C. (g) Comparison of energy density for Na2/3Ni1/3Mn2/3O2 and Na2/3Fe2/9Ni2/9Mn5/9O2.
Galvanostatic intermittent titration technique (GITT) was used to determine Na+ diffusion coefficients of Na2/3Ni1/3Mn2/3O2 and Na2/3Fe2/9Ni2/9Mn5/9O2 under different Na+ concentrations (Figure 6c). When the Na+ removal range is 0 ≤ z ≤ 1/3, the Na+ diffusion coefficient of Na2/3Ni1/3Mn2/3O2 is around 1 order of magnitude lower than that of Na2/3Fe2/9Ni2/9Mn5/9O2 due to the existence of Na+ vacancy ordering structure (Figure S8 and Figure S9). When the Na+ removal range exceeded 1/3, the Na+ diffusion coefficient of Na2/3Ni1/3Mn2/3O2 displays a dramatic fluctuation between 10–12 and 10–15 cm2s–1, while Na2/3Fe2/9Ni2/9Mn5/9O2 shows a gradually decrease from 10–11 to 10–12 cm2 s–1. Rate capability of Na2/3Ni1/3Mn2/3O2 and Na2/3Fe2/9Ni2/9Mn5/9O2 are tested at different current densities (Figure 6d). Na2/3Ni1/3Mn2/3O2 electrode delivers a discharge capacity of 119 mAh g–1 at 0.1 C (1 C = 160 mAh g–1), but only 17% (21 mAh g–1) is retained at 5 C. In contrast, Na2/3Fe2/9Ni2/9Mn5/9O2 shows a discharge capacity of 141 mAh g–1 at 0.1 C with a high retention of 45% (63 mAh g–1) at 5 C due to its higher Na+ mobility, which has been proven by GITT analysis. What is more, it should be noticed that the P2 phase in Na2/3Ni1/3Mn2/3O2 converts to the O2 phase (Figure 6a) at a high voltage region, while the P2 phase in Na2/3Fe2/9Ni2/9Mn5/9O2 is well maintained (Figure 6b) during the whole charge/discharge process. The Na ion diffusion paths in the O2 and P2 structures are quite different. For the O2 structure, the migration of Na ions from one octahedron site to another requires two transits of the triangular face. For P2 structure, the diffusion of Na ions between two prismatic sites only needs to pass through one rectangular face. A nudged elastic band (NEB) calculation was carried out to further study the energy barrier in the O2 and P2 structure (Figure 6e). The energy barrier in O2 phase is 0.298 eV, while that in the P2 phase is 0.143 eV, indicating the higher Na+ mobility in Na2/3Fe2/9Ni2/9Mn5/9O2 with the stable P2 phase.
Cycling performance and the corresponding Coulombic efficiency (CE) were evaluated at 0.5 C current density (Figure 6f). Compared with the low CE of 88.5% in the Na2/3Ni1/3Mn2/3O2 electrode, the Na2/3Fe2/9Ni2/9Mn5/9O2 electrode shows 95.4% CE at the initial cycle. After 100 cycles, the discharge capacity of Na2/3Ni1/3Mn2/3O2 shows a rapid decay, and only 44% capacity (58.4 mAh g–1) is retained, while 78% (102.1 mAh g–1) discharge capacity is maintained for Na2/3Fe2/9Ni2/9Mn5/9O2 electrode. The energy densities of Na2/3Ni1/3Mn2/3O2 and Na2/3Fe2/9Ni2/9Mn5/9O2 are shown in Figure 6g. Although Na2/3Ni1/3Mn2/3O2 shows a large energy density of 608 Wh kg–1 during the charge process, only 71% (433 Wh kg–1) is obtained during the subsequent discharge process. In contrast, Na2/3Fe2/9Ni2/9Mn5/9O2 delivers 542 Wh kg–1 during the charge process and a high retention of 92% (500 Wh kg-1) is achieved during the subsequent discharge process. The superior reversibility of O2–/O2n– redox, rate capability, cycling stability, and energy density retention of Na2/3Fe2/9Ni2/9Mn5/9O2 are attributed to Fe substitution, which effectively suppresses the oxygen release, surface lattice densification, and phase transition during the electrochemical reaction.
Conclusion
In summary, we prove the existence of O2–/O2n–/O2 evolution and solved the oxygen release problem in Na2/3Ni1/3Mn2/3O2. At the 4.2 V plateau, the oxygen functions as the electron donor, and the irreversible O2–/O2/O2 evolution occurs due to the lack of TM-O hybridization. The loss of oxygen causes the surface densification of Na2/3Ni1/3Mn2/3O2 particles, and this dense structure is not suitable for Na+ intercalation. Therefore, the formation of an inactive dense layer at the initial cycle is considered as the main reason for the irreversible capacity loss. The oxygen release behavior in Na2/3Ni1/3Mn2/3O2 can be greatly suppressed by Fe substitution due to the formation of the Fe-(O–O) species associated with the reductive coupling behavior, which preserves the reversibility of O2–/O2n– redox reaction at a high operating voltage. As a result, the irreversible capacity loss at the initial cycle is reduced from 25% to 4%, and the capacity retention increases from 42% to 78% after 100 cycles. The understanding of oxygen release behavior in the Na-deficient cathode and the strategy for suppressing of oxygen release offer a new perspective for developing high-performance cathode materials with high reversibility and long cycling stability for SIBs.
Experimental Procedures
The details of experimental procedures are provided in Supporting Information.
Acknowledgments
We gratefully acknowledge the financial support from the National Natural Science Foundation of China (Grant Nos. 51602221 and 51632001), Shanghai Municipal Natural Science Foundation (16ZR1438400), National Key R&D Program of China under Grant No. 2018YFB0905400, and the Fundamental Research Funds for the Central Universities.
Supporting Information Available
The Supporting Information is available free of charge at https://pubs.acs.org/doi/10.1021/acscentsci.9b01166.
Experimental section; characterization method; additional figures and tables (PDF)
The authors declare no competing financial interest.
Supplementary Material
References
- Vaalma C.; Buchholz D.; Weil M.; Passerini S. A cost and resource analysis of sodium-ion batteries. Nat. Rev. Mater. 2018, 3, 18013. 10.1038/natrevmats.2018.13. [DOI] [Google Scholar]
- Palomares V.; Serras P.; Villaluenga I.; Hueso K. B.; Carretero-Gonzalez J.; Rojo T. Na-ion batteries, recent advances and present challenges to become low cost energy storage systems. Energy Environ. Sci. 2012, 5, 5884–5901. 10.1039/c2ee02781j. [DOI] [Google Scholar]
- Fang Y.; Yu X.-Y.; Lou X. W. D. Nanostructured electrode materials for advanced sodium-ion batteries. Matter 2019, 1, 90–114. 10.1016/j.matt.2019.05.007. [DOI] [Google Scholar]
- Liu T. F.; Zhang Y. P.; Jiang Z. G.; Zeng X. Q.; Ji J. P.; Li Z. H.; Gao X. H.; Sun M. H.; Lin Z.; Ling M.; Zheng J. C.; Liang C. D. Exploring competitive features of stationary sodium ion batteries for electrochemical energy storage. Energy Environ. Sci. 2019, 12, 1512–1533. 10.1039/C8EE03727B. [DOI] [Google Scholar]
- Han M. H.; Gonzalo E.; Singh G.; Rojo T. A comprehensive review of sodium layered oxides: powerful cathodes for Na-ion batteries. Energy Environ. Sci. 2015, 8, 81–102. 10.1039/C4EE03192J. [DOI] [Google Scholar]
- Nayak P. K.; Yang L.; Brehm W.; Adelhelm P. From Lithium-Ion to Sodium-Ion Batteries: Advantages, Challenges, and Surprises. Angew. Chem., Int. Ed. 2018, 57, 102–120. 10.1002/anie.201703772. [DOI] [PubMed] [Google Scholar]
- Zhou W.; Li Y.; Xin S.; Goodenough J. B. Rechargeable Sodium All-Solid-State Battery. ACS Cent. Sci. 2017, 3, 52–57. 10.1021/acscentsci.6b00321. [DOI] [PMC free article] [PubMed] [Google Scholar]
- Delmas C.; Braconnier J.-J.; Fouassier C.; Hagenmuller P. Electrochemical intercalation of sodium in NaxCoO2 bronzes. Solid State Ionics 1981, 3, 165–169. 10.1016/0167-2738(81)90076-X. [DOI] [Google Scholar]
- Velikokhatnyi O. I.; Chang C.-C.; Kumta P. N. Phase stability and electronic structure of NaMnO2. J. Electrochem. Soc. 2003, 150, A1262–A1266. 10.1149/1.1600464. [DOI] [Google Scholar]
- Berthelot R.; Carlier D.; Delmas C. Electrochemical investigation of the P2–NaxCoO2 phase diagram. Nat. Mater. 2011, 10, 74–80. 10.1038/nmat2920. [DOI] [PubMed] [Google Scholar]
- Guignard M.; Didier C.; Darriet J.; Bordet P.; Elkaïm E.; Delmas C. P2-NaxVO2 system as electrodes for batteries and electron-correlated materials. Nat. Mater. 2013, 12, 74–80. 10.1038/nmat3478. [DOI] [PubMed] [Google Scholar]
- Zhang Y.; Zhang R.; Huang Y. Air-stable NaxTMO2 cathodes for sodium storage. Front. Chem. 2019, 7, 335. 10.3389/fchem.2019.00335. [DOI] [PMC free article] [PubMed] [Google Scholar]
- Li Y. J.; Gao Y. R.; Wang X. F.; Shen X.; Kong Q. Y.; Yu R. C.; Lu G.; Wang Z. X.; Chen L. Q. Iron migration and oxygen oxidation during sodium extraction from NaFeO2. Nano Energy 2018, 47, 519–526. 10.1016/j.nanoen.2018.03.007. [DOI] [Google Scholar]
- Lu Z.; Dahn J. R. In situ X-Ray Diffraction study of P2 Na2/3[Ni1/3Mn2/3]O2. J. Electrochem. Soc. 2001, 148, A1225–A1229. 10.1149/1.1407247. [DOI] [Google Scholar]
- Lu Z.; Dahn J. R. Intercalation of water in P2, T2 and O2 structure Az[CoxNi1/3-xMn2/3]O2. Chem. Mater. 2001, 13, 1252–1257. 10.1021/cm000721x. [DOI] [Google Scholar]
- Zheng L.; Li J.; Obrovac M. N. Crystal structures and electrochemical performance of air-stable Na2/3Ni1/3–xCuxMn2/3O2 in sodium cells. Chem. Mater. 2017, 29, 1623–1631. 10.1021/acs.chemmater.6b04769. [DOI] [Google Scholar]
- Yang Q.; Wang P. F.; Guo J. Z.; Chen Z. M.; Pang W. L.; Huang K. C.; Guo Y. G.; Wu X. L.; Zhang J. P. Advanced P2-Na2/3Ni1/3Mn7/12Fe1/12O2 cathode material with suppressed P2–O2 phase transition toward high-performance sodium-Ion battery. ACS Appl. Mater. Interfaces 2018, 10, 34272–34282. 10.1021/acsami.8b12204. [DOI] [PubMed] [Google Scholar]
- Wang L.; Sun Y.-G.; Hu L.-L.; Piao J.-Y.; Guo J.; Manthiram A.; Ma J.; Cao A.-M. Copper-substituted Na0.67Ni0.3-xCuxMn0.7O2 cathode materials for sodium-ion batteries with suppressed P2-O2 phase transition. J. Mater. Chem. A 2017, 5, 8752–8761. 10.1039/C7TA00880E. [DOI] [Google Scholar]
- Tapia Ruiz N.; Dose W. M.; Sharma N.; Chen H.; Heath J.; Somerville J. W.; Maitra U.; Islam M. S.; Bruce P. G. High voltage structural evolution and enhanced Na-ion diffusion in P2-Na2/3Ni1/3-xMgxMn2/3O2 (0 ≤ x ≤ 0.2) cathodes from diffraction, electrochemical and ab initio studies. Energy Environ. Sci. 2018, 11, 1470–1479. 10.1039/C7EE02995K. [DOI] [Google Scholar]
- Wang P. F.; You Y.; Yin Y. X.; Wang Y. S.; Wan L. J.; Gu L.; Guo Y. G. Suppressing the P2-O2 phase transition of Na0.67Mn0.67Ni0.33O2 by magnesium substitution for improved sodium-ion batteries. Angew. Chem., Int. Ed. 2016, 55, 7445–7449. 10.1002/anie.201602202. [DOI] [PubMed] [Google Scholar]
- Singh G.; Tapia-Ruiz N.; Lopez del Amo J. M.; Maitra U.; Somerville J. W.; Armstrong A. R.; Martinez de Ilarduya J.; Rojo T.; Bruce P. G. High voltage Mg-doped Na0.67Ni0.3–xMgxMn0.7O2 (x = 0.05, 0.1) Na-Ion cathodes with enhanced stability and rate capability. Chem. Mater. 2016, 28, 5087–5094. 10.1021/acs.chemmater.6b01935. [DOI] [Google Scholar]
- Ma C.; Alvarado J.; Xu J.; Clement R. J.; Kodur M.; Tong W.; Grey C. P.; Meng Y. S. Exploring oxygen activity in the high energy P2-Type Na0.78Ni0.23Mn0.69O2 cathode material for Na-Ion batteries. J. Am. Chem. Soc. 2017, 139, 4835–4845. 10.1021/jacs.7b00164. [DOI] [PubMed] [Google Scholar]
- Risthaus T.; Zhou D.; Cao X.; He X.; Qiu B.; Wang J.; Zhang L.; Liu Z.; Paillard E.; Schumacher G.; Winter M.; Li J. A high-capacity P2 Na2/3Ni1/3Mn2/3O2 cathode material for sodium ion batteries with oxygen activity. J. Power Sources 2018, 395, 16–24. 10.1016/j.jpowsour.2018.05.026. [DOI] [Google Scholar]
- Wang K.; Yan P.; Sui M. Phase transition induced cracking plaguing layered cathode for sodium-ion battery. Nano Energy 2018, 54, 148–155. 10.1016/j.nanoen.2018.09.073. [DOI] [Google Scholar]
- Wu X.; Guo J.; Wang D.; Zhong G.; McDonald M. J.; Yang Y. P2-type Na0.66Ni0.33–xZnxMn0.67O2 as new high-voltage cathode materials for sodium-ion batteries. J. Power Sources 2015, 281, 18–26. 10.1016/j.jpowsour.2014.12.083. [DOI] [Google Scholar]
- Liu Y.; Fang X.; Zhang A.; Shen C.; Liu Q.; Enaya H. A.; Zhou C. Layered P2-Na2/3[Ni1/3Mn2/3]O2 as high-voltage cathode for sodium-ion batteries: The capacity decay mechanism and Al2O3 surface modification. Nano Energy 2016, 27, 27–34. 10.1016/j.nanoen.2016.06.026. [DOI] [Google Scholar]
- Ramasamy H. V.; Kaliyappan K.; Thangavel R.; Aravindan V.; Kang K.; Kim D. U.; Park Y.; Sun X.; Lee Y.-S. Cu-doped P2-Na0.5Ni0.33Mn0.67O2 encapsulated with MgO as a novel high voltage cathode with enhanced Na-storage properties. J. Mater. Chem. A 2017, 5, 8408–8415. 10.1039/C6TA10334K. [DOI] [Google Scholar]
- Fu Z.; Hu J.; Hu W.; Yang S.; Luo Y. Quantitative analysis of Ni2+/Ni3+ in Li[NixMnyCoz]O2 cathode materials: Non-linear least-squares fitting of XPS spectra. Appl. Surf. Sci. 2018, 441, 1048–1056. 10.1016/j.apsusc.2018.02.114. [DOI] [Google Scholar]
- Inamdar A. I.; Sonavane A. C.; Pawar S. M.; Kim Y.; Kim J. H.; Patil P. S.; Jung W.; Im H.; Kim D.-Y.; Kim H. Electrochromic and electrochemical properties of amorphous porous nickel hydroxide thin films. Appl. Surf. Sci. 2011, 257, 9606–9611. 10.1016/j.apsusc.2011.06.079. [DOI] [Google Scholar]
- Hemalatha K.; Jayakumar M.; Bera P.; Prakash A. S. Improved electrochemical performance of Na0.67MnO2 through Ni and Mg substitution. J. Mater. Chem. A 2015, 3, 20908–20912. 10.1039/C5TA06361B. [DOI] [Google Scholar]
- Wang H.-Y.; Hsu Y.-Y.; Chen R.; Chan T.-S.; Chen H. M.; Liu B. Ni3+ induced formation of active NiOOH on the spinel Ni–Co oxide surface for efficient oxygen evolution reaction. Adv. Energy Mater. 2015, 5, 1500091. 10.1002/aenm.201500091. [DOI] [Google Scholar]
- Guo S. H.; Yu H. J.; Liu P.; Ren Y.; Zhang T.; Chen M. W.; Ishida M.; Zhou H. S. High-performance symmetric sodium-ion batteries using a new, bipolar O3-type material, Na0.8Ni0.4Ti0.6O2. Energy Environ. Sci. 2015, 8, 1237–1244. 10.1039/C4EE03361B. [DOI] [Google Scholar]
- Saubanere M.; McCalla E.; Tarascon J. M.; Doublet M. L. The intriguing question of anionic redox in high-energy density cathodes for Li-ion batteries. Energy Environ. Sci. 2016, 9, 984–991. 10.1039/C5EE03048J. [DOI] [Google Scholar]
- Sathiya M.; Rousse G.; Ramesha K.; Laisa C. P.; Vezin H.; Sougrati M. T.; Doublet M. L.; Foix D.; Gonbeau D.; Walker W.; Prakash A. S.; Ben Hassine M.; Dupont L.; Tarascon J. M. Reversible anionic redox chemistry in high-capacity layered-oxide electrodes. Nat. Mater. 2013, 12, 827–835. 10.1038/nmat3699. [DOI] [PubMed] [Google Scholar]
- Grimaud A.; Hong W. T.; Shao-Horn Y.; Tarascon J. M. Anionic redox processes for electrochemical devices. Nat. Mater. 2016, 15, 121–126. 10.1038/nmat4551. [DOI] [PubMed] [Google Scholar]
- Sathiya M.; Abakumov A. M.; Foix D.; Rousse G.; Ramesha K.; Saubanere M.; Doublet M. L.; Vezin H.; Laisa C. P.; Prakash A. S.; Gonbeau D.; VanTendeloo G.; Tarascon J. M. Origin of voltage decay in high-capacity layered oxide electrodes. Nat. Mater. 2015, 14, 230–238. 10.1038/nmat4137. [DOI] [PubMed] [Google Scholar]
- Pearce P. E.; Perez A. J.; Rousse G.; Saubanère M.; Batuk D.; Foix D.; McCalla E.; Abakumov A. M.; Van Tendeloo G.; Doublet M.-L.; Tarascon J.-M. Evidence for anionic redox activity in a tridimensional-ordered Li-rich positive electrode β-Li2IrO3. Nat. Mater. 2017, 16, 580. 10.1038/nmat4864. [DOI] [PubMed] [Google Scholar]
- Ben Yahia M.; Vergnet J.; Saubanere M.; Doublet M. L. Unified picture of anionic redox in Li/Na-ion batteries. Nat. Mater. 2019, 18, 496–502. 10.1038/s41563-019-0318-3. [DOI] [PubMed] [Google Scholar]
- Assat G.; Tarascon J. M. Fundamental understanding and practical challenges of anionic redox activity in Li-ion batteries. Nat. Energy 2018, 3, 373–386. 10.1038/s41560-018-0097-0. [DOI] [Google Scholar]
- Perez A. J.; Jacquet Q.; Batuk D.; Iadecola A.; Saubanère M.; Rousse G.; Larcher D.; Vezin H.; Doublet M.-L.; Tarascon J.-M. Approaching the limits of cationic and anionic electrochemical activity with the Li-rich layered rocksalt Li3IrO4. Nat. Energy 2017, 2, 954–962. 10.1038/s41560-017-0042-7. [DOI] [Google Scholar]
- Savin A.; Nesper R.; Wengert S.; Fässler T. F. ELF: The Electron Localization Function. Angew. Chem., Int. Ed. Engl. 1997, 36, 1808–1832. 10.1002/anie.199718081. [DOI] [Google Scholar]
- Lai W.; Wang Y.; Morelli D. T.; Lu X. From bonding asymmetry to anharmonic rattling in Cu12Sb4S13 Tetrahedrites: when Lone-Pair electrons are not so lonely. Adv. Funct. Mater. 2015, 25, 3648–3657. 10.1002/adfm.201500766. [DOI] [Google Scholar]
- Xiao R.; Li H.; Chen L. Density Functional Investigation on Li2MnO3. Chem. Mater. 2012, 24, 4242–4251. 10.1021/cm3027219. [DOI] [Google Scholar]
- Luo K.; Roberts M. R.; Hao R.; Guerrini N.; Pickup D. M.; Liu Y.-S.; Edström K.; Guo J.; Chadwick A. V.; Duda L. C.; Bruce P. G. Charge-compensation in 3d-transition-metal-oxide intercalation cathodes through the generation of localized electron holes on oxygen. Nat. Chem. 2016, 8, 684. 10.1038/nchem.2471. [DOI] [PubMed] [Google Scholar]
- Mu L.; Lin R.; Xu R.; Han L.; Xia S.; Sokaras D.; Steiner J. D.; Weng T.-C.; Nordlund D.; Doeff M. M.; Liu Y.; Zhao K.; Xin H. L.; Lin F. Oxygen release Induced chemomechanical breakdown of layered cathode materials. Nano Lett. 2018, 18, 3241–3249. 10.1021/acs.nanolett.8b01036. [DOI] [PubMed] [Google Scholar]
- Li Q.; Yao Z.; Lee E.; Xu Y.; Thackeray M. M.; Wolverton C.; Dravid V. P.; Wu J. Dynamic imaging of crystalline defects in lithium-manganese oxide electrodes during electrochemical activation to high voltage. Nat. Commun. 2019, 10, 1692. 10.1038/s41467-019-09408-2. [DOI] [PMC free article] [PubMed] [Google Scholar]
- Yan P.; Zheng J.; Chen T.; Luo L.; Jiang Y.; Wang K.; Sui M.; Zhang J.; Zhang S.; Wang C. Coupling of electrochemically triggered thermal and mechanical effects to aggravate failure in a layered cathode. Nat. Commun. 2018, 9, 2437. 10.1038/s41467-018-04862-w. [DOI] [PMC free article] [PubMed] [Google Scholar]
- Rajagopalan R.; Chen B.; Zhang Z.; Wu X. L.; Du Y.; Huang Y.; Li B.; Zong Y.; Wang J.; Nam G. H.; Sindoro M.; Dou S. X.; Liu H. K.; Zhang H. Improved reversibility of Fe(3+)/Fe(4+) redox couple in sodium super ion conductor type Na3Fe2(PO4)3 for sodium-ion batteries. Adv. Mater. 2017, 29, 1605694. 10.1002/adma.201605694. [DOI] [PubMed] [Google Scholar]
- Biesinger M. C.; Payne B. P.; Grosvenor A. P.; Lau L. W. M.; Gerson A. R.; Smart R. S. C. Resolving surface chemical states in XPS analysis of first row transition metals, oxides and hydroxides: Cr, Mn, Fe, Co and Ni. Appl. Surf. Sci. 2011, 257, 2717–2730. 10.1016/j.apsusc.2010.10.051. [DOI] [Google Scholar]
- Zaanen J.; Sawatzky G. A.; Allen J. W. Band gaps and electronic structure of transition-metal compounds. Phys. Rev. Lett. 1985, 55, 418–421. 10.1103/PhysRevLett.55.418. [DOI] [PubMed] [Google Scholar]
- Yabuuchi N.; Nakayama M.; Takeuchi M.; Komaba S.; Hashimoto Y.; Mukai T.; Shiiba H.; Sato K.; Kobayashi Y.; Nakao A.; Yonemura M.; Yamanaka K.; Mitsuhara K.; Ohta T. Origin of stabilization and destabilization in solid-state redox reaction of oxide ions for lithium-ion batteries. Nat. Commun. 2016, 7, 13814. 10.1038/ncomms13814. [DOI] [PMC free article] [PubMed] [Google Scholar]
- Mortemard de Boisse B.; Liu G.; Ma J.; Nishimura S.-i.; Chung S.-C.; Kiuchi H.; Harada Y.; Kikkawa J.; Kobayashi Y.; Okubo M.; Yamada A. Intermediate honeycomb ordering to trigger oxygen redox chemistry in layered battery electrode. Nat. Commun. 2016, 7, 11397–11397. 10.1038/ncomms11397. [DOI] [PMC free article] [PubMed] [Google Scholar]
Associated Data
This section collects any data citations, data availability statements, or supplementary materials included in this article.


