

Abstract
This meta-analysis investigates the effect of an eating disorder on bone mineral density in two eating disorder subtypes. Following conflicting findings in previous literature, this study finds that not only anorexia nervosa, but also bulimia nervosa has a detrimental effect on BMD. Key predictors of this relationship are discussed. This systematic review and meta-analysis investigates bone mineral density (BMD) in individuals with anorexia nervosa (AN) and bulimia nervosa (BN) in comparison to healthy controls (HCs). AN has been associated with low BMD and a risk of fractures and mixed results have been obtained for the relationship between BN and BMD. Deciphering the effect these two ED subtypes on BMD will determine the effect of low body weight (a characteristic of AN) versus the effects of periods of restrictive eating and malnutrition which are common to both AN and BN. We conducted a systematic search through the electronic databases MedLine, EMBASE and PsychInfo and the Cochrane Library to investigate and quantify this relationship. We screened 544 articles and included 27 studies in a random-effect meta-analysis and calculated the standardised mean difference (SMD) in BMD between women with a current diagnosis of AN (n = 785) vs HCs (n = 979) and a current diagnosis of BN (n = 187) vs HCs (n = 350). The outcome measures investigated were spinal, hip, femoral neck and whole body BMD measured by DXA or DPA scanning. A meta-regression investigated the effect of factors including age, duration since diagnosis, duration of amenorrhea and BMI on BMD. The mean BMI of participants was 16.65 kg/m2 (AN), 21.16 kg/m2 (BN) and 22.06 kg/m2 (HC). Spine BMD was lowest in AN subjects (SMD, −3.681; 95 % CI, −4.738, −2.625; p < 0.0001), but also lower in BN subjects compared with HCs (SMD, −0.472; 95 % CI, −0.688, −0.255; p < 0.0001). Hip, whole body and femoral neck BMD were reduced to a statistically significant level in AN but not BN groups. The meta-regression was limited by the number of included studies and did not find any significant predictors. This meta-analysis confirms the association between low BMD and AN and presents a strong argument for assessing BMD not only in patients with AN, but also in patients with BN.
Keywords: Anorexia nervosa, Bone, Bone density, Bulimia nervosa, Eating disorder, Osteoporosis
Introduction
Osteoporosis is a condition that weakens bones and makes them prone to fractures. This disease affects almost 3 million in the UK and is typically associated with advancing age [1]. Excessive food restriction and malnutrition can lead to secondary osteoporosis and individuals with an eating disorder can present low BMD and osteoporosis at a young age [2, 3]. The most studied eating disorders (EDs) in this field are anorexia nervosa (AN) which includes a restricting and binge/purge subtype and is primarily characterised by excessive food restriction and weight loss, and bulimia nervosa (BN), which is characterised by binge eating and compensatory purging behaviours [4] and diagnosed according to the Diagnostic Statistical Manual of Mental Disorders (DSM-5) [5]. There has been a recent increase in research to investigate the effect of AN diagnosis on BMD, but there have been very few studies to date to determine the effect of a BN diagnosis on BMD and the development of osteoporosis.
Anorexia nervosa has been associated with low bone mineral density (BMD), impaired bone structure and an increased risk of bone fractures [6–10]. Adolescent AN occurs at a critical time for bone mass acquisition, and limitations in bone accrual at this time can disrupt the attainment of peak bone mass and result in residual bone deficits despite recovery from AN [2, 11, 12]. Peak bone mass is typically attained in the middle of the third decade of life and is a major determinant of fracture risk throughout life; individuals with adolescent onset AN have been found to not obtain optimal peak bone mass [13, 14]. In contrast, individuals bone mass during adulthood may retain the ability to recover without residual bone deficits following complete weight gain, nutritional and menstrual recovery [15].
Fractures are associated with significant pain, disability and loss of work days, and AN patients are 7 times more likely to have bone fractures than age-matched healthy women [16], with an estimated 90 % having osteopenia and 40 % having osteoporosis at one or more skeletal sites [17]. Similar deficits have been reported in sufferers of BN, but studies have been limited by small sample sizes, inconsistent diagnostic criteria and comorbid psychiatric diagnoses of participants [18] which have made it impossible to determine the effect of BN on BMD. The extent to which bone metabolism is affected by malnutrition and weight loss may vary according to anatomical site, and some regions may be more prone to fractures than others [19]. Disentangling the causative factors that lead to low bone density in the ED population is a fundamental step towards reducing fractures in this group.
In contrast to AN, women with BN are usually at normal weight and many do not have menstrual abnormalities, and thus studies have suggested that BMD in women with BN is comparable to that in healthy controls (HCs) [20, 21] and that AN alone is associated with low bone mass [18, 21, 22]. Others have suggested that although individuals with BN have higher BMD than those with AN, their BMD is lower than in HCs [20]. Yet others have reported that BN, when coupled with low body weight and secondary amenorrhea, is a strong predictor of fracture risk and osteoporosis [23]. A reduced BMD in BN compared to HCs may be associated with amenorrhea [20], low BMI [18] and a previous history of AN, but due to inconsistent methodologies in the available studies the relationship between BN and BMD is unclear.
In girls with AN, bone density measures are reported to be predicted positively by BMI, and inversely by loss of menses and duration of amenorrhea [24]. The recovery of menses has been associated with a partial improvement in bone mass following recovery from an ED [25]. Oestrogen therapy has been shown to increase BMD in post-menopausal women, in whom the hypo-estrogenic state otherwise results in significant bone loss. For this reason oral contraceptives have been widely used in patients with EDs. However, multiple studies have now shown that oestrogen given orally is not effective in increasing bone density in AN [26, 27]. This is likely because of first pass hepatic metabolism resulting in a decrease in IGF-1, a key nutritionally regulated bone trophic hormone that is already low in AN. In contrast, transdermal oestrogen, which does not suppress IGF-1, does increase bone density in AN [13], although complete ‘catch up’ to a comparable BMD in HCs does not occur given that other hormonal deficits persist [25].
Individuals with AN have been observed to have lower bone mass than women with BN [28], as well as lower bone mass than non-ED women with menstrual abnormalities and amenorrhea [17]. This may indicate that negative effects on bone mass in AN cannot entirely be explained by low body weight and amenorrhea; however may be related to additional factors caused by nutritional restriction. Investigations into the causal mechanisms behind low BMD in AN thus far have focused on alterations in body composition, nutritional factors, and hormones [29–33].
Current inconsistencies in the literature regarding bone consequences of AN vs BN and the role of age and the natural decline of BMD versus the duration and nature of the ED make it important to assess these knowledge gaps in a systematic fashion. Further, a thorough evaluation of the possible determinants of low bone density in patients with EDs, such as age, BMI, duration of amenorrhea and duration since diagnosis, is lacking and has never been studied using a meta-analysis. This systematic review and meta-analysis aims to investigate the relationship between AN, BN and BMD. If BMD is found to be reduced to a similar level in both AN and BN groups, then we may conclude that there are factors other than severe weight loss due to an ED (primarily seen in AN) which contribute to low BMD and secondary osteoporosis. This will be highly useful for informing treatment options for these groups which are currently lacking.
The outcome measures investigated in this meta-analysis are spine, whole body, hip and femoral neck BMD. And body BMD have previously been associated with fracture risk in children [34] and amenorrheic athletes [35] and these anatomical sites were of particular interest in this study. We have further investigated the influence of age, BMI, the presence of amenorrhea and the duration since diagnosis on bone mass in EDs.
Materials and methods
Study selection
A search criterion was defined to extract research studies investigating the relationship between AN, BN and BMD. A literature search was conducted on bibliographic databases MedLine, EMBASE and PsychInfo and the Cochrane Library. Manual searches were conducted and reference lists were searched of included studies. Reviews on the topics of EDs and bone mineral density were searched to identify key themes and to inform search terms.
We conducted a search using combinations of search terms for eating disorders (Bulimia* Anorexia Nervosa* and Eating Disorders*) and for Osteoporosis we used (Osteoporosis*, Bone Loss*, Bone Density, Bone Mineral Density, Bone Mineral Content, Bone Mass, Fracture) the search was limited to publications in English.
Published articles were eligible if they measured BMD using DXA or DPA scanning in subjects with a current ED, e.g. AN or BN, and a HC group. Participants with AN and a history of BN were excluded; however the BN group included participants with both a history of AN and with exclusively a BN diagnosis, which will later be divided into two subgroups of BN. Participants identified to have an EDNOS (Eating disorder not otherwise specified) were excluded. Only studies which used female groups were included. We did not limit inclusion by study type, but in the cases of randomised controlled trials and longitudinal studies only baseline measures of BMD were used. When in doubt as to whether two studies had overlapping samples, we contacted the first author to ensure that no participants were used in multiple studies. Study eligibility was assessed by two authors (LR and NM) who discussed the inclusion criteria and reached a consensus based on the a priori criteria that studies report independent samples (no sample is used in multiple studies) of participants with either AN or BN and a corresponding HC group.
The study selection included the initial screening of title and abstracts against the inclusion criteria using EndNote, and screening of full papers against the inclusion criteria. Studies fitting inclusion criteria were excluded for reasons including replication of participants from other included papers, or patients with AN or BN grouped with other ED participants. In the case of overlapping samples, only one study with the specific sample of participants could be included.
Data extraction
Data were extracted from included papers using a standardised form. The following data were obtained from each study: Study name, year of publication, number of participants, number of participants with an ED (anorexic and bulimic subgroups), duration of disease, duration of amenorrhea, BMI, age, sample source, method of diagnosis, DXA or DPA scanning methods and BMD data for the spine, hip, femoral neck and whole body where available. Study characteristics including journal, source of funding, geographical location of study, ethnicity of participants, methods, primary outcome measures and key findings were also obtained from each study.
Authors were contacted to retrieve data not published in several studies. Assessment of risk of bias did not justify exclusion of any further studies. The included studies were independently assessed by two reviewers (LR and NM) and any discrepancies in rating were discussed and resolved.
Assessment of risk of bias
Risk of bias was assessed using the Newcastle-Ottawa scale (NOS) for assessing the quality of non-randomised studies in meta-analyses. This scale assesses the selection of participants, the comparability of cases and controls and ascertainment of exposure. This includes definition of cases and controls, selection of controls and representativeness of cases and the comparability of cases and controls. The exposure is assessed as the diagnosis of the ED and the bias of the sample through non-response rate.
The Cochrane collaboration tool for assessing risk of bias was not appropriate as the studies were non-randomised, but relevant aspects of this tool were considered including incomplete outcome data, selective outcome reporting and other potential sources of bias. All the included studies were considered to have a low risk of bias.
Outcome variables
The outcomes of interest were spine, whole body, hip and femoral neck BMD.
Statistical analyses
Meta-analysis
Statistical analysis was conducted using the STATA ‘metan’ command. The BMD, BMAD and aBMD values were entered for the AN groups, BN groups and control groups for the spine, hip, femoral neck and whole body (where available). Heterogeneity was suspected in the data and so a random effect meta-analysis was used [36]. The standardised mean difference was used in this meta-analysis as a summary statistic. In meta-analysis when the studies all assess the same outcome but measure it in a variety of ways and it is necessary to standardise the results of the studies to a uniform scale before they can be combined. The standardised mean difference expresses the size of the exposure effect in each study relative to the variability observed in that study [37].
Meta-regression
We used a series of meta-regression analyses in STATA’s ‘metareg’ command to examine the effect of the studies’ sample characteristics on spine BMD. The predictors included: mean age, BMI and the duration since diagnosis (years). As different studies contained different predictors, the number of participants in each meta-regression analysis varied. Due to the small number of studies which specified if subjects were of the diagnostic subtype of AN (restricting or binge/purge subtype), it was not possible to perform this subgroup analysis.
Sensitivity analyses
Heterogeneity was suspected given the use of varying diagnostic tools, diagnostic crossover (between AN and BN), and lack of information on AN subtype in some studies (restricting/binge-purging subtype). The heterogeneity in the data was assessed using Higgins I2, and sensitivity analysis was conducted using the trim and fill analysis which aims both to identify and correct for funnel plot asymmetry arising from publication bias to determine if the removal of smaller studies would reduce publication bias [38]. Eggers test for small study effects was conducted on spine, hip, femoral neck and whole body BMD data [39].
Results
Search results
Twenty-five studies measuring BMD in AN, and six studies measuring BMD in BN met the inclusion criteria (Table 1). Four of these included both AN and BN subgroups, and were included in both the AN and BN meta-analyses. Figure 1 is a PRISMA diagram describing the search for eligible items [40]. After searching electronic databases, 440 eligible articles were found, of which 119 were identified as relevant based on the title and abstract. Additional searches were conducted based on reference lists and alternative search engines were used. A total of 41 studies met inclusion criteria, with 14 excluded for factors such as replication of data, mixed ED group or for grouping participants with current and recovered EDs together. A total of 27 studies were included in the study.
Table 1.
Summary of study characteristics
| Author (year) | ED | Sample size (n) | Design | ED population | Controls | Diagnostic method | Scanning method | Bone density outcome measures |
|---|---|---|---|---|---|---|---|---|
| Bredella (2008) | AN | 10 | Case-control | ED clinics | Healthy controls | DSM-IV | DXA | Spinal BMD |
| HC | 10 | Clinic advertisements | Hip BMD | |||||
| Whole body BMD | ||||||||
| Bredella (2009) | AN | 10 | Case-control | Clinic referrals | Healthy controls | ‘Psychiatric diagnostic criteria for AN’ | DXA | Spinal BMD |
| HC | 10 | Recruited through community advertisements | MRI | Hip BMD | ||||
| Whole body BMD | ||||||||
| Bredella (2012) | AN | 10 | Case-control | Clinic referrals | Healthy Controls. | DSM-IV | DXA | Spinal BMD |
| HC | 5 | Recruited through community advertisements | Fluorodeoxyglucose-PET and CT | Hip BMD | ||||
| Whole body BMD | ||||||||
| Femoral neck BMD | ||||||||
| Lateral spine BMD | ||||||||
| Davies, et al. (1990). | AN | 26 | Case-control | Clinic records of eating disorder patients from medical centre | Healthy controls | DSM-III | DPA | Spinal BMD |
| BN | 11 | Some self-select for fitness and diet study, some DXA and DPA compar ison group | DSM-III-R | Forearm BMD | ||||
| HC | 211 | |||||||
| Faje (2013) | AN | 44 | Cohort | Hospital outpatients | Healthy controls 10–90th percentile normal weight | DSM-IV | DXA | Spinal aBMD |
| HC | 23 | Hip aBMD | ||||||
| Distal radius aBMD | ||||||||
| Femandez-Soto (2009) | AN | 31 | Cohort | Clinic outpatients | Healthy controls | DSM-IV | DXA | Spinal BMD |
| HC | 25 | Caucasian women | Whole body BMD | |||||
| Guo (2013) | AN | 26 | Cohort | Clinic psychiatrist referrals | Healthy controls | DSM-IV | DXA | Spinal BMD |
| HC | 24 | Age-matched | Hip BMD | |||||
| Whole body BMD | ||||||||
| Iketani, et al. (1995). | AN | 20 | Cohort | Clinic inpatients and outpatients | Healthy controls | DSM-III-R | DPA | Spinal BMD |
| BN | 10 | Age-matched healthy females | Whole body BMD | |||||
| HC | 10 | |||||||
| Karlsson (2000) | AN | 77 | Case-control | AN patients untreated with oestrogen therapy | Healthy controls | ICD-10 | DXA | Spinal BMD, aBMD and BMC |
| HC | 205 | Regular’ menstrual cycles | ||||||
| Femoral neck vBMD, aBMD and BMC | ||||||||
| Kooh (1996) | AN | 22 | Cohort | Clinic referrals: | Healthy controls | DSM-III-R | DXA | Femoral neck BMD |
| HC | 24 | Adolescent medicine clinic | School and university students, no oral contraceptives | Spinal BMD | ||||
| Naessen, et al. (2006) | BN | 77 | Cohort | Recruited from hospital advertisements | Healthy controls | DSM-IV | DXA | Whole body BMD |
| HC | 56 | Hospital advertising: hospital staff and students, no current diseases or medication prior to 3 months before the study | Spinal BMD | |||||
| Leg BMD | ||||||||
| Newton, et al. (1993). | BN | 20 | Cohort | ED outpatient treatment programme. | Healthy controls | DSM-IIIR | DXA | Spinal BMD |
| HC | 16 | Age and sex-matched controls from hospital staff notice boar ds | SCID to assess past AN [65] | |||||
| Maimoun (2014) | AN | 98 | Case-control | Hospital outpatients | Healthy controls | DSM-IV | DXA | Whole body aBMD |
| HC | 63 | Community advertisement | Spinal aBMD | |||||
| Dominant arm radius aBMD | ||||||||
| Total proximal femur aBMD | ||||||||
| Masala (2003) | AN | 17 | Cohort | Patients in weight gain programme | Healthy controls | ICD-10 | DXA | Spinal BMD |
| HC | 27 | Exclusion included medication or illness to affect bone | QCT | |||||
| Misra (2005) | AN | 23 | Cohort | Clinic referrals | Healthy controls | DSM-IV | DXA | Spinal BMAD |
| HC | 21 | Age-matched and bone age-matched | Hip BMD | |||||
| Adverts through healthcare providers and newspapers | ||||||||
| Misra (2007) | AN | 17 | Cohort | Paediatrician referrals | Healthy controls | DSM-IV | DXA | Spinal BMAD |
| HC | 19 | Age-matched and bone age-matched. | Hip BMD | |||||
| Femoral neck BMAD | ||||||||
| Mailings to paediatricians | Whole body BMD | |||||||
| Whole body BMC | ||||||||
| Misra (2011) | AN | 120 | RCT | Hospital outpatient treatment programme | Healthy controls | DSM-IV | DXA | Spinal BMD |
| HC | 40 | Mailings to paediatricians | Spinal BMAD | |||||
| Hip BMD | ||||||||
| Morris (2004) | AN | 51 | Cohort | ED specialist referrals | Control group data from department of medical physics | DSM-IV | DXA | Spinal BMD |
| BN | 26 | X-Ray | Whole body BMD | |||||
| HC | 40 | |||||||
| Olmos (2010) | AN | 51 | Prospective longitudinal cohort study. | ED unit outpatients | Healthy controls | DSM-IV | DXA | Spinal BMD |
| HC | 40 | Hospital advertisements | Femoral neck BMD | |||||
| Hip BMD | ||||||||
| Poet (1993) | AN | 18 | Cohort | Hospital outpatients | Healthy controls | DSM-III-R | DXA | Spinal BMD |
| HC | 36 | Volunteers | ||||||
| Resell (2000) | AN | 20 | Cohort | Hospital outpatients | Healthy controls | DSM-III-R | DXA | Spinal BMD |
| HC | 20 | Age-matched nursing school students | Hip BMD | |||||
| Seemaii (1992) | AN | 65 | Cohort | Patients with AN | Healthy controls | DSM-III-R | DXA | Spinal BMD |
| HC | 52 | Volunteers with no illness that affects the bone, no drugs, medication | Proximal femur BMD | |||||
| Femoral neck BMD | ||||||||
| Ward’s triangle BMD | ||||||||
| Trochanter BMD | ||||||||
| Soyka(1999) | AN | 19 | Cohort | Healthcare provider referrals | Healthy controls | DSM-IV | DXA | Spinal BMD |
| HC | 19 | Advertisement in primary care providers and newspapers, BMI 25th-90tli percentile, one pre-menarche | Spinal BMC | |||||
| Lateral spine BMD | ||||||||
| Whole body BMD | ||||||||
| Suiidgot-Borgen, et al. (1998). | AN | 13 | Case-control | Clinic referrals | Healthy controls | DSM-IV | DXA | Spinal BMD |
| BN | 43 | University information board recruitment | Whole body BMD | |||||
| HC | 17 | Femoral neck BMD | ||||||
| Comprehensive inclusion criteria for dietary, exercise and ED symptoms | Leg BMD | |||||||
| Aim BMD | ||||||||
| van Marken (1997) | AN | 12 | Cohort | Non-hospitalised outpatients. | Healthy controls | DSM-III-R | DXA | Whole body BMD |
| HC | 16 | Whole body BMC | ||||||
| Normal weight participating in a study on energy expenditure | ||||||||
| Walsh (2010) | AN | 8 | Cohort | Hospital outpatients | Healthy controls | DSM-IV | DXA | Spinal BMD |
| HC | 6 | 90–100 % ideal weight for age | Flat-panel volume computed tomography (CT) | Hip BMD | ||||
| Femoral neck BMD | ||||||||
| Wojcik (2010) | AN | 15 | Cohort | Healthcare referrals and community adverts | Healthy controls | DSM-IV | DXA | Spinal BMD |
| HC | 16 | Community advertisement recruitment | Hip BMD | |||||
| Femoral neck BMD | ||||||||
| Whole body BMD |
Study characteristics of included studies in the meta-analysis
PET positron emission tomography, CT computerised tomography, Spinal refers to the measurement of BMD at the lumbar spine, BMD bone mineral density, BMAD bone mineral apparent density, aBMD a real bone mineral density, n number
Fig. 1.

A PRISMA diagram to summarise the meta-analysis search strategy including the identification of potential studies, screening of abstracts, identification of those which fit the eligibility criteria and finally, the included sample. AN anorexia nervosa, BN bulimia nervosa.
Table 1 includes the 27 eligible studies that were conducted across 11 countries between 1990 and 2014. BMD was assessed in a total of 2359 participants, of which 972 had an ED (785 with AN and 187 with BN). The patients were all outpatients or patient referrals from clinics and all of the participants were female. Six studies assessed patients with BN, and four of these studies included BN participants with a history of AN. The mean age range was 15.9–34.3 years for AN studies, 22–27.7 years for BN studies and 15.1–37.4 years for HCs.
All of the included studies used dual-energy X-ray absorptiometry (DXA) scanning (n = 26) or dual photon absorptiometry scanning (DPA) (n = 1) to measure BMD (also referred to in some studies as aBMD (areal Bone Mineral Density)), or used DXA measures to derive BMAD (bone mineral apparent density). Both DPA and DXA scanning have been found to have high clinical precision and accuracy [41]. Two studies used both DXA and QCT (quantitative computed tomography) methods [42, 43], one used DXA and MRI [8], one used DXA and X-Ray [44] to assess bone health and one used DXA and CT (flat-panel volume computed tomography) scanning to assess bone strength [45]. Only the DXA or DPA BMD or BMAD value was used in this meta-analysis. Five studies assessed hormonal parameters in patients and controls by assessing biological concentrations of hormones [12, 13, 32, 46, 47], and one RCT assessed the effect of oestrogen administration on BMD in adolescent girls [48], but only the baseline BMD measures were included in the current meta-analysis.
Diagnosis of an eating disorder
All of the participants had been diagnosed with AN or BN by using the DSM-III, DSM-IV [5] or ICD-10 (International Classification of Diseases, 10th Edition) [49]. All ED participants had been previously diagnosed by a health practitioner and referred to an eating disorder clinic where they were recruited, or their diagnosis was confirmed by a study psychiatrist. One study used a structured clinical interview (SCID) for diagnosis [50]. The mean BMI (body mass index) of participants was 16.65 kg/m2 (AN), 21.16 kg/m2 (BN) and 22.06 kg/m2 (HC).
Selection of controls
All of the controls used were normal weight and had no current or past history of EDs. Six studies used age-matched controls, and two used age-matched and bone age-matched controls may underestimate the impact of AN on bone, there was a significant effect of AN on BMD in these studies [46, 51]. All but nine controls had normal menstruation [52, 53] and all controls were recruited from the same geographical location as their corresponding ED participants. Studies recruited controls through community advertisements (n = 5), advertisements across healthcare providers to patients and staff (n = 7) and advertisements within universities to staff and students (n = 4). The remaining studies did not give details of the recruitment of controls.
Methodological quality
The Newcastle-Ottawa scale (NOS) assessments of bias results are presented in Table 2. The general quality of the included studies in this meta-analysis was high, although the lowest scoring studies received only 2 out of 10 stars. The mean score was 4.9* and the scores ranged from 2*–7*. A high quality rating depends on three characteristics: the selection of the study groups; the comparability of the groups; and the ascertainment of either the exposure or outcome of interest for case–control or cohort studies, respectively. There was generally adequate definition of cases and controls and the majority of studies reported a replicable and valid design and analysis. However, none of the studies reported drop-out or non-response rate and only six of the studies used the same method of ascertainment for cases and controls. The NOS assessment was not used as a tool for exclusion of studies in this meta-analysis.
Table 2.
Newcastle-Ottawa scale results for quality assessment
| Author (year) | Selection | Comparability | Exposure | Total |
|---|---|---|---|---|
| Bredella (2012) | *** | * | ** | 6* |
| Bredella (2008) | **** | ** | ** | 8* |
| Bredella (2009) | *** | * | * | 5* |
| Davies, et al. (1990). | *** | * | 4* | |
| Faje (2013) | ** | * | * | 4* |
| Fernandez-Soto (2013) | ** | * | * | 4* |
| Guo (2013) | ** | * | ** | 5* |
| Iketani et al. (1995). | ** | ** | * | 5* |
| Karlsson (2000) | *** | * | 4* | |
| Kooh (1996) | ** | * | * | 4* |
| Masala (2003) | *** | * | * | 5* |
| Misra (2005) | *** | ** | * | 6* |
| Misra (2007) | *** | ** | * | 6* |
| Misra (2011) | ** | * | * | 4* |
| Maimoun (2014) | **** | * | * | 6* |
| Morris (2004) | **** | * | 5* | |
| Naessen, et al. (2006) | ** | * | 3* | |
| Newton, et al. (1993). | **** | ** | * | 7* |
| Olmos (2010) | *** | * | * | 5* |
| Poet (1992) | *** | * | * | 5* |
| Resch (2000) | *** | * | * | 5* |
| Seeman (1992) | *** | * | * | 5* |
| Soyka (1999) | *** | * | * | 5* |
| Sundgot-Borgen, et al. (1998). | **** | ** | * | 7* |
| Van Marken (1997) | ** | * | 3* | |
| Walsh (2010) | ** | * | * | 4* |
| Wojkik (2010) | ** | * | * | 4* |
Quality analysis of all included studies rated by two trained observers (LR) and (NM)
Meta-analysis results
In comparison to HC participants, participants with either ED had an average SMD in spinal BMD of −2.955 (p < 0.0001). The results of the meta-analysis are presented in Table 3.
Table 3.
Meta-analysis results
| Anatomical site | N | SMD | L 95 % CI | U 95 % CI | Z | p |
|---|---|---|---|---|---|---|
| AN only | ||||||
| Spinal | 22 | −3.681 | −4.738 | −2.625 | 6.83 | <0.0001 |
| Whole body | 13 | −1.782 | −2.517 | −1.047 | 4.75 | <0.0001 |
| Hip | 11 | −3.337 | −4.874 | −1.799 | 4.25 | <0.0001 |
| Femoral neck | 11 | −3.317 | −5.151 | −1.484 | 3.55 | <0.0001 |
| All BN Studies | ||||||
| Spinal | 6 | −0.472 | −0.688 | −0.255 | 4.28 | <0.0001 |
| Whole body | 4 | −0.329 | −0.573 | −0.084 | 2.63 | 0.513 |
| BN without history of AN | ||||||
| Spinal | 2 | −0.339 | −0.753 | 0.075 | 1.61 | 0.108 |
| Whole body | N/A | |||||
| BN and History of AN | ||||||
| Spinal | 4 | −0.521 | −0.775 | −0.268 | 4.03 | <0.0001 |
| Whole body | 3 | −0.259 | −0.529 | 0.011 | 1.88 | 0.060 |
Meta-analysis standardised mean differences and confidence intervals for the anorexia nervosa and bulimia nervosa groups vs. healthy control groups
N Number, Z z scores, p p value, L lower, U upper
The SMD in Spine BMD was more negative in AN vs. HC than in BN vs. HC, indicating a greater decrease in this parameter in AN versus BN. Further, the SMD in BMD at all anatomical sites was significantly more negative in the AN group than the HC group (see Table 3). Spine BMD (SMD, −3.681; p < 0.0001), hip BMD (SMD, −3.337; p < 0.0001) and femoral neck BMD (SMD, −3.317; p < 0.0001) showed the greatest difference in AN vs HCs, whereas whole body BMD (SMD, −1.782; p < 0.0001) showed a less negative SMD. Figure 2 presents the SMD in AN studies which measure spinal BMD.
Fig. 2.

A forest plot to show the standardised mean difference in spinal BMD between AN groups and HCs. Zero is the line of no effect, and all points to the left of zero indicate a reduction in spinal BMD in AN vs. HCs. SMD standardised mean difference.
The SMD was more negative in the AN group compared to HCs than the BN group compared to HCs at all anatomical levels (Table 3). The SMD between Spinal BMD in the BN group versus HCs was statistically significant (SMD, −0.472; p < 0.0001). However, whole body BMD (SMD, −0.329; p = 0.513) and femoral neck BMD (SMD, 0.211; p = 0.463) were not significantly lower in the BN group than in HCs, although these analyses included few studies (four studies reported whole body BMD and only one study reported femoral neck BMD). No studies investigated hip BMD in BN vs controls. Figure 3 presents the SMD in BN studies that measure spinal BMD.
Fig. 3.
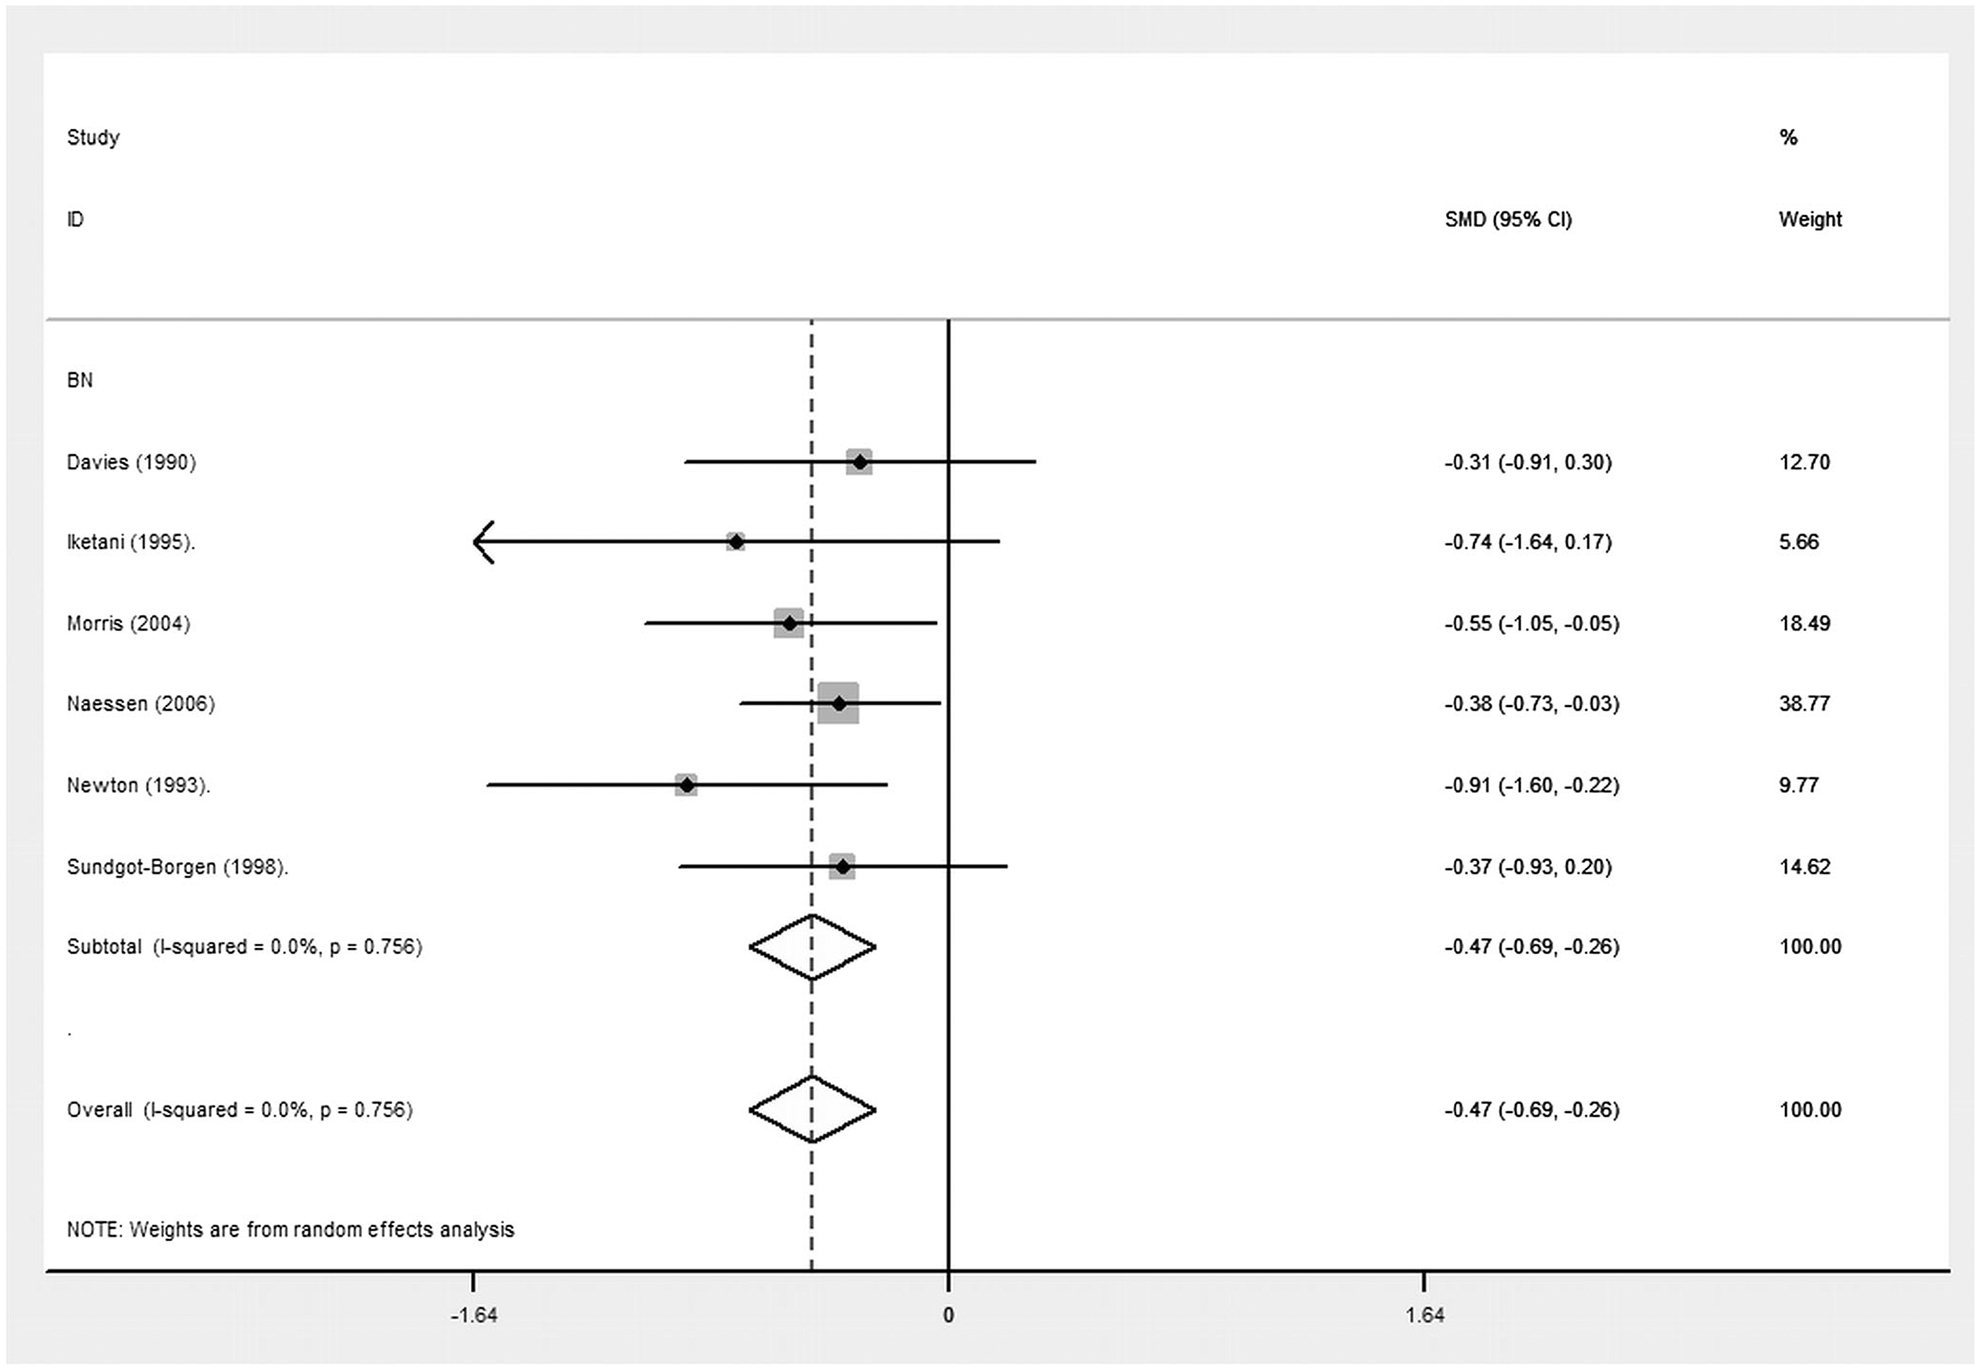
A forest plot to show the standardised mean difference in spinal BMD between BN groups and HCs. Zero is the line of no effect, and all points to the left of zero indicate a reduction in spinal BMD in BN vs. HCs. A Spinal BMD in BN groups. SMD = Standardised Mean Difference.
A post hoc meta-analysis was run exclusively on the BN studies (n = 6), and separated those studies with and without participants with a history of AN. Of the studies measuring BMD in BN participants, four included BN participants with a history of AN. BN participants with a history of AN [18, 20, 44, 54] had a significantly lower BMD than HCs (SMD, −0.521; p < 0.0001). However, the groups including participants with BN and no history of AN [10, 21] did not have a significantly lower BMD than HCs (SMD, −0.339; p = 0.108).
Meta-regression
Table 4 presents the results of the meta-regression which investigated the effects of age, BMI and duration since diagnosis (years) on spinal BMD in AN and BN groups. The results were statistically non-significant in multiple linear meta-regressions conducted on both AN and BN groups, although this was limited by the number of studies which could be included. Only eight AN studies and six BN studies included data which could be used in the meta-regression.
Table 4.
Meta-Regression Results
| Covariate | Coefficient | L 95 % CI | U 95 % CI | p |
|---|---|---|---|---|
| AN studies (N=8) | ||||
| Age | −0.609 | −2.976 | 1.757 | 0.514 |
| BMI | 0.942 | −2.234 | 4.118 | 0.457 |
| ED duration | 0.383 | −3.246 | 4.012 | 0.784 |
| BN studies (N=5) | ||||
| Age | −0.007 | −2.085 | 2.072 | 0.974 |
| BMI | −0.070 | −5.408 | 5.268 | 0.895 |
| ED duration | 0.076 | 0.633 | −1.424 | 0.633 |
Meta-regression results for the covariates influencing the spinal BMD in the anorexia nervosa and bulimia nervosa groups
N Number, p p value, L lower, U upper
Sensitivity analyses
The Higgins I2 heterogeneity statistic (98.3 %) indicates that there is heterogeneity in the 27 studies measuring spine BMD. Publication bias is suspected in the analysis, as indicated by the funnel plot in Figure 3, and the Egger test (t = 1.84; p < 0.0001) performed on AN and BN participants’ spine BMD measures. The trim and fill correction for missing data was performed and the SMD was converted to an exponential form which remained significant (SMD, 0.052; p < 0.0001). Karlsson (2000) and Seeman (1992) had particularly large effect sizes; when these two studies were removed from the analysis the SMD reduced and the confidence intervals narrowed (SMD, −2.019; p < 0.0001), but the significant effect persisted.
Discussion
Low BMD in ED participants can lead to a high prevalence of bone fractures resulting in pain and disability; by disentangling the commonalities and differences between the effects of different ED diagnosis on BMD we have the potential to inform future treatment options in this group based on the overlapping characteristics of the ED subtypes.
We conducted a comprehensive meta-analysis to examine the relationship between EDs and BMD, consisting of two primary meta-analyses on AN groups versus HCs and BN groups versus HCs. The spinal BMD was statistically lower in the BN groups than HCs but this effect was much smaller than in the AN groups. To investigate this result the BN groups were then separated into studies which included BN participants with a history of AN, and those studies with a criteria for BN with no history of other ED subtypes. Two further meta-analyses were conducted to investigate the spinal BMD in these BN subgroups versus HC groups.
Previous research have consistently found a low BMD in participants with AN, but have failed to reliably determine the relationship between BN and BMD. Based on the current study results, there is evidence that patients with both AN and BN have lower spine BMD than HCs. We found on average a lower spinal BMD in the AN group than the BN group in comparison to HCs, but the effect of BN on spinal BMD was statistically significant. A number of factors were investigated to explain this relationship and the strongest predictor of a low spine BMD in the BN group was the inclusion of participants with a past history of AN in the sample. It is apparent that despite a BMI comparable to HCs, a history of AN was sufficient to produce a statistically significant lower BMD in the BN group, suggesting that acute malnutrition and weight loss can have long lasting and critical effects on bone.
Our findings support previous research which has found that 92 % of patients with AN have BMD 1 SD below controls, and 38 % patients have BMD 2.5 standard deviations below controls [17]. We found that SMD between both AN and HC and BN and HC was greatest for spinal BMD and least for whole body BMD. Previous research has suggested that per SD decrease in fully size-adjusted bone density, fracture risk approximately doubles in adolescents—similar to that seen in adults [55]. A SMD of −3.7 (AN vs HC) is highly likely to be associated with an increased risk of fracture of between 150–300 % increase. An SMD of −0.5 (BN vs HC) may increase risk of fractures by between 25–50 %.
Age and BMI were potentially stronger predictors of low BMD in participants with AN than in BN, although a small number of studies measuring each factor led to lack of power in these analyses and possibly accounted for non-significance of these associations in the meta-regression. Previous research has found age, BMI and both the duration of the ED and the duration of amenorrhea to be significant predictors of BMD in participants with AN [56, 57], and the limited number of studies and the limited number of variables which could be included in this meta-regression is likely to be the reason that we have not found similar results. We could not directly separate participants according to menstrual status in this meta-analysis, and cannot draw conclusions regarding the impact of menstrual status on BMD.
Previous studies have found conflicting results regarding loss of BMD in patients with BN, some studies suggest that BN in combination with low body weight and amenorrhea is predictive of low BMD [20]. In other studies, subgroup analysis determined that only those BN participants with a prior history of AN had lower spine BMD than HCs [18, 20]. In our meta-regression, age, BMI and duration since diagnosis of the ED were not predictive of spine BMD in the BN group, and there were not enough studies measuring whole body and femoral neck BMD to conduct a meta-regression for these endpoints.
We identified methodological issues in the studies included that may be important in the design of future studies, and these are useful in explaining the non-significant results of the meta-regressions. The majority of studies that we excluded from this meta-analysis failed to clearly define the ED diagnosis. Moreover, within included studies, the wide ranges of age, BMI and illness duration in both subgroups meant that the mean values used in the meta-regression might not capture the large variability within studies. Figure 2 indicates that Karlsson (2000) and Seeman (1992) are outliers in this analysis. Karlsson (2000) included participants who had exclusively received no treatment for their ED, and Seeman (1992) included participants who exclusively had secondary amenorrhea. The variability in characteristics of participants in this meta-analysis limits between-group comparisons and may explain the heterogeneity in the data.
Based on our quality analysis, the studies with the poorest quality assessment rating were limited in their elaboration of the representativeness of cases and controls, and particularly the ascertainment of disorder in cases. Variation in an ED diagnosis may account for the lack of predictors identified for spine BMD in either the AN or BN subgroups. The overall quality of the systematic review was high, meeting 25 of 27 criteria using PRISMA guidelines [58]. Despite potential bias in studies included in this review, their results give a consistent representation of the relationship between an ED and BMD.
A recent review on AN and bone loss by Misra (2014) reported that low BMD is a consequence of AN in both sexes and across a wide age range. Studies also suggest that bone health may not fully recover until weight has been regained [59] and normal nutritional status established [60], although the rate of recovery may vary according to the nature and duration of the ED and adolescents may show only partial ‘catch up’ [61]. However, this study found that despite a BMI similar to HCs, the BN sample had a significantly lower spinal BMD. This finding suggests that weight alone does not account for the difference in BMD, and the BN sample has other characteristics including a history of AN, perhaps relapses into AN and a continued poor nutritional status which may contribute to a lower BMD. These findings suggest that both AN and BN patients should be screened for low BMD with a DXA scan at an early age.
Data are lacking regarding the magnitude of the difference in BMD when an ED begins in adolescence versus adulthood, and there are no longitudinal studies that have determined the long-term effects of adolescent onset ED on peak bone mass and BMD in adulthood. The pattern of BMD loss in women with lifetime EDs is still unknown and longitudinal data are necessary to determine if BMD decreases at a consistent rate throughout life, or if there is a rapid decrease in the initial stages of an ED followed by low but stable BMD throughout life.
Although recent studies have shown some evidence for a positive effect of oestrogen replacement on bone loss in AN, given the limited treatment options, preventive methods are vital to reduce osteoporosis in this clinical group. This meta-analysis suggests that low BMD occurs in BN as well as AN. We propose that a multi-dimensional approach is needed to fully understand the impact of an ED on BMD.
Impaired nutrition, which causes changes in lean and fat mass and multiple hormonal alterations, contributes to impaired bone metabolism in AN [25]. The strongest and most consistent predictor of an increase in BMD following recovery from AN is weight gain; however, no single body composition or hormonal factor can account for this improvement, which is typically incomplete in adolescents. BMD in AN is lower than that predicted by weight loss alone [62], suggesting that there is a cascade of events associated with increased energy availability (including a normalisation of hormone secretion and a positive effect on protein synthesis promoting bone remodelling) which may account for the lower BMD in both AN and BN groups, suggesting that common methods of treatment should be used for both ED subtypes which focus on more than weight gain alone [63].
Strengths and limitations
The objectivity of this meta-analysis is its main strength, provided by a quantitative measurement of BMD in different participant groups. Due to the small number of studies and the heterogeneity within these, it was not possible to make conclusions based on the meta-regression and it was thus difficult to measure trends in participant characteristics relating to the loss of BMD. Furthermore, due to the limited number of BN studies and the lack of adolescent BN participants, it was not possible to make inferences about bone accrual over time.
This study compares studies that measure BMD across four anatomical locations in AN participants, and two anatomical locations in BN participants. The varying loss of bone mass in different anatomical locations found in this study provides the foundation for future research to investigate which regions of the skeleton are most vulnerable to the effects of an ED, and factors such as exercise and nutrition that influence bone health.
The significant association between BN and BMD is an important finding of this study, but the varying history of AN in several of the BN samples confounds this finding. This is both a strength and limitation of this meta-analysis. It is beneficial to know that a history of AN puts women with BN at risk for secondary osteoporosis, however the ever-changing nature of psychiatric disorders, and particularly eating disorders, makes it problematic to study one condition in isolation. Thus the very low sample size of women exclusively with BN makes it difficult to determine the effect of BN with no history of AN on BMD.
Finally, several studies report bias in the control groups, including self-selected controls for a study on energy expenditure [64] and for a fitness and dietary study [10]. Furthermore, no studies in this meta-analysis screened the control groups using a structural clinical interview for DSM (SCID) [65]. A meta-analysis of this kind relies on the accurate formulation of groups to enable optimal group comparisons, and bias in the control groups may influence the accuracy of results.
Conclusion
We found a significant reduction in spinal BMD in both AN and BN ED subtypes. The greater reduction in spinal BMD in the AN group suggests that characteristics particular to this disorder play a key role in the subsequent loss of bone mass. However, the reduced spinal BMD in the BN group, despite a similar BMI to HCs, suggests that weight loss alone does not account for the low spinal BMD in participants with an ED. The limited number of BN studies investigating whole body BMD, and the absence of BN studies investigating femoral neck and hip BMD in comparison to HCs limits the comparisons we can make between AN and BN groups at other anatomical sites. Particular attention should be paid to adolescents with an ED, as loss of bone mass in adolescents may be to some extent irreversible. Future research should accurately determine the key correlates of bone loss and accordingly should develop a multifaceted and targeted treatment plan.
Acknowledgments
Funded by CHRAT (Child Health Research Appeal Trust) Studentship: 2014–2017
Footnotes
Conflicts of interest None.
Electronic supplementary material The online version of this article (doi:10.1007/s00198-015-3468-4) contains supplementary material, which is available to authorized users.
References
- 1.Gehlbach SH, Avrunin JS, Puleo E (2007) Trends in hospital care for hip fractures. Osteoporos Int 18(5):585–91 [DOI] [PubMed] [Google Scholar]
- 2.Seeman E, Szmukler GI, Formica C, Tsalamandris C, Mestrovic R (1992) Osteoporosis in anorexia nervosa: the influence of peak bone density, bone loss, oral contraceptive use, and exercise. J Bone Miner Res 7(12):1467–74 [DOI] [PubMed] [Google Scholar]
- 3.Rigotti NA, Nussbaum SR, Herzog DB, Neer RM (1984) Osteoporosis in women with anorexia nervosa. N Engl J Med 311(25):1601–6 [DOI] [PubMed] [Google Scholar]
- 4.Fairburn CG, Harrison PJ (2003) Eating disorders. Lancet 361(9355):407–16 [DOI] [PubMed] [Google Scholar]
- 5.AP A. Diagnostic and statistical manual of mental disorders: DSM-5. ManMag, 2003 [Google Scholar]
- 6.Johnson JG, Cohen P, Kasen S, Brook JS (2002) Eating disorders during adolescence and the risk for physical and mental disorders during early adulthood. Arch Gen Psychiatry 59(6):545–52 [DOI] [PubMed] [Google Scholar]
- 7.Bredella MA, Fazeli PK, Freedman LM, Calder G, Lee H, Rosen CJ et al. (2012) Young women with cold-activated brown adipose tissue have higher bone mineral density and lower Pref-1 than women without brown adipose tissue: a study in women with anorexia nervosa, women recovered from anorexia nervosa, and normal-weight women. J Clin Endocrinol Metab 97(4):E584–E90 [DOI] [PMC free article] [PubMed] [Google Scholar]
- 8.Bredella MA, Fazeli PK, Miller KK, Misra M, Torriani M, Thomas BJ et al. (2009) Increased bone marrow fat in anorexia nervosa. J Clin Endocrinol Metab 94(6):2129–36 [DOI] [PMC free article] [PubMed] [Google Scholar]
- 9.Bredella MA, Misra M, Miller KK, Klibanski A, Gupta R (2008) Trabecular structure analysis of the distal radius in adolescent patients with anorexia nervosa using ultra high resolution flat panel based volume CT. J Musculoskelet Neuronal Interact 8(4):315. [PubMed] [Google Scholar]
- 10.Davies KM, Pearson PH, Huseman CA, Greger NG, Kimmel DK, Recker RR (1990) Reduced bone mineral in patients with eating disorders. Bone 11(3):143–7 [DOI] [PubMed] [Google Scholar]
- 11.Milos G, Spindler A, Ruegsegger P, Hasler G, Schnyder U, Laib A et al. (2007) Does weight gain induce cortical and trabecular bone regain in anorexia nervosa? A two-year prospective study. Bone 41(5):869–74 [DOI] [PubMed] [Google Scholar]
- 12.Faje AT, Karim L, Taylor A, Lee H, Miller KK, Mendes N et al. (2013) Adolescent girls with anorexia nervosa have impaired cortical and trabecular microarchitecture and lower estimated bone strength at the distal radius. J Clin Endocrinol Metab 98(5):1923–9 [DOI] [PMC free article] [PubMed] [Google Scholar]
- 13.Misra M, Klibanski A (2011) Bone metabolism in adolescents with anorexia nervosa. J Endocrinol Investig 34(4):324–32 [DOI] [PMC free article] [PubMed] [Google Scholar]
- 14.Heaney R, Abrams S, Dawson-Hughes B, Looker A, Looker A, Marcus R et al. (2000) Peak bone mass. Osteoporos Int 11(12):985–1009 [DOI] [PubMed] [Google Scholar]
- 15.Biller BM, Saxe V, Herzog DB, Rosenthal DI, Holzman S, Klibanski A (1989) Mechanisms of osteoporosis in adult and adolescent women with anorexia nervosa*. J Clin Endocrinol Metab 68(3):548–54 [DOI] [PubMed] [Google Scholar]
- 16.Rigotti NA, Neer RM, Skates SJ, Herzog DB, Nussbaum SR (1991) The clinical course of osteoporosis in anorexia nervosa: a longitudinal study of cortical bone mass. Jama 265(9):1133–8 [PubMed] [Google Scholar]
- 17.Grinspoon S, Thomas E, Pitts S, Gross E, Mickley D, Miller K et al. (2000) Prevalence and predictive factors for regional osteopenia in women with anorexia nervosa. Ann Intern Med 133(10):790–4 [DOI] [PMC free article] [PubMed] [Google Scholar]
- 18.Newton JR, Freeman CP, Hannan WJ, Cowen S (1993) Osteoporosis and normal weight bulimia nervosa—which patients are at risk? J Psychosom Res 37(3):239–47 [DOI] [PubMed] [Google Scholar]
- 19.Gordon CM, Goodman E, Emans SJ, Grace E, Becker KA, Rosen CJ et al. (2002) Physiologic regulators of bone turnover in young women with anorexia nervosa. J Pediatr 141(1):64–70 [DOI] [PubMed] [Google Scholar]
- 20.Iketani T, Kiriike N, Nakanishi S, Nakasuji T (1995) Effects of weight gain and resumption of menses on reduced bone density in patients with anorexia nervosa. Biol Psychiatry 37(8):521–7 [DOI] [PubMed] [Google Scholar]
- 21.Sundgot-Borgen J, Bahr R, Falch JA, Schneider LS (1998) Normal bone mass in bulimic women. J Clin Endocrinol Metab 83(9): 3144–9 [DOI] [PubMed] [Google Scholar]
- 22.Goebel G, Schweiger U, Kruger R, Fichter MM (1999) Predictors of bone mineral density in patients with eating disorders. Int J Eat Disord 25(2):143–50 [DOI] [PubMed] [Google Scholar]
- 23.Newman MM, Halmi KA (1989) Relationship of bone density to estradiol and cortisol in anorexia nervosa and bulimia. Psychiatry Res 29(1):105–12 [DOI] [PubMed] [Google Scholar]
- 24.Misra M, Aggarwal A, Miller KK, Almazan C, Worley M, Soyka LA et al. (2004) Effects of anorexia nervosa on clinical, hematologic, biochemical, and bone density parameters in community-dwelling adolescent girls. Pediatrics 114(6):1574–83 [DOI] [PubMed] [Google Scholar]
- 25.Misra M, Klibanski A (2014) Anorexia nervosa and bone. J Endocrinol 221(3):R163–R76 [DOI] [PMC free article] [PubMed] [Google Scholar]
- 26.Klibanski A, Biller BMK, Schoenfeld DA, Herzog DB, Saxe VC (1995) The effects of estrogen administration on trabecular bone loss in young women with anorexia nervosa. J Clin Endocrinol Metab 80(3):898–904 [DOI] [PubMed] [Google Scholar]
- 27.Strokosch GR, Friedman AJ, Wu S- C, Kamin M (2006) Effects of an oral contraceptive (norgestimate/ethinyl estradiol) on bone mineral density in adolescent females with anorexia nervosa: a double-blind placebo-controlled study. J Adolesc Health 39(6):819–27 [DOI] [PubMed] [Google Scholar]
- 28.Zipfel S, Seibel MJ, Lowe B, Beumont PJ, Kasperk C, Herzog W (2001) Osteoporosis in eating disorders: a follow-up study of patients with anorexia and bulimia nervosa. J Clin Endocrinol Metab 86(11):5227–33 [DOI] [PubMed] [Google Scholar]
- 29.Guo LJ, Jiang TJ, Liao L, Liu H, He HB (2013) Relationship between serum omentin-1 level and bone mineral density in girls with anorexia nervosa. J Endocrinol Investig 36(3):190–4 [DOI] [PubMed] [Google Scholar]
- 30.Karlsson MK, Weigall SJ, Duan Y, Seeman E (2000) Bone size and volumetric density in women with anorexia nervosa receiving estrogen replacement therapy and in women recovered from anorexia nervosa. J Clin Endocrinol Metab 85(9):3177–82 [DOI] [PubMed] [Google Scholar]
- 31.Maimoun L, Guillaume S, Lefebvre P, Philibert P, Bertet H, Picot MC et al. (2014) Role of sclerostin and dickkopf-1 in the dramatic alteration in bone mass acquisition in adolescents and young women with recent anorexia nervosa. J Clin Endocrinol Metab 99(4): E582–E90 [DOI] [PubMed] [Google Scholar]
- 32.Misra M, Miller KK, Cord J, Prabhakaran R, Herzog DB, Goldstein M et al. (2007) Relationships between serum adipokines, insulin levels, and bone density in girls with anorexia nervosa. J Clin Endocrinol Metab 92(6):2046–52 [DOI] [PubMed] [Google Scholar]
- 33.Wojcik MH, Meenaghan E, Lawson EA, Misra M, Klibanski A, Miller KK (2010) Reduced amylin levels are associated with low bone mineral density in women with anorexia nervosa. Bone 46(3): 796–800 [DOI] [PMC free article] [PubMed] [Google Scholar]
- 34.Flynn J, Foley S, Jones G (2007) Can BMD assessed by DXA at age 8 predict fracture risk in boys and girls during puberty?: an eight-year prospective study. J Bone Miner Res 22(9):1463–7 [DOI] [PubMed] [Google Scholar]
- 35.Ackerman KE, Sokoloff NC, De Nardo MG, Clarke H, Lee H, Misra M. Fractures in relation to menstrual status and bone parameters in young athletes. Medicine and science in sports and exercise. 2014 [DOI] [PMC free article] [PubMed] [Google Scholar]
- 36.Hedges LV, Vevea JL (1998) Fixed-and random-effects models in meta-analysis. Psychol Methods 3(4):486 [Google Scholar]
- 37.Higgins JP, Green S. Cochrane handbook for systematic reviews of interventions: Wiley Online Library; 2008 [Google Scholar]
- 38.Duval S, Tweedie R (2000) A nonparametric “trim and fill” method of accounting for publication bias in meta-analysis. J Am Stat Assoc 95(449):89–98 [Google Scholar]
- 39.Egger M, Smith GD, Schneider M, Minder C (1997) Bias in meta-analysis detected by a simple, graphical test. BMJ 315(7109):629–34 [DOI] [PMC free article] [PubMed] [Google Scholar]
- 40.Moher D, Liberati A, Tetzlaff J, Altman DG (2009) Preferred reporting items for systematic reviews and meta-analyses: the PRISMA statement. Ann Intern Med 151(4):264–9 [DOI] [PubMed] [Google Scholar]
- 41.Mazess R, Barden H, editors. Measurement of bone by dual-photon absorptiometry (DPA) and dual-energy X-ray absorptiometry (DEXA). Annales chirurgiae et gynaecologiae; 1987. [PubMed] [Google Scholar]
- 42.Masala S, Jacoangeli F, Fiori R, Mezzasalma FS, Marinetti A, Simonetti G et al. (2003) Densitometric evaluation in women with anorexia nervosa. Acta Diabetol 40(1):S177–S9 [DOI] [PubMed] [Google Scholar]
- 43.Resch H, Newrkla S, Grampp S, Resch A, Zapf S, Piringer S et al. (2000) Ultrasound and X-ray-based bone densitometry in patients with anorexia nervosa. Calcif Tissue Int 66(5):338–41 [DOI] [PubMed] [Google Scholar]
- 44.Morris J, Tothill P, Gard M, McPhail K, Hannan J, Cowen S et al. (2004) Reduced bone mineral density in bulimia as well as anorexia nervosa. Eur Eat Disord Rev 12(2):71–8 [Google Scholar]
- 45.Walsh CJ, Phan CM, Misra M, Bredella MA, Miller KK, Fazeli PK et al. (2010) Women with anorexia nervosa: finite element and trabecular structure analysis by using flat-panel volume CT. Radiology 257(1):167–74 [DOI] [PMC free article] [PubMed] [Google Scholar]
- 46.Misra M, Miller KK, Stewart V, Hunter E, Kuo K, Herzog DB et al. (2005) Ghrelin and bone metabolism in adolescent girls with anorexia nervosa and healthy adolescents. J Clin Endocrinol Metab 90(9):5082–7 [DOI] [PubMed] [Google Scholar]
- 47.Fernández-Soto ML, González-Jiménez A, Chamorro-Fernández M, Leyva-Martínez S (2013) Clinical and hormonal variables related to bone mass loss in anorexia nervosa patients. Vitam Horm 92: 259–69 [DOI] [PubMed] [Google Scholar]
- 48.Misra M, Katzman D, Miller KK, Mendes N, Snelgrove D, Russell M et al. (2011) Physiologic estrogen replacement increases bone density in adolescent girls with anorexia nervosa. J Bone Miner Res 26(10):2430–8 [DOI] [PMC free article] [PubMed] [Google Scholar]
- 49.Organization WH. The ICD-10 classification of mental and behavioural disorders: clinical descriptions and diagnostic guidelines: Geneva: World Health Organization; 1992 [Google Scholar]
- 50.First MB, Spitzer RL, Gibbon M, Williams JB. Structured clinical interview for DSM-IV® axis I disorders (SCID-I), Clinician Version, Administration Booklet: American Psychiatric Pub; 2012 [Google Scholar]
- 51.Misra M, Miller KK, Cord J, Prabhakaran R, Herzog DB, Goldstein M et al. (2007) Relationships between serum adipokines, insulin levels, and bone density in girls with anorexia nervosa. J ClinEndocrinol Metab 92(6):2046–52 [DOI] [PubMed] [Google Scholar]
- 52.Kooh SW, Noriega E, Leslie K, Muller C, Harrison JE (1996) Bone mass and soft tissue composition in adolescents with anorexia nervosa. Bone 19(2):181–8 [DOI] [PubMed] [Google Scholar]
- 53.Soyka LA, Grinspoon S, Levitsky LL, Herzog DB, Klibanski A (1999) The effects of anorexia nervosa on bone metabolism in female adolescents. J Clin Endocrinol Metab 84(12):4489–96 [DOI] [PubMed] [Google Scholar]
- 54.Naessen S, Carlstrom K, Glant R, Jacobsson H, Hirschberg AL (2006) Bone mineral density in bulimic women—influence of endocrine factors and previous anorexia. Eur J Endocrinol 155(2): 245–51 [DOI] [PubMed] [Google Scholar]
- 55.Clark EM, Ness AR, Bishop NJ, Tobias JH (2006) Association between bone mass and fractures in children: a prospective cohort study. J Bone Miner Res 21(9):1489–95 [DOI] [PMC free article] [PubMed] [Google Scholar]
- 56.DiVasta AD, Beck TJ, Petit MA, Feldman HA, LeBoff MS, Gordon CM (2007) Bone cross-sectional geometry in adolescents and young women with anorexia nervosa: a hip structural analysis study. Osteoporos Int 18(6):797–804 [DOI] [PMC free article] [PubMed] [Google Scholar]
- 57.Misra M, Miller KK, Almazan C, Ramaswamy K, Lapcharoensap W, Worley M et al. (2004) Alterations in cortisol secretory dynamics in adolescent girls with anorexia nervosa and effects on bone metabolism. J Clin Endocrinol Metab 89(10):4972–80 [DOI] [PubMed] [Google Scholar]
- 58.Moher D, Liberati A, Tetzlaff J, Altman DG, Group P (2010) Preferred reporting items for systematic reviews and meta-analyses: the PRISMA statement. Int J Surg 8(5):336–41 [DOI] [PubMed] [Google Scholar]
- 59.Olmos JM, Valero C, Del Barrio AG, Amado JA, Hernandez JL, Menendez-Arango J et al. (2010) Time course of bone loss in patients with anorexia nervosa. Int J Eat Disord 43(6):537–42 [DOI] [PubMed] [Google Scholar]
- 60.Dominguez J, Goodman L, Gupta SS, Mayer L, Etu SF, Walsh BT et al. (2007) Treatment of anorexia nervosa is associated with increases in bone mineral density, and recovery is a biphasic process involving both nutrition and return of menses. Am J Clin Nutr 86(1):92–9 [DOI] [PubMed] [Google Scholar]
- 61.Bachrach LK, Katzman DK, Litt IF, Guido D, Marcus R (1991) Recovery from osteopenia in adolescent girls with anorexia nervosa*. J Clin Endocrinol Metab 72(3):602–6 [DOI] [PubMed] [Google Scholar]
- 62.Valla Å, Groenning I, Syversen U, Hoeiseth A (2000) Anorexia nervosa: slow regain of bone mass. Osteoporos Int 11(2):141–5 [DOI] [PubMed] [Google Scholar]
- 63.Lee NK, Sowa H, Hinoi E, Ferron M, Ahn JD, Confavreux C et al. (2007) Endocrine regulation of energy metabolism by the skeleton. Cell 130(3):456–69 [DOI] [PMC free article] [PubMed] [Google Scholar]
- 64.Van Marken Lichtenbelt WD, Heidendal GAK, Westerterp KR (1997) Energy expenditure and physical activity in relation to bone mineral density in women with anorexia nervosa. Eur J Clin Nutr 51(12):826–30 [DOI] [PubMed] [Google Scholar]
- 65.First MB. Structured clinical interview for the DSM (SCID) The Encyclopedia of Clinical Psychology. 1995 [Google Scholar]