

Abstract
Background:
The internal anal sphincter (IAS) exhibits slow waves (SWs) and tone that are dependent upon L-type Ca2+ channels (CavL) suggesting that phasic events (i.e., SWs) play a fundamental role in tone generation. The present study further examined phasic activity in the IAS by measuring the spatiotemporal properties of Ca2+ transients (CTs) in IAS smooth muscle cells (SMCs).
Methods:
CTs were recorded with spinning-disk confocal microscopy from the IAS of SM-GCaMP mice. Muscles were pinned submucosal surface up at two different lengths. Drugs were applied by inclusion in the superfusate.
Key results:
CTs displayed ongoing rhythmic firings at both lengths and were abolished by nifedipine and the KATP channel activator pinacidil indicating their dependence upon CavL. Like SWs, CTs were greatest in frequency (average 70.6 cpm) and amplitude at the distal extremity and conducted proximally. Removal of the distal IAS reduced but did not abolish CTs. The time constant for clearing cytoplasmic Ca2+ averaged 0.46 sec and basal Ca2+ levels were significantly elevated.
Conclusions & Inferences:
The similarities in spatiotemporal and pharmacological properties of CTs and SWs suggest that SW give rise to CTs while muscle stretch is not required. Elevated relative basal Ca2+ in the IAS is likely due to the inability of cells to clear or sequester Ca2+ between rapid frequency voltage-dependent Ca2+ entry events, i.e., conditions that will lead to tone development. The conduction of CTs from distal to proximal IAS will lead to orally directed contractions and likely contribute to the maintenance of fecal continence.
Keywords: gastrointestinal, interstitial cells of Cajal, pacemaker, slow wave, tone
Graphical Abstract
Introduction
The internal anal sphincter (IAS) gives rise to approximately 70% of resting anal pressure1,2 thereby aiding in the maintenance of fecal continence. Disturbances of IAS motility can lead to a variety of different defecatory disorders3–5. The IAS differs from most of the GI tract in that it spontaneously develops tone; a feature that is essential for raising anal pressure. Our current understanding of the mechanisms responsible for tone generation in the IAS is incomplete. Significant emphasis has been placed by other groups on biochemical mechanisms that increase myofilament sensitivity to calcium (Ca2+) and thus tone6,7. However, the IAS also generates phasic electrical events, i.e., slow waves (SWs)8–10. SWs depolarize IAS smooth muscle cells (SMCs) into a range of membrane potentials where voltage dependent L-Type Ca2+ channels (CavL) are active giving rise to Ca2+ entry and contraction. We have proposed that Ca2+ entry occurring with SW activity plays a fundamental role in tone development in the IAS11. The present study further examines this proposition.
In previous studies SWs in the IAS were examined with microelectrode recording techniques. These studies revealed that SW are critically dependent upon L-type Ca2+ channel activity (CavL)9,12,13. The frequency and amplitude of SWs is greatest at the distal end of the IAS suggesting that this is the predominant pacemaker region. The present study further examines pacemaker activity in the IAS by imaging Ca2+ transients (CTs) in SM-GCaMP mice; transgenic mice that express the genetically encoded Ca2+ indicator GCaMP in SMCs. An important goal of these studies is to determine whether the spatiotemporal and pharmacological properties of CTs are sufficiently similar to SWs to conclude that SWs give rise to CTs. In addition, SM-GCaMP mice allow for visualization of the entire spatiotemporal pattern of activity in the IAS muscle sheet. This approach generates far more information than microelectrode studies that sample activity at only one or two points or from contractile studies that represent the summed activity of the entire muscle strip.
We have hypothesized that phasic Ca2+ entry events give rise to tone13,14. One mechanism that may be involved relates to SW frequency. The frequency of SWs in the IAS is significantly greater than that of other gastrointestinal (GI) muscles that do not generate tone (e.g., 30 cpm versus 8 cpm for the dog IAS versus rectum9). If SW frequency is rapid enough then there will be insufficient time between SWs for Ca2+ removal/uptake to reduce cytoplasmic Ca2+ below the contraction threshold. In skeletal muscle this condition occurs with higher stimulus frequencies and is referred to as partial (incomplete) tetanus15. A second goal of the present study is therefore to evaluate whether a partial tetanus-type mechanism might contribute to tone generation in the IAS. To do this we have estimated the rate of free cytoplasmic Ca2+ reduction and compared this to the frequency at which Ca2+ is delivered via CTs. Additional experiments were designed to determine whether this condition translates into elevated basal Ca2+ levels during spontaneous contractile activity.
A final aspect of this study examines the extent to which CTs are modified by muscle length. The motor activity associated with the mixing and propulsion of intestinal contents generally occurs in the presence of some muscle distension as luminal contents are manipulated. In contrast, the IAS usually remains closed, even when there is little or no distending force3. At present there is little information available regarding the degree to which IAS motility is modified by muscle length or indeed how in vivo length relates to the length/force relationship of this muscle. For these reasons the length/force relationship of the mouse IAS was determined along with an estimate of in vivo length. The spatiotemporal properties of CT were then examined at two different lengths selected from this length/force relationship.
In summary, this study examines pacemaker activity in the IAS by determining the spatiotemporal and pharmacological properties of CTs in SM-GCaMP mice. Specific experiments evaluate: 1) whether the properties of CTs are commensurate with SWs giving rise to CTs, 2) whether tone may be due, at least in part, to a partial tetanus type mechanism and, 3) the extent to which the behavior of CTs is dependent upon muscle length.
Materials and Methods
Ethical Approval.
Experiments and procedures performed in this study were approved by the Institutional Animal Use and Care Committee at the University of Nevada, Reno. All mice used were maintained in accordance with the National Institutes of Health Guide for the Care and Use of Laboratory Animals.
Animals.
Mouse strains and euthanasia:
For contractile studies 1.5–4 month old C57Bl/6 mice (n=20) of both sexes were used; these mice were purchased from Jackson Laboratories, Bar Harbor, ME. For Ca2+ imaging studies 2.5–5 month old male SM-GCaMP3 (n=15) and SM-GCaMP6f (n=14) mice were used. The generation of these mice is described below. All mice (C57Bl/6, SM-GCaMP3 and SM-GCaMP6f) were euthanized with isoflurane (Baxter, Deerfield, IL) and then cervically dislocated.
Generation of SM-GCaMP mice.
SM-GCaMP3 and SM-GCaMP6f mice were created by first crossing male smMHC-iCre mice (iCre present on the Y chromosome; Jim Stull, University of Texas Southwestern Medical Center, Dallas, TX) with female GCaMP3-flox mice (B6;129S-Gt(ROSA)26Sortm38(CAG-GCaMP3)Hze/J; #014538, Jackson Laboratories, Bar Harbor, ME) or female GCaMP6f-flox mice (B6;129S-Gt(ROSA)26Sortm95.1(CAG-GCaMP6f)Hze/J; #024105, Jackson Laboratories, Bar Harbor, ME). The F2 generation of SM-GCaMP3 or SM-GCaMP6f mice were injected intra-peritoneally with 2 mg tamoxifen for three consecutive days at 8 weeks of age. Mice were genotyped to determine turn on of GCaMP and were used at anywhere from 10 days to 3 months post-injection.
Tissue preparation.
The distal most 1 cm of the GI tract was removed as an intact tube and placed in ice cold Krebs-Ringer bicarbonate solution (KRBS) of the following composition (in mM): 118 NaCl, 4.7 KCl, 2.5 CaCl2, 23.8 NaHCO3, 1.2 KH2PO4, 11 dextrose pH of 7.4 after bubbling to equilibrium with 95% O2/5% CO2. Further details of dissection specific to each experiment are described below.
Length/force relationship for the mouse IAS.
Measurement of IAS diameter: The in vivo length of the IAS was estimated by removing the distal most section of the GI tract and leaving as an intact tube. The mucosa, anoderm and a ring of hairy skin were left in place and the external anal sphincter carefully dissected away in ice cold KRBS. Diameter (d) was measured at the level of the IAS with calipers and circumference calculated as π times d resulting in an average circumference of 7.5 ± 0.11 mm (n=7).
Length/force relationship measurements: To determine the length/force relationship of the IAS the rectoanal tube was cut open longitudinally and skin, anoderm and mucosa removed. A 1 mm wide strip of the entire IAS length was created. Muscle strips were attached with suture to stable mounts (one attached to a force transducer) and the distance between mounts set to the estimated in vivo length (7.5 mm). Muscles were then equilibrated in warm, oxygenated KRBS for 60 minutes. Thereafter the distance between mounts was reduced to the minimum length (5 mm) and experiments undertaken to characterize the length/force relationship of spontaneous and KCl-induced contractions at lengths between 5 and 13 mm. After recording contractile activity at each length, active and passive force were evaluated by replacing regular KRBS with Ca2+ free KRBS plus 1 mM EGTA for 5 minutes. Active force was observed at lengths above 5 mm (Fig. 1B) whereas passive force appeared at optimum length (Lo) and increased in amplitude as wire separation was increased (Fig. 1A). In vivo length was identified along the rising phase of the length/force relationship and was associated with ~66% maximum spontaneous contraction (Fig. 1B, red dot). The length/force relationships for KCl-induced contraction (Fig. 1A), tone and phasic contraction (Fig. 1B) were similar suggesting that the predominant factor determining these relationships is the degree of myofilament overlap.
Figure 1. Length/force relationship, in vivo length and muscle configurations used for Ca2+ imaging studies.

(A) Summary graph of active contraction elicited by increasing KCl in the bathing solution by 60 mM vs passive force for muscle lengths between 5 and 13 mm (n=9). Maximum KCl-induced contraction occurred between 9 and 11 mm (i.e., optimal length Lo) and declined above this range. Passive force began at Lo and progressively increased above this range. (B) Summary graph of spontaneous contraction (tone, phasic and total) vs length (5–13 mm, n=11). Lo for spontaneous contractions was similar to that of KCl-induced contraction. The red dot in A and B indicates in vivo length. For Ca2+ imaging studies lengths L1 and L2 (green) were used. (C,D) Cartoons depicting the muscle configurations used for Ca2+ imaging studies. Small white circles indicate distances at which CTs were measured. (C) Configuration used for evaluating whether muscle length affects the spatiotemporal properties of CTs. Paired muscle segments were pinned at length L1 or L2 (L2 = 1.43 × L1). Since a single muscle was cut in half to create paired segments, L1 and L2 (designated in A as 7 and 10 mm respectively) become 3.5 and 5 mm respectively. The width of L2 muscles was also increased 1.43x (i.e., from 4 to 5.7 mm). (D) Configuration used for evaluating the dependence of pacemaker activity on the distal edge of the IAS. A single muscle was cut longitudinally into two segments, each pinned at dimensions 4 × 4.6 mm (i.e., near the in vivo length). The control segment (left) remained intact while the other segment was cut 300 μm from the distal edge (black line, right). The left segment also used to compare CTs in the IAS to those of rectum.
Contractile data was collected, stored and analyzed using AcqKnowledge 3.9.1 Software (Biopac Systems Inc., Goleta, CA). As previously described13, the average peak and trough values for phasic contractions were determined for 60 sec of spontaneous activity. Phasic contractile amplitude was then defined as the difference between the average peak and trough value while tone was defined as the difference between average trough value and zero active force established with Ca2+ free KRBS plus 1 mM EGTA.
Calcium imaging experiments.
For Ca2+ imaging studies, muscles were equilibrated with continuous perfusion of warmed KRBS at 37°C for 1 h. Imaging was performed with a spinning-disk confocal microscope (CSU-X1 spinning disk; Yokogawa Electric Corporation, Tokyo, Japan) mounted to an upright Olympus BX51WI microscope equipped with an Olympus 4x, 0.13 NA UPlanFL N lens (Olympus, Tokyo, Japan). GCaMP3/GCaMP6f, expressed in SMC within the IAS muscles, was excited at 488 nm using a laser (Coherent OBIS; Coherent Inc., Santa Clara, CA, USA) and the emitted fluorescence (>515 nm) was captured using a high-speed EMCCD Camera (Andor iXon Ultra; ANDOR Technology, Belfast, UK). Image sequences were acquired at 17 fps using Andor Solis software (ANDOR Technology, Belfast, UK). Since the only difference noted between SM-GCaMP3 (n=15) and SM-GCaMP6f (n=14) mice was the brighter signal present in SM-GCaMP6f mice, data from these mice were combined. In all tissues, the Ca2+ fluorescence intensity was adjusted in real-time via the acquisition software prior to capturing the recordings thus ensuring that the fluorescence intensity was similar between tissues regardless of the baseline brightness of the Ca2+ signal. These intensity settings were kept constant throughout the experiment.
Stimulating electrodes were placed at the distal and proximal edge of muscle segments and electrical field stimulation (EFS) was applied (Grass S48 stimulator; 5 Hz, 10 s) in the presence of atropine (1 μM) to activate inhibitory motor neurons.
The spatiotemporal properties of CTs were determined at 2 different lengths, i.e., one slightly below Lo (L1) and one within the Lo range (L2) (Fig. 1C). A sheet of muscle comprising the distal most 4 mm of the GI tract (pinned flat but not stretched) was created. This muscle was then cut in half longitudinally and one half pinned to the Sylgard base of the recording chamber at length L1 (i.e., 3.5 mm × 4 mm) and the other half stretched and pinned at length L2 (i.e., 5 mm × 5.7 mm) (Fig. 1C).
For experiments evaluating whether pacemaker cells are located throughout the IAS, the distal 4 mm of the GI tract was also cut longitudinally into two segments but in this case only a single length and width were used (i.e., 4 mm × 4.6 mm, Fig. 1D)). One piece (left) served as the control whereas an incision was made in the second piece (right) with a micro-scalpel separating the distal 300 μm of muscle from the remaining muscle. Activity in the control muscle was then compared to the activity within the two separated sections of muscle. Additional experiments used the control muscle segment shown in Fig. 1D to compare the properties of CTs in the IAS to those of the rectum.
Analysis of Ca2+ activity.
Recordings of Ca2+ activity from the IAS were imported into custom analysis software (Volumetry G8d, provided by Dr. Grant Hennig, University of Vermont, Burlington, VT). For initial pre-processing analysis, tissue movement was stabilized to ensure accurate Ca2+ event analysis and image filtering and background subtraction was applied as previously described16. Regions of interest (ROIs) were used to generate spatio-temporal (ST) maps of Ca2+ activity recorded in situ. ST maps were then imported as TIFF files into Image J (version 1.8, National Institutes of Health, Bethesda, MD, USA).
Conduction velocity (mm/sec) was determined with Image J. Since conduction velocity varied significantly across the muscle width the value quantitated in this study was obtained by selecting events originating at the distal extremity with a constant slope over at least 0.25 mm. The conduction velocities obtained for muscles pinned at L1 or L2 length (Fig. 1C) were then normalized to muscle mass by converting length to “percent distance to oral position”. The oral position selected for L1 muscles was 1.3 mm from the distal extremity. Since L2 muscles were stretched to 1.43 × L1 width, the equivalent oral position for L2 muscles was 1.43 × 1.3 mm = 1.86 mm. These oral positions were assigned 100% and lesser distances were scaled accordingly (e.g., 8%, 38% and 77% to oral position).
CTs amplitudes were expressed as (F/F0) and calibrated for the whole field of view (FOV). The minimum CT fluorescence level was assigned as 1 while the peak was assigned as 2. To compare the fluorescence intensities occurring at the distal end of the muscle to more proximal positions recorded in the same FOV, the average minimum CT level at the proximal position was again assigned as 1 and the calibration established for the distal end (highest intensity) applied. Average CT amplitude was determined manually by measuring all peak and trough values during 10 sec of activity using AcqKnowledge 3.9.1 software (Biopac Systems, Inc., Goleta, CA).
Statistics.
ANOVA was used for multiple comparisons followed by post-hoc Tukey’s or Dunn’s. A simple t-test was used when comparing 2 populations. n values indicate number of animals unless otherwise stated. Shown are mean values ± S.E.M.
Drugs.
Atropine sulphate, pinacidil, nifedipine, EGTA (ethylene glycol-bis(2-aminoethylether)-N,N,N’,N’-tetraacetic acid) and tamoxifen were purchased from Sigma-Aldrich (Saint Louis, MO, USA). Stock concentrations of atropine and pinacidil were made by dissolving in de-ionized water. Nifedipine was dissolved in ethanol. Final concentrations were achieved by further dilution in KRBS. EGTA was dissolved to final concentration in KRBS. Tamoxifen was firstly dissolved in ethanol before addition of safflower oil to make a final concentration of 20 mg ml−1.
Results
Spatiotemporal properties of Ca2+ transients.
CTs were imaged in 29 SM-GCaMP rectoanal tissues with confocal microscopy. Images were captured at low magnification (4x) to facilitate visualization and recording of activity within larger areas. The spatiotemporal properties of CTs in muscles at length L1 and L2 length were compared (see methods and Fig. 1C). CTs consistently arose from the distal extremity and conducted proximally (Fig. 2A). The frequency of CTs at the distal extremity averaged 67.9±3.4 cpm for L1 muscles and 73.3±2.2 cpm for L2 muscles. These frequencies were not significantly different (p>0.05, n=11). Both CT frequency and amplitude declined in the proximal direction. Neither the relationship between frequency and distance (Fig. 2C) nor of amplitude and distance (Fig. 2D) was significantly different in L1 vs. L2 muscles (p>0.05, n=11).
Figure 2. Ca2+ transient amplitude and frequency decline from distal to proximal IAS.

(A) Spatiotemporal (ST) maps of paired muscle segments pinned to length L1 (left) or L2 (right). For further details see Fig. 1C. Distance is on the x-axis (distal edge on right) and time is on the y-axis (zero time at top). (B) Sample traces of CTs from the ST maps shown in part A. Percentages denote the distance toward the oral position (100% = 1.3 mm for L1 and 1.86 mm for L2 muscles). Distances are also depicted as dots at the top of the ST maps in A (leftmost dot in each ST map is the “oral position”, i.e., 100%). (C) Summary graph of CT frequencies with distance. Frequency was greatest in the distal region and declined proximally. The frequency relationships for L1 and L2 muscles were not different (p>0.05, n=11). (D) Summary graph of CT amplitudes (normalized to the distal extremity) with distance. Amplitude was greatest near the distal edge and declined proximally. The amplitude relationships for L1 and L2 muscles were not different (p>0.05, n=11). Shown are mean values ± S.E.M.
Although CTs consistently arose from the distal extremity (Fig. 3A–C) there was still considerable variation in the rate at which they progressed in the oral direction. This variation was due in part to the occasional appearance of CTs arising from ectopic sites. The activity originating at ectopic sites conducted either proximally, distally or in both directions and sometimes collided with the CT arising from the distal extremity (Fig. 3B,C). Ectopic CTs were not limited to a single position and occurred at a rate that was ~23% of the distal extremity rate (21.1±5% for L1 and 24.4± 3.5% for L2 muscles, n=7, p>0.05). An estimate of CT conduction velocity was attained by selecting those CTs exhibiting a consistent time-dependent progression in the oral direction (Fig. 3A). These measurements revealed a CT conduction velocity in L2 muscles that was significantly greater than in L1 muscles (i.e., 1.87±0.15 mm/sec, 1.03±0.10 mm/sec respectively, n=12, p<0.05) even after normalizing for muscle mass (1.31±0.10 mm/sec, 1.03±0.10 mm/sec respectively, n=12, p<0.05).
Figure 3. Examples of the origin and spread of Ca2+ transients.

Sample 3-dimensional plots showing variations in the pattern of CT activity as a function of time and distance in the rectoanal region. The direction of conduction is indicated with white arrows. The first example (A) shows the fundamental pattern of activity observed in almost all muscle segments, consisting of large amplitude CTs at the distal edge that decline proximally. The second example (B) shows activity arising from the distal extremity as well as an ectopic site originating before the distal event. The ectopic event conducts both proximally and distally, colliding with the distal event. The third example (C) shows activity arising from the distal extremity as well as an ectopic site that conducts predominantly in the proximal direction.
To determine whether pacemaker activity is confined to the distal extremity, CTs were compared in control muscles versus muscles cut into two pieces consisting of 1) the distal 300 μm and 2) the remaining proximal muscle (see Fig. 1D). The frequency of CTs in the isolated distal region was significantly greater (p<0.05) than in the intact distal region (Fig. 4A,C); perhaps because the proximal muscle serves as a drain limiting distal CT frequency. Importantly however, the proximal side of the cut muscle also generated CTs. The frequency of CTs in the proximal cut region was significantly lower than that of the proximal intact muscle (p<0.05, Fig. 4B,C), possibly because the proximal cut region was no longer under the influence of the faster distal pacemaking region.
Figure 4. Cells generating rhythmic calcium transients are located at more than one site in the IAS.

Sample traces of CTs in the intact (left) and cut (right) distal IAS (A) and in the intact (left) and cut (right) proximal IAS (B) (see methods and Fig. 1D for details). (C) Summary graph of average CT frequencies (cpm) recorded at each site (n=8). The frequency of CTs in the cut distal IAS was significantly greater (*p<0.05) than in the intact distal IAS whereas the frequency of CTs in the cut proximal IAS was significantly less than in the intact proximal IAS (*p<0.05). Shown are mean values ±S.E.M.
Contribution of CavL to Ca2+ transients in the IAS.
Contraction and SWs in the IAS are dependent upon Ca2+ entry through CavL since both are abolished by CavL blockers or by hyperpolarizing membrane potential below the CavL activation threshold with the KATP channel activator pinacidil9,12–14. Additional experiments were therefore undertaken to examine whether CTs are also sensitive to these same maneuvers. Superfusion of IAS muscles with either the CavL channel blocker nifedipine (0.1 μM) or pinacidil (10 μM) abolished CTs (Fig. 5) supporting a critical role for CavL in these events.
Figure 5. Ca2+ transients are dependent upon L-type Ca2+ channels.

Sample traces showing CTs at the distal end of the IAS before (control) and after addition of the CavL blocker nifedipine (0.1 μM, A) or the KATP channel activator pinacidil (10 μM, B). Both drugs abolished CTs (n=8 nifedipine, n=7 pinacidil).
Determination of basal Ca2+ levels between rapid frequency Ca2+ transients.
The basal Ca2+ levels between Ca2+ transients was evaluated to determine if a partial tetanus-type mechanism may contribute to tone generation in the IAS. Control spontaneous CTs were recorded for 10 s followed by 10 s of EFS (5 Hz, 1 μM atropine present) to stimulate inhibitory motor nerves and abolish contraction8,11. EFS abolished phasic CTs and significantly reduced basal Ca2+ levels at the distal end of the IAS; this was followed by a large elevation of Ca2+ levels after terminating EFS due to rebound excitation (Fig. 6A,B). Phasic CT amplitude was not different from elevated basal Ca2+ in L1 muscles whereas there was a small but significant difference (p<0.05) in L2 muscles (Fig. 6C). The rate of Ca2+ removal was estimated from these data by fitting the declining phase of individual CTs to a decaying single exponential function (see fitted curve in Fig. 6B). The average time constant (τ) derived in this manner was 0.46 sec (Fig. 6D). Given that the average frequency of CTs is ~70 cpm (Fig. 2C) this Ca2+ removal rate is not sufficient to lower cytoplasmic Ca2+ to sub-contractile levels before the arrival of the next CT. These data support a partial tetanus-like mechanism in which Ca2+ entry exceeds Ca2+ removal resulting in elevated basal Ca2+ levels and tone.
Figure 6. Rapid frequency Ca2+ transients elevate basal Ca2+ levels.

(A) Spatiotemporal (ST) map of CTs in a 100 × 200 μm region of interest (ROI) in the distal IAS during control spontaneous activity (left) followed by 10 sec of electrical field stimulation (EFS 5 Hz, atropine 1 μM) and ending with post-stimulus rebound excitation. EFS blocked phasic CTs and reduced basal Ca2+ levels. (B) Sample trace of CTs occurring within the ROI before, during and after EFS. An exponential decay curve was fitted to the declining phase of a CT resulting in a time constant (τ) of 0.44 sec. (C) Summary graph of the percentage of the total spontaneous Ca2+ signal that was phasic vs basal Ca2+. Asterisk (*) indicates the only significant (p<0.05) difference between means (n=5). (D) Summary graph of the time constant for Ca2+ removal in L1 and L2 muscles (n=11). Values were not significantly different (p>0.05). Shown are mean values ± S.E.
Since CT frequency and amplitude decline in the proximal direction (Fig. 2) we also evaluated whether basal Ca2+ levels decline proximally. Examples of the time-dependent changes in CTs occurring at three positions within the IAS (see methods) before, during and after EFS are shown in Fig. 7A. These examples reveal declining basal Ca2+ levels in the proximal direction for L1 and L2 muscles. This relationship is summarized in Fig. 7B.
Figure 7. Basal Ca2+ levels decline in the proximal direction.

(A) Superimposed traces of CTs at 8%, 38% and 77% of the distance toward the oral position (100% = 1.3 mm for L1 and 1.86 mm for L2 muscles). Traces were superimposed based upon the level of Ca2+ present during EFS (5 Hz, 10 s). Note the progressive decline in elevated basal Ca2+ from distal to proximal IAS for L1 (left) and L2 (right) muscles. (B) Summary graph of the decline in elevated basal Ca2+ levels with distance. L1 and L2 muscles were not different (p>0.05). “Zero” is not an absolute value, rather it represents the point at which EFS does not reduce basal Ca2+ level below that occurring spontaneously. (C) Summary graph of phasic, tonic and total spontaneous contractile amplitude in muscle strips containing either the distal or proximal half of the IAS stretched to L2 length. Tone and peak spontaneous contraction were significantly (*p<0.05, n=9) greater in the distal than in the proximal muscle strip. Shown are mean values ± S.E.M.
To further explore the relationship between basal Ca2+ levels and tone, we evaluated whether there is greater tone in the distal half of the IAS (where basal Ca2+ is greater, Fig. 7B) versus the proximal half (where basal Ca2+ is less, Fig. 7B). The IAS was divided into two 0.5 mm wide strips and spontaneous contractile activity recorded. Importantly, tone was significantly greater (p<0.05) in the distal than in the proximal half of the IAS (Fig. 7C); an observation that is consistent with a relationship between tone and elevated basal Ca2+ levels.
Comparison of CTs in the rectum to those of the IAS.
An additional group of experiments examined CTs in rectum; a muscle with predominantly lower frequency phasic contractions9,11,17. For these experiments the intact muscle configuration shown in Fig. 1D was used. In contrast to the IAS, no specific pacemaker region was identified in rectum. Rather, CTs arose from various sites. In 4 of 11 muscles CTs occurred at irregular positions and intervals (see Fig. 8A,B) whereas in 4 others they occurred in clusters of 3–5 events followed by a period of quiescence (2–4 clusters per minute). Finally, highly regular low frequency CTs (i.e., 29 cpm) encompassing the entire 2 mm width of rectum were noted in one muscle while no CTs occurred in two other muscles. CT frequency was determined in five muscles from the distal IAS to a position 3 mm from the distal extremity. These data (summarized in Fig. 8C) indicate that the proximal decline in CT frequency observed in the IAS (Fig. 2) continues in the rectum (Fig. 8C).
Figure 8. Ca2+ transients in rectum.

(A) Spatiotemporal (ST) map of CTs in rectum (see Fig. 1D for muscle configuration). Distance is plotted on the x-axis (proximal edge on left) and time on the y-axis (zero time at top). (B) Comparison of CTs recorded at the distal extremity of the IAS (upper black trace) versus rectum (lower red trace) in the same muscle segment. CTs in rectum were less regular and less frequent. The rectal trace was obtained from the middle of the rectal ST map. (C) Summary graph plotting the progressive decline in CT frequency in the proximal direction (n=5). Shown are mean values ± S.E.M. (D) Superimposed traces of CTs in the distal IAS (black) and rectum (red) before, during and after EFS (5 Hz, 10 sec, 1 μM atropine). Traces were superimposed based upon the level of Ca2+ present during EFS. Elevated basal Ca2+ is readily apparent during control activity in the distal IAS (see also Figure 6 and 7), but not in rectum. Both recordings exhibit rebound excitation following EFS.
To determine whether basal Ca2+ is also elevated in rectum, EFS (5 Hz, 10 s, 1 μM atropine present, n=5) was again applied. EFS abolished phasic CTs in rectum, but unlike the distal IAS, no change in basal Ca2+ was noted (n=5). Examples of CTs obtained from the same muscle either 0.1 mm (distal IAS) or 2.5 mm (rectum) from the distal extremity are shown superimposed upon one another in Fig. 8D.
Discussion
This study examined CTs in SMCs of the IAS using mice expressing the genetically encoded Ca2+ indicator GCaMP. These mice were generated using Cre-lox methodologies and enabled the recording of Ca2+ activity specifically within SMCs. Examination of Ca2+ activity within IAS SMCs provided a greater understanding of the relationship of phasic activity to tone generation. Our results are compatible with SWs giving rise to CTs and identify the distal IAS as the predominant region from which pacemaker potentials emanate. Evidence is also presented that tone may be due, at least in part, to a partial tetanus type mechanism. Finally, although muscle length had some minor effects upon CTs, our results indicate that stretch is not fundamental for CT generation.
Slow waves, calcium transients and contraction all require CavL activity.
There is general consensus in the GI literature that interstitial cells of Cajal (ICC) are the pacemaker cells responsible for the generation of SWs. The enteric nervous system can also generate rhythmic firings leading to rhythmic electrical events in smooth muscle18 although in small intestine the frequency of these events (2 cpm) is slower than SW frequency (i.e., 20–30 cpm19). Pacemaker ICC (i.e., ICC-MY) in the small intestine have been shown to coordinate smooth muscle electrical and mechanical activity20. However, mutant mice lacking ICC-MY and SWs in this region typically still live a normal murine life span and generate propulsive motor complexes initiated by nerves21. It is possible that increased smooth muscle action potentials compensate for the loss of SWs in these mutant models20,22,23.
SWs conduct from ICC to adjacent SMCs via gap junctions giving rise to phasic contractions24. The IAS also exhibits SWs14 and in preliminary studies of the Kit-GCaMP3 mouse IAS we have obtained evidence that SWs in the IAS are also initiated by ICC25. However, SWs in the IAS differ significantly from intestinal SWs, i.e., while intestinal SWs that are dependent upon T-type Ca2+ channels (CavT) persist in the presence of CavL blockers (e.g.,26–28), IAS SWs are abolished suggesting a fundamental role for CavL in these events within the IAS9,12,13. The importance of CavL to SW generation in the IAS is not surprising since CavL activate at less negative membrane potentials than CavT29,30 and “resting” membrane potential in the IAS is more depolarized than that of other organs that generate pacemaker activity in the GI tract. For example, there is a 5 mV gradient from IAS to distal rectum in mouse11; and a 20 mV gradient from IAS to proximal rectum in dog9. IAS SWs are also abolished by hyperpolarizing tissues with pinacidil14, further supporting an important role for voltage-dependent channels (such as CavL) in these events. Since inhibitors of CavL such as nifedipine and pinacidil also block CTs it provides pharmacological evidence that these are related events, i.e., that SWs give rise to CTs. Inhibitors of CavL also block tone and phasic contractions in the IAS13,31, thus all of the available evidence suggests that electromechanical coupling mechanisms involving CavL play a fundamental role in both phasic and tonic contraction in the IAS.
Pacemaker activity in the IAS is coordinated by the distal extremity.
The frequency and amplitude of SWs is greatest at the distal end of the IAS, decreasing proximally. For example, in mouse, SW frequency declines by ~14% across the width of the IAS (i.e., 1 mm) and by ~34% at 2 mm from the distal extremity. SW amplitude declines even more over this distance (i.e., ~43% at 1 mm and 79% at 2 mm11. These data in combination with similar studies of the dog rectoanal region have led to the proposal that the distal IAS is the region of predominant pacemaker activity9,11,32. The present study indicates that CTs are also greatest in amplitude and frequency at the distal extremity and that CT frequency is in the same range as SW frequency (i.e., 60–80 cpm). Interestingly, CT frequency and amplitude declined in the proximal direction to a greater extent than SWs (i.e., 33% and 70% decrease in CT frequency and amplitude respectively at 1 mm). This is likely because microelectrodes can detect smaller changes in membrane potential that fail to raise cytoplasmic Ca2+ sufficiently for detection with imaging techniques. None-the-less, microelectrode and imaging measurements are in agreement that the distal extremity is the predominant pacemaker region of the IAS providing additional spatiotemporal evidence that SWs give rise to CTs. Pacemaker activity is not dependent upon nerves since it persists in the presence of combined addition of the muscarinic antagonist atropine, the NOS inhibitor L-NNA and the P2Y1 receptor antagonist MRS25008,17.
An interesting outcome of this study was the degree to which CTs arising from the distal extremity set the overall pattern of activity in the muscle. Thus, many CTs conducted at least half way across the IAS (0.5 mm) and some conducted well into the rectum (>1.5 mm proximal). By visualizing the entire muscle sheet, it became apparent that the decline in CT frequency with distance was largely due to CTs falling below detectible levels. However, there were irregularities in the conduction of CTs across the muscle as well. These may have been due to several factors including: 1) the appearance of occasional action potentials12, 2) changes in electrical coupling at the interface between muscle bundles11, and 3) the appearance of CTs from ectopic sites that conducted either distally, proximally or in both directions (see Fig. 3). These irregularities disrupted the otherwise orderly progression of CTs from distal to proximal IAS and may explain why dual microelectrode recordings identified less coordination of SWs with distance11 than observed for CTs in the present study. None-the-less, SW and CT measurements are in agreement, that the frequency and amplitude of phasic events declines proximally.
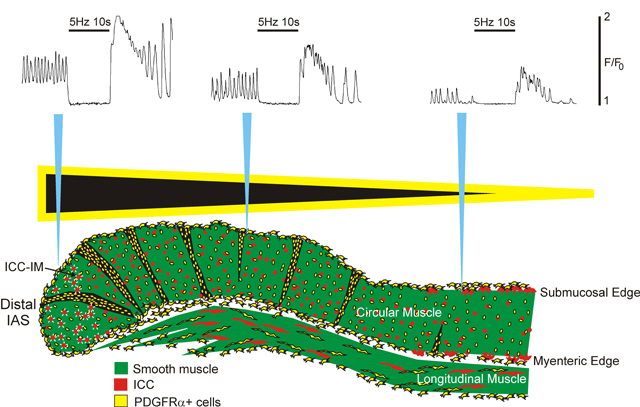
The IAS is composed of small muscle bundles (i.e., “minibundles”) separated from one another by connective tissue septa11,33. Morphological studies have determined that the width of the mouse IAS (i.e., ~1 mm) consists of ~6–8 minibundles running parallel to one another11. Previously we suggested that septal structures likely represented a significant barrier to the conduction of electrical signals between minibundles11. However, the present study revealed that CTs sometimes conduct >1.5 mm; i.e., a distance far beyond the average width of a minibundle indicating that substantial coupling exists between minibundles. This coupling cannot be accounted for by ICC networks at either the myenteric or submucosal surface since the IAS lacks such networks however abundant intramuscular ICC (ICC-IM) are present33,34. On the other hand, PDGFRα+ cell density is quite high in septal structures of the mouse IAS11. PDGFRα+ cells and ICC are known to form gap junctions with SMC35–37. Indeed, SMCs, ICC and PDGFRα+ cells together have been suggested to form a structure referred to as “the SIPs syncytium” that coordinates electrical activity (e.g., pacemaker potentials and nerve induced junction potentials) in the muscularis externa38. We therefore propose that SW generation is mediated by ICC-IM whereas the conduction of electrical signals from distal to proximal IAS is achieved with the aid of septal PDGFRα+ cells coupled to cells of the SIP syncytium within minibundles.
Previously we and others have shown that isolated segments of the proximal IAS can generate SWs at lower frequencies suggesting that pacemaker cells are not confined to the distal extremity9,32. The present study supports this conclusion since CTs occurring at a reduced frequency persisted following removal of the distal 300 μm of the IAS. Thus, both SW and CT measurements support a gradient in pacemaker cell frequency across the IAS.
The pacemaker gradient described here is similar to the heart where the fastest pacemaker is located at the sinoatrial node and controls heart rate. However, in the IAS, locating the fastest pacemaker at the distal extremity may instead support its role in maintaining fecal continence. Specifically, sequential activation of muscle in the GI tract moves luminal contents in the direction of contraction. Thus, directing contractions in the proximal direction within the IAS will aid in retaining feces whereas directing contractions distally will have the opposite effect.
Relationship of pacemaker activity to contraction and a partial tetanus-type mechanism.
SWs, CTs and tone are all highly sensitive to blockade of CavL in the IAS underscoring the importance of this Ca2+ entry pathway for tone generation. This study examined whether the relationship between Ca2+ entry and tone may be due in part to a partial tetanus-type mechanism. The time constant derived for Ca2+ removal (i.e., 0.46 sec) is too slow to reduce cytoplasmic Ca2+ to sub-contractile levels before the arrival of the next CT because their frequency is so high (i.e., ~70 cpm). Consequentially basal Ca2+ levels remains elevated throughout spontaneous contractile activity. Indeed, at the distal end of the IAS basal Ca2+ amplitude was found to be approximately equivalent to phasic CT amplitude (Fig. 6). These data are compatible with a partial tetanus-type mechanism in which cytoplasmic Ca2+ remains elevated due to the inability of cells to clear or sequester Ca2+ between rapid frequency voltage-dependent Ca2+ entry events (i.e. SWs). Further evidence in support for a partial tetanus-type mechanism is that tone, CT frequency and the extent of basal Ca2+ elevation all decline in the proximal direction.
Several different mechanisms potentially contribute to tone development in the IAS including CavL-dependent (e.g., partial tetanus, window current, asynchronous muscle bundle summation) and CavL-independent ones (e.g., myofilament sensitivity)14. The relevance of each mechanism is also likely to differ between species. Since SW frequency in the mouse IAS is high (i.e., ~70 cpm11) partial tetanus may play a more significant role in this species than in others such as dog and monkey where SW frequency is less than half this value (i.e., 20–30 cpm14). Attaining more definitive evidence supporting a partial tetanus-type mechanism in mouse will require additional studies evaluating the time course of the various Ca2+ handling mechanisms underlying contraction.
Relevance of studying the SM-GCaMP mouse IAS.
Although SW frequencies differ between species, the mouse, dog and monkey IAS share a number of common features. These include the essential role for CavL in generation of SWs and tone as well as the importance of the distal extremity in generating the largest, fastest pacemaker potentials. Further commonality between these species is the presence of abundant ICC-IM within each muscle bundle of the IAS while ICC-MY and ICC-SM networks decline aborally and are lacking at the distal end14. For this reason, ICC-IM are the most likely candidate for SW generation in all three species. Indeed, in the dog and monkey IAS, ICC-IM assume a highly branched morphology that is typical for pacemaker-type ICC33,39. Because of these similarities, using the SM-GCaMP mouse to attain insights into the spatiotemporal properties of CT has general relevance for our understanding of how pacemaker activity is organized in the IAS.
Relationship of muscle length to pacemaker activity.
The degree of active force generated by a muscle, including smooth muscle, has long been known to depend upon muscle length and myofilament overlap40. Optimum length (Lo) produces maximum active force. Since little information is available regarding the length/force relationship of the IAS we established this relationship for the mouse IAS as well as estimating in vivo length. In vivo length was significantly less than Lo but still capable of generating 66% maximum spontaneous and KCl-induced contraction. For Ca2+ imaging experiments, two lengths were selected from this relationship to evaluate the effects of muscle length on the spatiotemporal properties of CT. The first length (L1) was slightly less than in vivo length and the other (i.e., L2) was at Lo. CT frequency as well as the decline in frequency and amplitude with distance were not significantly different in muscles set at L1 vs L2 whereas there was a small increase in CT conduction velocity. This latter observation suggests that some aspects of muscle excitability are stretch-sensitive. This is not surprising since CavL is known to have stretch sensitivity in some smooth muscles41,42. However, the lack of effect of stretch on CT frequency indicates that the pacemaker mechanism per se is relatively insensitive to stretch. Thus, the IAS is well suited to perform its primary function which is to generally remain contracted, even with little or no distending force, until defecation is initiated.
In summary, this study has shown that the pharmacological and spatiotemporal properties of CTs in the IAS are very similar to those of SWs suggesting that SWs give rise to CTs. Phasic activity is highly coordinated by the distal extremity and tone may be due, at least in part, to a partial tetanus-type mechanism. Locating the fastest pacemaker at the distal extremity will lead to orally directed contractions that will aid in maintaining fecal continence. The ability of this muscle to spontaneously contract well below optimal length appears to be well suited to its physiologic role, i.e., to remain closed the majority of the time thereby aiding in the maintenance of fecal continence.
Acknowledgements:
The authors would like to express their gratitude to Dr. Kenton M. Sanders for the provision of SM-GCaMP mice, Nancy Horowitz for breeding, maintaining and injecting SM-GCaMP mice, Lauren O’Kane for genotyping of mice, Robert Corrigan for assistance with Ca2+ imaging studies and Dr. Grant W. Hennig, University of Vermont for assistance with Volumetry Software.
Funding: This work was funded by NIDDK RO1 grant #078736 to KDK and CAC.
Footnotes
Disclosures: The authors have nothing to disclose.
This work was previously presented in abstract form at the Federation of Neurogastroenterology and Motility Meeting 2018.43
References
- 1.Bharucha A. Anorectal disorders In: Spiller R, Grundy D, eds. Pathophysiology of the enteric nervous system: A basis for understanding functional diseases.: Wiley Blackwell Publishing; 2004:161–175. [Google Scholar]
- 2.Rao SS, Meduri K. What is necessary to diagnose constipation? Best Pract Res Clin Gastroenterol. 2011;25(1):127–140. [DOI] [PMC free article] [PubMed] [Google Scholar]
- 3.Bharucha AE. Pelvic floor: anatomy and function. Neurogastroenterol Motil. 2006;18(7):507–519. [DOI] [PubMed] [Google Scholar]
- 4.Opazo A, Aguirre E, Saldana E, Fantova MJ, Clave P. Patterns of impaired internal anal sphincter activity in patients with anal fissure. Colorectal Dis. 2013;15(4):492–499. [DOI] [PubMed] [Google Scholar]
- 5.Whitehead WE. Fecal incontinence: a neglected area of gastroenterology. Gastroenterology. 2002;122(1):5. [DOI] [PubMed] [Google Scholar]
- 6.Patel CA, Rattan S. Cellular regulation of basal tone in internal anal sphincter smooth muscle by RhoA/ROCK. Am J Physiol Gastrointest Liver Physiol. 2007;292(6):G1747–G1756. [DOI] [PubMed] [Google Scholar]
- 7.Rattan S, Singh J. RhoA/ROCK pathway is the major molecular determinant of basal tone in intact human internal anal sphincter. Am J Physiol Gastrointest Liver Physiol. 2012;302(7):G664–G675. [DOI] [PMC free article] [PubMed] [Google Scholar]
- 8.Duffy AM, Cobine CA, Keef KD. Changes in neuromuscular transmission in the W/W(v) mouse internal anal sphincter. Neurogastroenterol Motil. 2012;24(1):e41–e55. [DOI] [PMC free article] [PubMed] [Google Scholar]
- 9.Mutafova-Yambolieva VN, O’Driscoll K, Farrelly A, Ward SM, Keef KD. Spatial localization and properties of pacemaker potentials in the canine rectoanal region. Am J Physiol Gastrointest Liver Physiol. 2003;284(5):G748–G755. [DOI] [PubMed] [Google Scholar]
- 10.Harvey N, McDonnell B, McKechnie M, Keef K. Role of L-type calcium channels, membrane potential and nitric oxide in the control of myogenic activity in the primate internal anal sphincter. Gastroenterology. 2008;134(4):A63. [Google Scholar]
- 11.Hall KA, Ward SM, Cobine CA, Keef KD. Spatial organization and coordination of slow waves in the mouse anorectum. J Physiol. 2014;592(Pt 17):3813–3829. [DOI] [PMC free article] [PubMed] [Google Scholar]
- 12.McDonnell B, Hamilton R, Fong M, Ward SM, Keef KD. Functional evidence for purinergic inhibitory neuromuscular transmission in the mouse internal anal sphincter. Am J Physiol Gastrointest Liver Physiol. 2008;294(4):G1041–G1051. [DOI] [PubMed] [Google Scholar]
- 13.Cobine CA, Hannah EE, Zhu MH, et al. ANO1 in intramuscular interstitial cells of Cajal plays a key role in the generation of slow waves and tone in the internal anal sphincter. J Physiol. 2017;595(6):2021–2041. [DOI] [PMC free article] [PubMed] [Google Scholar]
- 14.Keef KD, Cobine CA. Control of Motility in the Internal Anal Sphincter. Journal of neurogastroenterology and motility. 2019;25(2):189–204. [DOI] [PMC free article] [PubMed] [Google Scholar]
- 15.Watras J. Skeletal Muscle Physiology In: Berne R, Levy M, Koeppen B, Stanton B, eds. Physiology. 5 ed.: Mosby; 2005:223–245. [Google Scholar]
- 16.Baker SA, Drumm BT, Saur D, Hennig GW, Ward SM, Sanders KM. Spontaneous Ca(2+) transients in interstitial cells of Cajal located within the deep muscular plexus of the murine small intestine. J Physiol. 2016;594(12):3317–3338. [DOI] [PMC free article] [PubMed] [Google Scholar]
- 17.Cobine CA, McKechnie M, Brookfield RJ, Hannigan KI, Keef KD. Comparison of inhibitory neuromuscular transmission in the Cynomolgus monkey IAS and rectum: special emphasis on differences in purinergic transmission. J Physiol. 2018;596(22):5319–5341. [DOI] [PMC free article] [PubMed] [Google Scholar]
- 18.Spencer NJ, Hibberd TJ, Travis L, et al. Identification of a Rhythmic Firing Pattern in the Enteric Nervous System That Generates Rhythmic Electrical Activity in Smooth Muscle. J Neurosci. 2018;38(24):5507–5522. [DOI] [PMC free article] [PubMed] [Google Scholar]
- 19.Kito Y, Suzuki H. Properties of pacemaker potentials recorded from myenteric interstitial cells of Cajal distributed in the mouse small intestine. J Physiol. 2003;553(Pt 3):803–818. [DOI] [PMC free article] [PubMed] [Google Scholar]
- 20.Hennig GW, Spencer NJ, Jokela-Willis S, et al. ICC-MY coordinate smooth muscle electrical and mechanical activity in the murine small intestine. Neurogastroenterol Motil. 2010;22(5):e138–151. [DOI] [PMC free article] [PubMed] [Google Scholar]
- 21.Spencer NJ, Sanders KM, Smith TK. Migrating motor complexes do not require electrical slow waves in the mouse small intestine. J Physiol. 2003;553(Pt 3):881–893. [DOI] [PMC free article] [PubMed] [Google Scholar]
- 22.Malysz J, Thuneberg L, Mikkelsen HB, Huizinga JD. Action potential generation in the small intestine of W mutant mice that lack interstitial cells of Cajal. Am J Physiol. 1996;271(3 Pt 1):G387–G399. [DOI] [PubMed] [Google Scholar]
- 23.Ward SM, Burns AJ, Torihashi S, Harney SC, Sanders KM. Impaired development of interstitial cells and intestinal electrical rhythmicity in steel mutants. Am J Physiol. 1995;269:C1577–C1585. [DOI] [PubMed] [Google Scholar]
- 24.Sanders KM, Kito Y, Hwang SJ, Ward SM. Regulation of Gastrointestinal Smooth Muscle Function by Interstitial Cells. Physiology (Bethesda). 2016;31(5):316–326. [DOI] [PMC free article] [PubMed] [Google Scholar]
- 25.Keef K, Ward S, Cobine C. Evidence supporting a pivotal role for intramuscular interstitial cells of Cajal in the generation of pacemaker activity, phasic contractions and tone in the internal anal sphincter. Translational Andrology and Urology. 2016;5 (Sup 2):S346–S346. [Google Scholar]
- 26.Ward SM, Sanders KM. Upstroke component of electrical slow waves in canine colonic smooth muscle due to nifedipine-resistant calcium current. J Physiol (Lond). 1992;455:321–337. [DOI] [PMC free article] [PubMed] [Google Scholar]
- 27.Kito Y, Mitsui R, Ward SM, Sanders KM. Characterization of slow waves generated by myenteric interstitial cells of Cajal of the rabbit small intestine. Am J Physiol Gastrointest Liver Physiol. 2015;308(5):G378–G388. [DOI] [PMC free article] [PubMed] [Google Scholar]
- 28.Gibbons SJ, Strege PR, Lei S, et al. The alpha1H Ca2+ channel subunit is expressed in mouse jejunal interstitial cells of Cajal and myocytes. J Cell Mol Med. 2009;13(11–12):4422–4431. [DOI] [PMC free article] [PubMed] [Google Scholar]
- 29.Kito Y, Ward SM, Sanders KM. Pacemaker potentials generated by interstitial cells of Cajal in the murine intestine. Am J Physiol Cell Physiol. 2005;288(3):C710–C720. [DOI] [PubMed] [Google Scholar]
- 30.Catterall WA. Voltage-gated calcium channels. Cold Spring Harb Perspect Biol. 2011;3(8):a003947. [DOI] [PMC free article] [PubMed] [Google Scholar]
- 31.Cobine CA, Fong M, Hamilton R, Keef KD. Species dependent differences in the actions of sympathetic nerves and noradrenaline in the internal anal sphincter. Neurogastroenterol Motil. 2007;19(11):937–945. [DOI] [PubMed] [Google Scholar]
- 32.Kubota M, Suita S, Szurszewski JH. Membrane properties and the neuro-effector transmission of smooth muscle cells in the canine internal anal sphincter. J Smooth Muscle Res. 1998;34(4):173–184. [DOI] [PubMed] [Google Scholar]
- 33.Cobine CA, Hennig GW, Bayguinov YR, Hatton WJ, Ward SM, Keef KD. Interstitial cells of Cajal in the cynomolgus monkey rectoanal region and their relationship to sympathetic and nitrergic nerves. Am J Physiol Gastrointest Liver Physiol. 2010;298(5):G643–G656. [DOI] [PMC free article] [PubMed] [Google Scholar]
- 34.Cobine CA, Hennig GW, Kurahashi M, Sanders KM, Ward SM, Keef KD. Relationship between interstitial cells of Cajal, fibroblast-like cells and inhibitory motor nerves in the internal anal sphincter. Cell Tissue Res. 2011;344(1):17–30. [DOI] [PMC free article] [PubMed] [Google Scholar]
- 35.Horiguchi K, Komuro T. Ultrastructural observations of fibroblast-like cells forming gap junctions in the W/W(nu) mouse small intestine. J Auton Nerv Syst. 2000;80(3):142–147. [DOI] [PubMed] [Google Scholar]
- 36.Komuro T, Seki K, Horiguchi K. Ultrastructural characterization of the interstitial cells of Cajal. Arch Histol Cytol. 1999;62(4):295–316. [DOI] [PubMed] [Google Scholar]
- 37.Fujita A, Takeuchi T, Jun H, Hata F. Localization of Ca2+-activated K+ channel, SK3, in fibroblast-like cells forming gap junctions with smooth muscle cells in the mouse small intestine. J Pharmacol Sci. 2003;92(1):35–42. [DOI] [PubMed] [Google Scholar]
- 38.Sanders KM, Ward SM, Koh SD. Interstitial cells: regulators of smooth muscle function. Physiol Rev. 2014;94(3):859–907. [DOI] [PMC free article] [PubMed] [Google Scholar]
- 39.Horiguchi K, Keef KD, Ward SM. Distribution of interstitial cells of Cajal in tunica muscularis of the canine rectoanal region. Am J Physiol Gastrointest Liver Physiol. 2003;284(5):G756–G767. [DOI] [PubMed] [Google Scholar]
- 40.Cooke PH, Fay FS. Correlation between fiber length, ultrastructure, and the length-tension relationship of mammalian smooth muscle. J Cell Biology. 1972;52:105–116. [DOI] [PMC free article] [PubMed] [Google Scholar]
- 41.Langton PD. Calcium channel currents recorded from isolated myocytes of rat basilar artery are stretch sensitive. J Physiol. 1993;471:1–11. [DOI] [PMC free article] [PubMed] [Google Scholar]
- 42.Farrugia G, Holm AN, Rich A, Sarr MG, Szurszewski JH, Rae JL. A mechanosensitive calcium channel in human intestinal smooth muscle cells. Gastroenterology. 1999;117(4):900–905. [DOI] [PubMed] [Google Scholar]
- 43.Cobine CA, Hannigan KI, McMahon M, Ni Bhraonain EP, Keef KD. Phasic activity and tone in the internal anal sphincter: Role of calcium entry and stretch. Neurogastroenterology and Motility. 2018;30 Suppl 1, e13423, 25. [Google Scholar]