Abstract
Inflammatory bowel diseases (IBD) are associated with alterations in gut microbial abundances and lumenal metabolite concentrations, but the effects of specific metabolites on the gut microbiota in health and disease remain largely unknown. Here, we analyzed the influences of metabolites that are differentially abundant in IBD on the growth and physiology of gut bacteria that are also differentially abundant in IBD. We found that N-acylethanolamines (NAEs), a class of endogenously-produced signaling lipids elevated in the stool of IBD patients and a T-cell transfer model of colitis, stimulated growth of species overrepresented in IBD and inhibited that of species depleted in IBD in vitro. Using metagenomic sequencing, we recapitulated the effects of NAEs in complex microbial communities ex vivo, with Proteobacteria blooming and Bacteroidetes declining in the presence of NAEs. Metatranscriptomic analysis of the same communities identified components of the respiratory chain as important for the metabolism of NAEs, and this was verified using a mutant deficient for respiratory complex I. In this study, we identified NAEs as a class of metabolites that are elevated in IBD and have the potential to shift gut microbiota toward an IBD-like composition.
Inflammatory bowel diseases (IBD), including ulcerative colitis (UC) and Crohn’s disease (CD), are conditions of chronic gastrointestinal inflammation resulting from genetic predisposition and perturbed interactions between gut microbes and host immunity1,2. Many studies focus on microbial taxonomic and functional changes during IBD3–5; however, the gut metabolome (comprising diet-, host- and microbe-derived metabolites) is an equally important contributor to intestinal health6–8.
Certain gut bacteria metabolize dietary fiber into short-chain fatty acids such as butyrate that nourish colonocytes, promote regulatory T-cell expansion, and have immunosuppressive functions9,10. Butyrate concentration and butyrate-producing bacteria are depleted in the IBD gut11,12. Other bacteria (e.g., Lactobacillus spp., Bacteroides spp., Clostridium sporogenes,) convert tryptophan into indole derivatives that promote healthy intestinal barrier function and immune tolerance13. Indole producers are also depleted in IBD8,12. Urease activity, predominantly contributed by Proteobacteria, shifts the microbiome toward the imbalanced state seen in IBD and worsens disease in a murine colitis model14. Host-derived metabolites likewise affect microbiota composition: bile acids, enriched in the IBD gut8, promote growth of bile acid-metabolizing bacteria and inhibit growth of bile-sensitive bacteria15.
Inferring covariations between metabolites and bacteria that are differentially abundant in IBD can functionally implicate gut metabolites and microbes in intestinal health7,16. Two recent studies combined microbial metagenomics and untargeted mass spectrometry of metabolites to identify associations between stool bacterial species and metabolites8,12. The first was a cross-sectional study of UC, CD and non-IBD subjects within the PRISM (Prospective Registry in IBD Study at MGH) cohort, and the second was the longitudinal integrative Human Microbiome Project (iHMP). Both concluded that microbial taxonomic changes associated with IBD, such as blooms of facultative anaerobes including Proteobacteria4,5, are accompanied by significant shifts in metabolite composition.
Here, we investigated the effects of intestinal metabolites that are differentially abundant in IBD on the growth of gut bacteria that are also differentially abundant in IBD, finding that metabolites including amines and fatty acids strongly affect bacterial growth. Linoleoyl ethanolamide (LEA), an N-acylethanolamine (NAE), impacted growth in ways that reflect altered bacterial abundances in the IBD microbiome. We show that LEA and three structurally-related NAEs—palmitoylethanolamide (PEA), oleoyl ethanolamide (OEA), and arachidonoyl ethanolamide (AEA)—are enriched in stool from IBD patients and a T-cell transfer model of colitis. These NAEs share common receptors and are part of the endocannabinoid system, although only AEA is considered a true endocannabinoid as it binds cannabinoid receptors CB1 and CB217. We treated monocultures of bacteria that shift in IBD with these NAEs, demonstrating that NAEs promote the growth of species overabundant in IBD and restrict the growth of those depleted in IBD. Metagenomic sequencing of complex bacterial communities derived from healthy subjects and treated with NAEs showed taxonomic shifts that mimicked altered abundances observed in IBD patients. Metatranscriptomic analysis of these communities revealed increased expression of respiratory electron transport chain components in Enterobacteriaceae in response to NAEs. These ex vivo results implicate an upregulated host endocannabinoid system in the alteration of microbial communities associated with IBD.
Results
Gut metabolites affect growth of gut bacteria
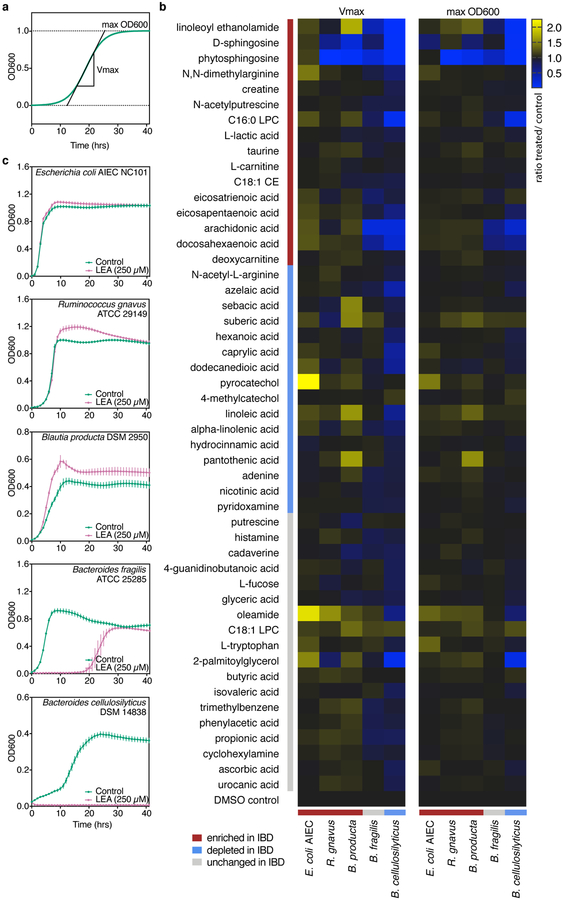
Previous metabolic profiling of stool from subjects in the PRISM cohort identified 3,829 features with assigned molecular functions, of which 466 (representing 346 unique compounds) were validated using reference standards8. From these validated metabolites, we selected 50 spanning 19 molecular classes in the Human Metabolome Database (Supplementary Dataset 1). Thirty-two were differentially abundant between IBD and non-IBD stool (i.e., the IBD phenotype coefficient from a log-transformed linear model with Benjamini-Hochberg FDR q<0.05; Supplementary Dataset 2). We quantified their effects on exponential (Vmax) and stationary (max OD600) bacterial growth using a microtiter plate screen (Fig. 1a; Supplementary Dataset 3). Each metabolite was tested at a single concentration (Supplementary Table 1) on five gut bacteria: Escherichia coli, Ruminococcus gnavus, Blautia producta, Bacteroides fragilis and Bacteroides cellulosilyticus. In the PRISM cohort, E. coli, R. gnavus and B. producta were more abundant in IBD (FDR q<0.1) while B. cellulosilyticus was depleted (FDR q=0.11)8. While not differentially abundant in the PRISM cohort, we included B. fragilis due to its well-characterized interactions with host immunity18 and depletions of Bacteroides species observed in other IBD cohorts4,12,19. Many metabolites (>50% of those tested) promoted the growth of E. coli, R. gnavus, and B. producta, whereas only D-sphingosine and phytosphingosine inhibited their growth (Fig. 1b). In contrast, B. cellulosilyticus growth was enhanced by few (18%) of the metabolites tested while its growth was inhibited by >50%, most of which are elevated in IBD.
Figure 1. Effects of stool metabolites on bacterial growth in exponential (Vmax) and stationary (max OD600) phases.
(a) Schematic of a sigmoid growth curve showing determination of log phase growth rate (Vmax) and stationary phase maximum cell density (max OD600) from growth curves summarized in (b) and presented in (c). (b) Triplicate cultures (technical replicates) of bacteria were grown in rich medium supplemented with a single metabolite (Supplementary Table 1). Mean optical densities were normalized to uninoculated wells containing medium and metabolite, and Vmax and max OD600 were determined for all metabolite- and DMSO-treated growth curves. Metabolite effects were quantified as a ratio of treatment to controls (0.25% DMSO) for Vmax and max OD600 (Supplementary Dataset 3). Metabolites are listed according to abundance trends in the PRISM cohort: blue bars indicate metabolites and bacteria that were significantly depleted in IBD (FDR q< 0.05 and ≤0.1, respectively), red bars indicate those significantly enriched in IBD, and grey bars show metabolites and bacteria that did not significantly vary in IBD8. (c) Growth curves corresponding to the mean of linoleoyl ethanolamide (LEA)-treated triplicate cultures shown in (b) and their respective DMSO controls (n=54). Error bars represent the standard deviation of the mean.
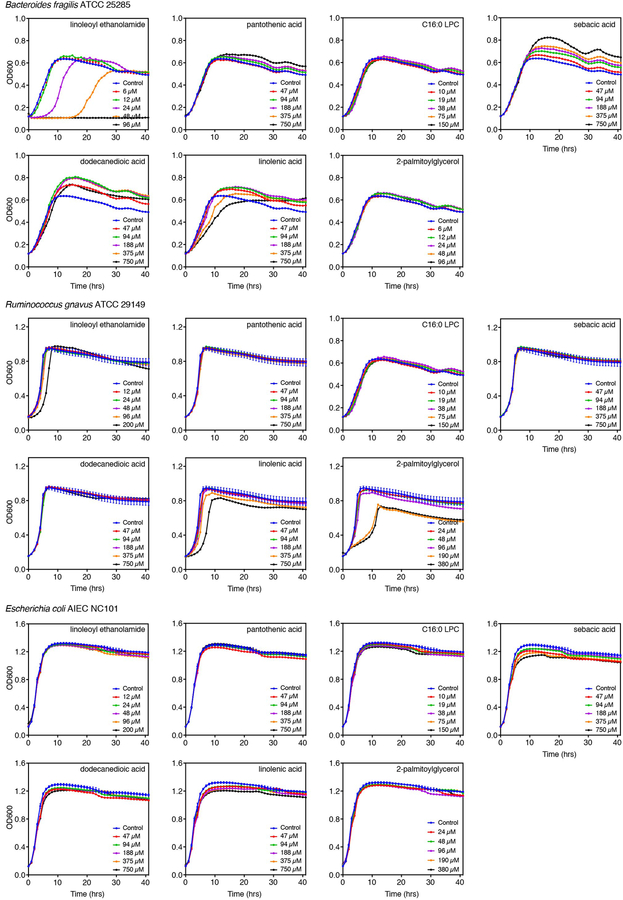
To validate the single-dose growth effects, seven metabolites that inhibited or enhanced growth of at least one species were tested in multiple doses on three strains (Extended Data 1). Metabolites represented a variety of molecular subclasses: amines (LEA), glycerophosphocholines (C16:0 LPC), polyols (pantothenic acid), fatty acids (sebacic and dodecanedioic acids), glycerolipids (2-palmitoylglycerol) and linoleic acyls (linolenic acid). Multiple-dose assays confirmed that LEA inhibits B. fragilis growth and does not affect E. coli growth, while R. gnavus was only delayed in its lag phase by the highest LEA concentration. Growth effects of pantothenic acid and C16:0 LPC were recapitulated at multiple doses. B. fragilis growth was unaffected by sebacic and dodecanedioic acids at single doses but strongly enhanced in the multiple-dose assay. E. coli growth was moderately inhibited by sebacic and dodecanedioic acids, although no effects were observed in the single-dose assay. No significant effects were observed with these two metabolites on R. gnavus growth, similar to the single-dose assay. At higher doses, linolenic acid delayed exponential growth of B. fragilis, R. gnavus and E. coli while enhancing B. fragilis stationary phase growth. Finally, single-dose growth effects of 2-palmitoylglycerol were captured on B. fragilis but not on R. gnavus nor E. coli in the multiple-dose assay. These results highlight the importance of testing a dose range of metabolites on bacterial growth to assess the full extent of metabolite effects.
N-acylethanolamines are enriched in stool from IBD patients and a murine colitis model
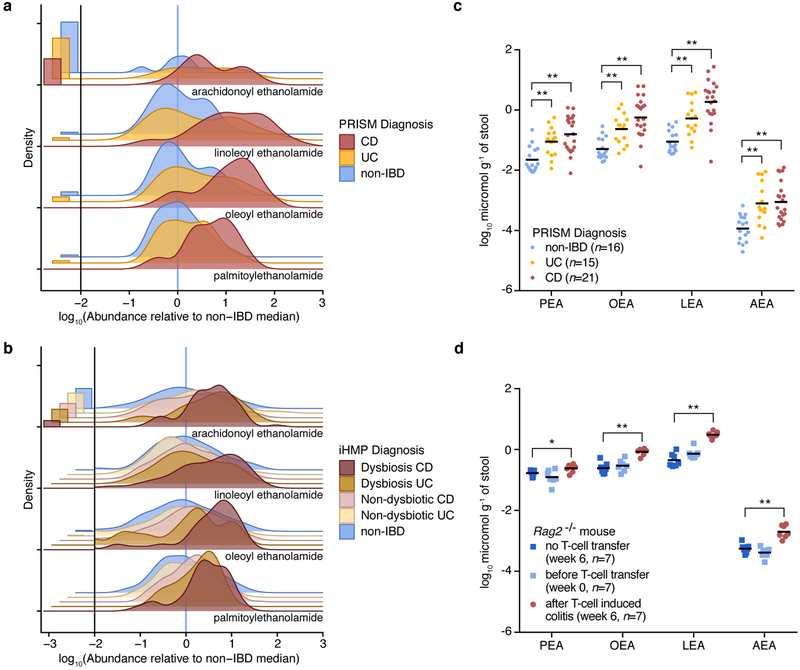
LEA, an NAE enriched in IBD, inhibited the growth of B. cellulosilyticus and enhanced that of E. coli, R. gnavus and B. producta (Fig. 1b,c) in agreement with altered abundances of these taxa in IBD. Reasoning that structurally-related metabolites may have similar effects, we searched the untargeted metabolomics dataset of the PRISM cohort for known NAEs. We identified metabolite features that were enriched in IBD patients corresponding to three additional NAEs: PEA, OEA and AEA (Fig. 2a; Supplementary Dataset 2). We confirmed the presence of AEA in PRISM subject stool using the same LC-MS methods that previously validated the presence of PEA, OEA and LEA8. While PEA, OEA and LEA were enriched in CD samples only (FDR q<0.05), AEA was overabundant in both CD and UC. We verified NAE abundances in the independent IBD cohort from the iHMP12 (Fig. 2b; Supplementary Dataset 2). NAE levels were highest in samples with extreme taxonomic differences (active CD/UC) compared to non-IBD samples, supporting a connection between NAEs and altered microbiome composition in IBD.
Figure 2. N-acylethanolamines are elevated in IBD patients and a mouse model of colitis.
(a, b) Ridgeline plots showing the distribution of log10-transformed NAE abundances (zeros shown separately on the left) relative to the non-IBD median in stool samples from the PRISM (a; n=155) and iHMP (b; n=132) cohorts. The vertical blue lines represent the median of non-IBD samples under the x-axis transformation. Metabolites were detected in stool from PRISM and iHMP subjects as described in Franzosa, et al.8 and Lloyd-Price, et al.12, respectively. (c) Concentrations of NAEs (log10 micromol g−1 of stool) in a random selection of stool samples analyzed in (a). Mean concentrations in each condition are indicated with horizontal bars. (d) Concentrations of NAEs (log10 micromol g−1 of stool) in the stool from Rag2−/− mice, before (n=7) and after (n=7) developing colitis. A set of Rag2−/− mice that did not receive a T-cell transfer (n=7) was used as control. Mean concentrations in each condition are indicated with horizontal bars. Abbreviations: CD, Crohn’s disease; UC, ulcerative colitis; PEA, palmitoylethanolamide; OEA, oleoyl ethanolamide; LEA, linoleoyl ethanolamide; AEA, arachidonoyl ethanolamide. Two-tailed Wilcoxon rank-sum test, *p<0.05 and **p<0.005.
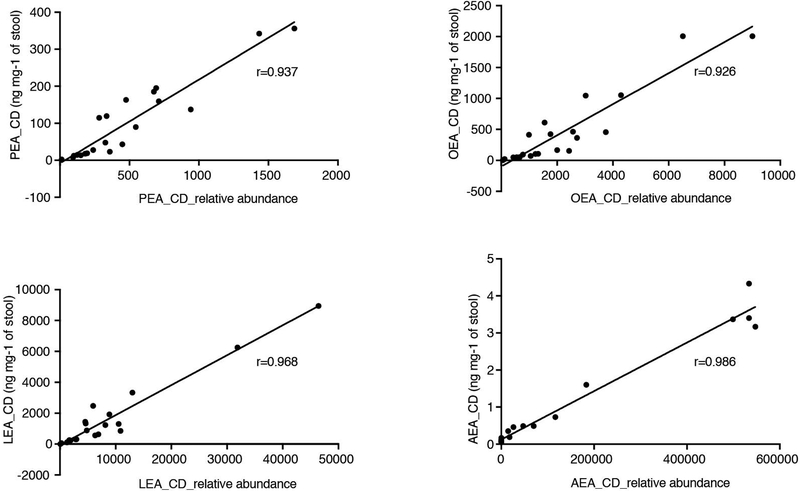
Because the LC-MS methods used do not yield absolute concentrations, we further confirmed elevated NAEs in stool from IBD patients by quantifying NAEs in a subset of samples from the PRISM cohort (Fig. 2c). Average AEA, PEA, OEA and LEA amounts were present in the ng mg−1 range (0.89–1503 ng mg−1 in CD samples). Absolute NAE concentrations highly correlated with relative abundances in the same samples (Extended Data 2), demonstrating the quantitative quality of the metabolomic methods for detection of these metabolites.
To investigate whether NAEs are elevated during inflammation in a relevant animal model, we measured NAE concentrations in stool collected from Rag2−/− mice before and after induction of colitis. Transferring naïve T cells from wild-type donor mice to Rag2−/− mice, which are unable to generate mature B and T lymphocytes, induces colitis20. We reared Rag2−/− mice in specific pathogen-free (SPF) conditions and collected stool at week 0, prior to the transfer of naïve T cells obtained from SPF-colonized wild-type mice. After six weeks, colitis developed in Rag2−/− mice that received T-cell transfers but not in Rag2−/− mice that did not receive T-cell transfers. An increase in all four NAEs, at concentrations similar to those found in patients, was detected in stool collected six weeks after T-cell transfer relative to stool from the same mice prior to T-cell transfer (week 0) and Rag2−/− mice that did not receive T-cell transfers (week 6; Fig. 2d). We additionally performed metagenomic sequencing of DNA from these samples to identify bacterial taxa associated with NAE abundance. Of the species overlapping with those found in PRISM samples, we observed the same abundance trends in mice with colitis. Akkermansia, Alistipes and Eubacterium species decreased while Enterococcus species increased in relative abundance after T-cell transfer (Supplementary Dataset 4). Thus, both increased NAE abundance and corresponding bacterial community shifts are characteristic features of colitis in mice and humans.
N-acylethanolamines enhance growth of species enriched in IBD and inhibit growth of species depleted in IBD
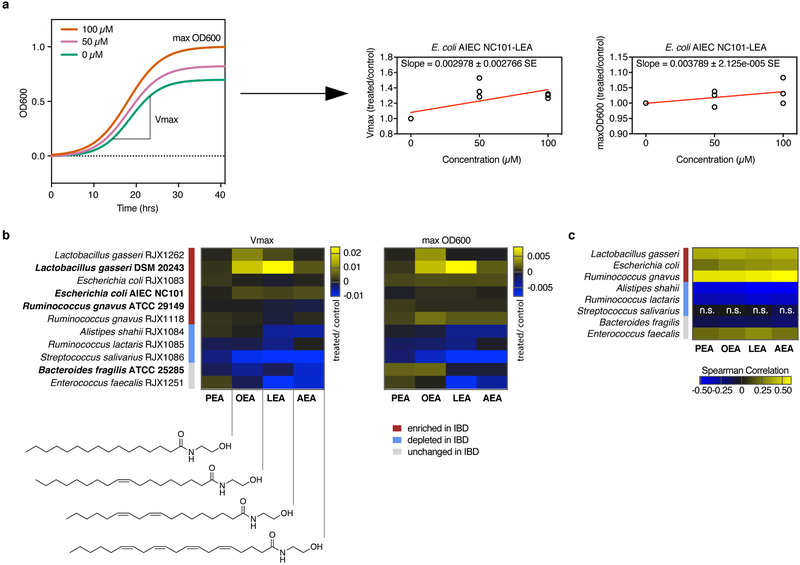
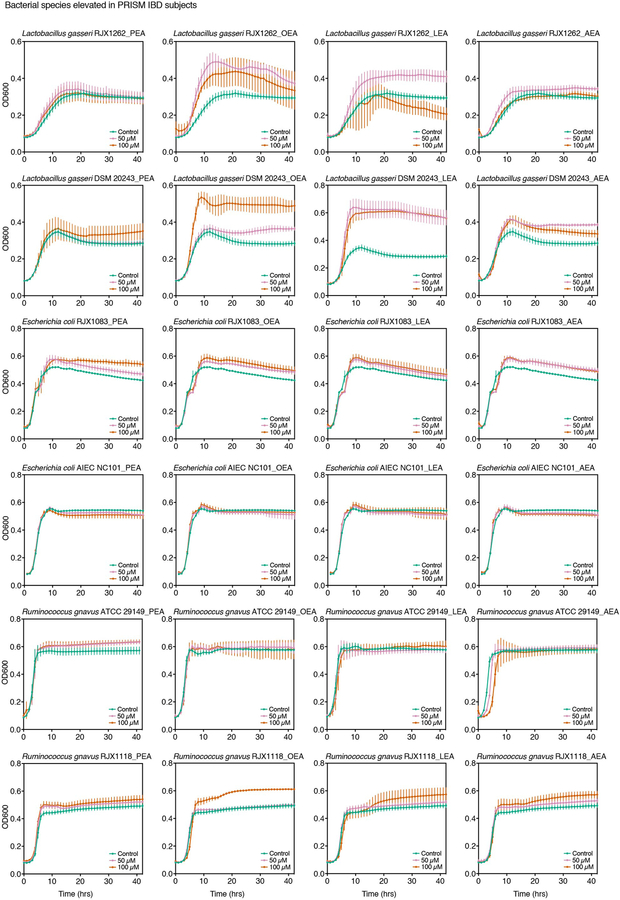
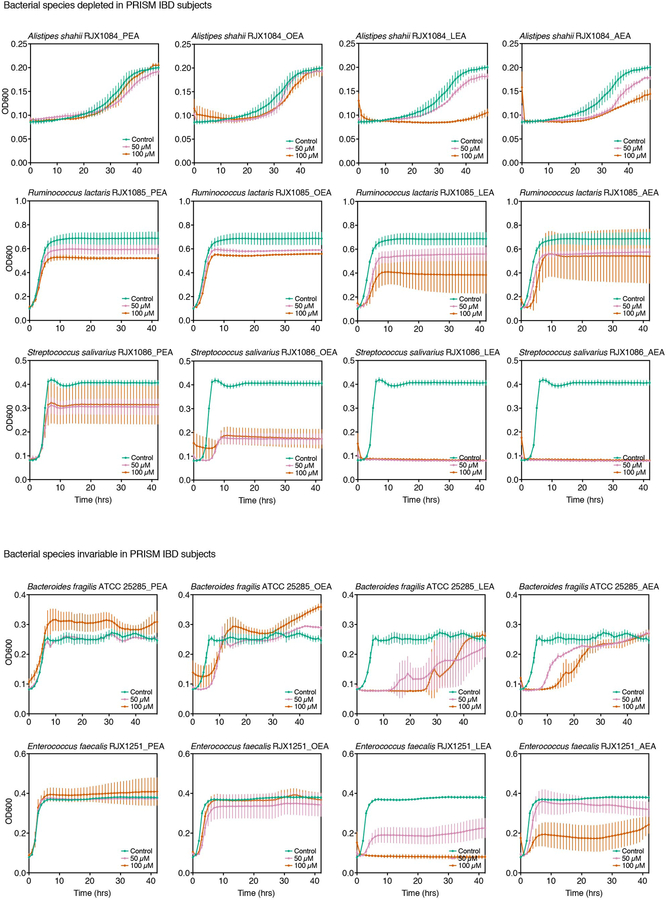
To assess growth effects on differentially abundant PRISM species, we tested the four NAEs at two doses on eleven strains: three reference strains used in our initial screen; one reference strain of a species enriched in IBD patients, Lactobacillus gasseri; and seven strains isolated from human stool corresponding to three enriched, three depleted and one invariable species in IBD (Extended Data 3, 4; Supplementary Table 2). Vmax and max OD600 were deduced from dose growth curves and plotted as a function of NAE concentration to determine growth effects (Fig. 3a,b; Supplementary Dataset 5). No strain-specific effects were observed with L. gasseri, E. coli and R. gnavus, as strains of the same species responded similarly to NAE treatment. Growth of all IBD-elevated species tested enhanced upon NAE treatment, while growth of IBD-depleted species was inhibited. Growth enhancements were strongest with the addition of OEA and LEA, while inhibitory effects were strongest with LEA and AEA. PEA had minimal impact on growth.
Figure 3. Effects of N-acylethanolamines on bacterial growth.
NAEs were added to bacterial cultures in three concentrations (0 μM, 50 μM and 100 μM), and growth was monitored over time (Extended Data 3, 4). (a) Schematic of NAE-mediated growth enhancement (left graph). Growth rates (Vmax, middle graph) and maximum cell density (max OD600, right graph) were normalized against controls (0.4% DMSO) at each NAE concentration in triplicate and plotted as a function of concentration (Supplementary Dataset 5). The slopes of the regression lines drawn in (a), shown here for E. coli AIEC NC101 with LEA, were used to generate heatmaps in (b) (Supplementary Dataset 5). (b) Strains are reference strains (shown in bold) or isolates from human stool (Supplementary Table 2). Bars indicate strains enriched (red), depleted (blue) or unchanged (grey) in PRISM IBD patients. The structure of each NAE is shown below the left heatmap. B. fragilis and E. faecalis did not follow a significant trend in disease. Results are representative of two independent experiments and are presented as the mean of triplicate assessments. (c) Rank (Spearman) correlations between species relative abundances and NAEs from the PRISM stool metabolomics and metagenomics dataset (n=155 samples; with the exception of associations between S. salivarius and the four NAEs, all FDR q<0.1 based on two-tailed nominal p-values; Supplementary Dataset 5). Abundances were first residualized with linear models of subject covariates8 to limit correlation driven by mutual association with other factors (e.g. IBD phenotype). Abbreviations: PEA, palmitoylethanolamide; OEA, oleoyl ethanolamide; LEA, linoleoyl ethanolamide; AEA, arachidonoyl ethanolamide; SE, standard error; n.s., not significant.
The combination of metagenomic and metabolomic profiling of the PRISM cohort8 enabled us to identify potential mechanistic associations between bacterial species and metabolites that were differentially abundant in IBD, including the species and NAEs used in this study (Fig. 3c; Supplementary Dataset 6). When comparing human co-variation data to our in vitro growth analysis, most strains responded to NAEs as predicted by the association model (Fig. 3b versus 3c), with the exception of S. salivarius and E. faecalis. While we observed significant correlations in vitro, S. salivarius abundances did not vary significantly between IBD and non-IBD subjects. E. faecalis did not correlate with NAE abundance in the PRISM cohort.
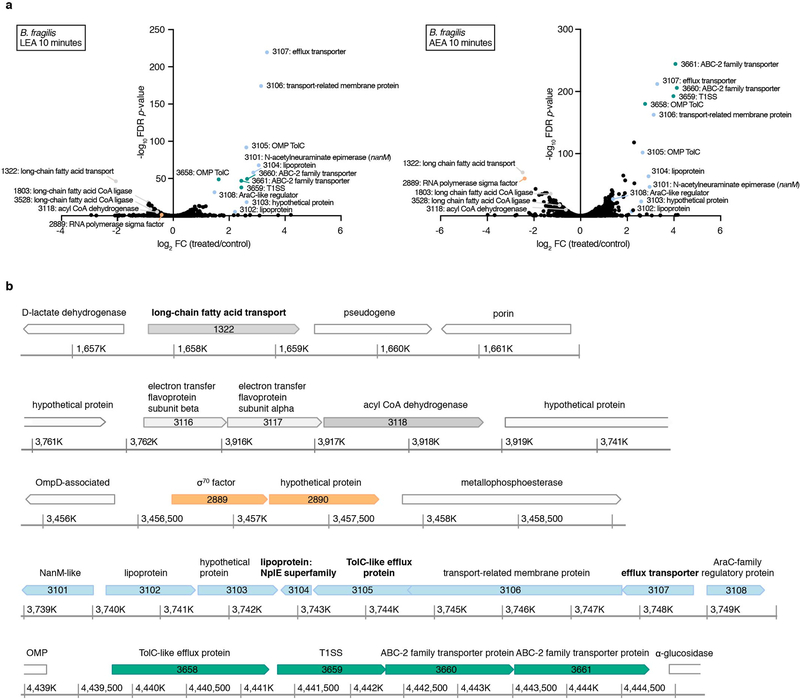
To decipher molecular mechanisms governing bacterial responses to NAEs, we analyzed the transcriptomes of B. fragilis after stimulation with LEA and AEA, which had the strongest inhibitory effects (Fig. 3b; Supplementary Dataset 7). We chose B. fragilis because it is a well-studied species belonging to a phylum often depleted in IBD4,12,19. In both treatments, the most upregulated genes encode putative membrane-associated proteins functioning in efflux transport (Extended Data 5a). All upregulated efflux genes are organized in two operons (Extended Data 5b), suggesting they may function in a pathway to actively pump NAEs and other fatty amides out of the cell or its periplasm. The most downregulated gene encodes an outer membrane protein homologous to E. coli FadL (BF9343_1322), a long-chain fatty acid (LCFA) importer21. Two genes with high similarity to fadD (BF9343_1803 and BF9343_3528), encoding the inner membrane-associated fatty acid CoA ligase that catalyzes esterification of incoming fatty acids into CoA thioesters, and one gene encoding a FadE homolog (BF9343_3118), an acyl CoA dehydrogenase involved in downstream fatty acid breakdown (log2FC<1), were also repressed in treated samples, indicating that B. fragilis recognizes both NAEs as LCFAs. Equally important in LCFA metabolism is the electron transfer from dehydrogenases to the membrane-bound respiratory chain by electron-transfer flavoproteins (ETFs). Both ETF subunits (BF9343_3116 and BF9343_3117) were downregulated in response to LEA and AEA. These data suggest that B. fragilis inhibits transport and metabolism of NAEs while promoting their efflux.
N-acylethanolamines shift ex vivo gut communities toward an IBD-like composition
To determine if the growth effects of NAEs observed in monoculture are recapitulated in a bacterial community, we obtained samples from two chemostats (A and B), each inoculated with stool from a distinct healthy donor. Samples were treated in duplicate with the four NAEs individually and combined (denoted as NAE-mix) and DMSO as a control. We collected samples prior to treatment and at 1, 4, 8, 12, and 24 hours post-treatment for combined shotgun metagenomic and metatranscriptomic sequencing. Profiling taxonomic composition of the resulting metagenomes, we identified 66 (chemostat A) and 85 species (chemostat B) prior to treatment, with an overlap of 28 species and 11 unclassified species from known genera (Supplementary Dataset 8). Several species from our monoculture assays were present: E. coli, Alistipes shahii and Streptococcus salivarius were found in both chemostats. B. fragilis and B. producta were detected in chemostat B.
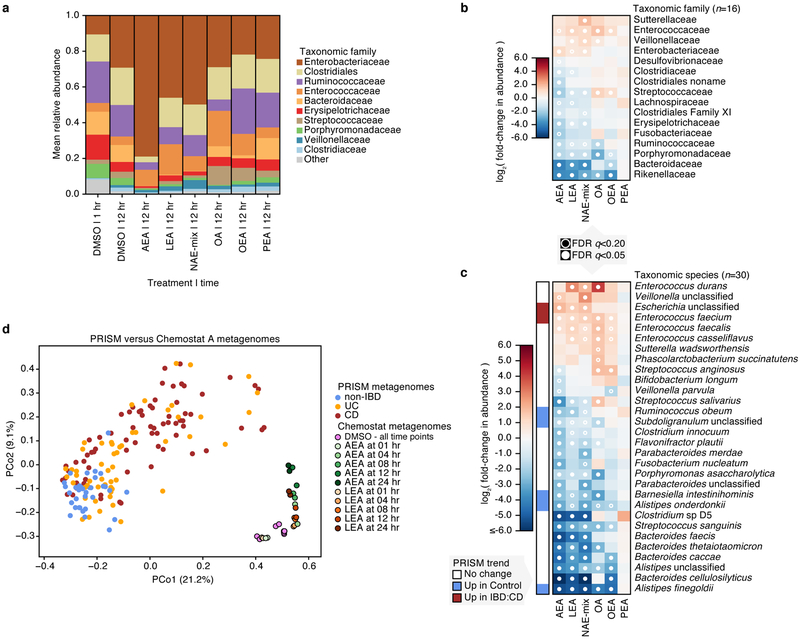
In chemostat A, Enterobacteriaceae, Clostridiaceae and Veillonellaceae expanded after 12 hours of treatment with DMSO (Fig. 4a), a possible consequence of oxygen tension. The most extreme effect after 12 hours was seen with AEA, with the community almost entirely overtaken by Enterobacteriaceae. LEA and NAE-mix treatments followed similar trends, with Enterococcaceae, Veillonellaceae and Enterobacteriaceae blooming at the expense of Streptococcaceae, Erysipelotrichaceae, Porphyromonadacea, Bacteroidaceae and Rikenellaceae (Supplementary Dataset 9). OEA treatment did not impact Enterobacteriaceae abundance but increased relative abundances of Enterococcaceae and Streptococcaceae and decreased those of Bacteroidaceae and Rikenellaceae (Fig. 4b). As a control, we tested oleic acid (OA), the fatty acid form of OEA and a known carbon source for E. coli22, on samples from chemostat A. Despite its ability to enhance E. coli growth in monoculture (Extended Data 6), OA had no significant effect on Enterobacteriaceae in a microbial community (Fig. 4b). However, OA treatment enhanced the growth of Enterococcaceae, Veillonellaceae and Streptococcaceae, suggesting that there may be competition for this molecule within the community. Effects of PEA were not significant.
Figure 4. Effects of N-acylethanolamines on the composition of a complex microbial community.
(a) Taxonomic abundances in chemostat A at the family level. Vertical colored bars represent the relative abundance of bacterial families in samples 1 and 12 hr after addition of DMSO (0.5%), individual NAEs, or a combination of all four NAEs (denoted as NAE-mix). Oleic acid (OA), the fatty acid form of OEA, was also tested. Individual NAEs and OA were added to a final concentration of 500 μM. In combination, the PEA:OEA:LEA:AEA ratio was 125:125:125:125 μM. Heatmaps show log2 fold-changes in (b) family- and (c) species-level taxonomic abundances between treated samples and DMSO controls (total n=66 with per-treatment n ranging from 8 to 10). Species that shifted with statistical significance in response to treatment are shown (*q<0.20, **q<0.05; FDR q-values derived from nominal two-tailed p-values of the “treatment” coefficient across per-taxon linear regression analyses). Species enriched (red) and depleted (blue) in PRISM CD stool relative to controls (q≤0.1) are indicated. (d) Principal coordinate (PCo) analysis on Bray-Curtis dissimilarities between chemostat A (n=29) and PRISM (n=155) metagenomes. Times of exposure to AEA, LEA and DMSO control are indicated.
We observed the greatest species-level effects after treatment with AEA (Fig. 4c), the NAE most significantly enriched in PRISM and iHMP IBD subjects (Fig. 2; Supplementary Dataset 2). Abundances of Alistipes and Bacteroides species decreased upon treatment with all NAEs except PEA (Fig. 4c), reflecting our monoculture observations (Fig. 3b; Extended Data 3, 4) and Bacteroidetes depletion in PRISM8 and iHMP IBD subjects12. Barnesiella intestinihominis, also underrepresented in PRISM IBD subjects, was inhibited by AEA, LEA, and NAE-mix in the complex community. In contrast, Escherichia spp. abundances increased with AEA, LEA and NAE-mix, again mirroring our observations in monocultures and IBD patients8,12. Although inhibited by NAEs in monoculture, E. faecalis bloomed in chemostat A, concordant with the positive association between NAEs and E. faecalis in our model (Fig. 3c). This represents an example of community metabolic interactions changing a microbial growth outcome.
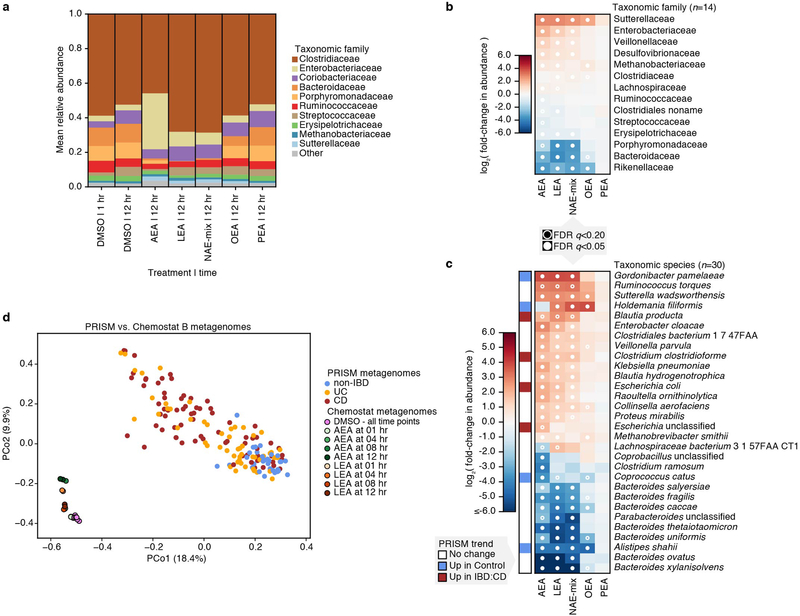
Chemostat B family-level composition remained stable over time with DMSO treatment and followed similar trends as chemostat A in the presence of NAEs (Extended Data 7a,b). At the species level, Blautia producta and Clostridium clostridioforme increased in relative abundance with AEA, LEA and NAE-mix. Both species are overrepresented in PRISM IBD subjects (Extended Data 7c). Klebsiella pneumoniae and Proteus mirabilis also increased under the same conditions, and K. pneumoniae is significantly enriched in iHMP IBD subjects12. Moreover, these two species correlated with colitis in a mouse model sharing histologic features with human UC23. These findings show that LEA, AEA and NAEs in combination are sufficient to shift ex vivo microbial communities from a healthy to an IBD-like composition. This conclusion was reinforced by combined ordination of species profiles from chemostats and PRISM metagenomes (Fig. 4d; Extended Data 7d). While the first axis of ordination (PCo1) corresponded with differences between in vivo and ex vivo communities, the second (PCo2) aligned with variation from non-IBD to IBD in PRISM subjects and control/early to later timepoints in chemostat samples.
Transcriptional changes highlight an antioxidant response to N-acylethanolamines
To determine how NAEs alter bacterial functions, we quantified KEGG Orthogroup (KO) abundances from our metatranscriptomes and metagenomes, then regrouped KO abundances to KEGG module abundances using KEGG’s structured module definitions24 (Supplementary Dataset 10). Module RNA relative abundance was divided by DNA relative abundance to produce ‘relative expression’, a measure of community functional activity that can be compared between samples over time25,26. Unlike the preceding analyses of community taxonomy, these functional comparisons were performed on a combination of profiles from the two chemostats (treating source chemostat as a fixed effect), thus enriching for functional changes consistent across both chemostats (see Methods).
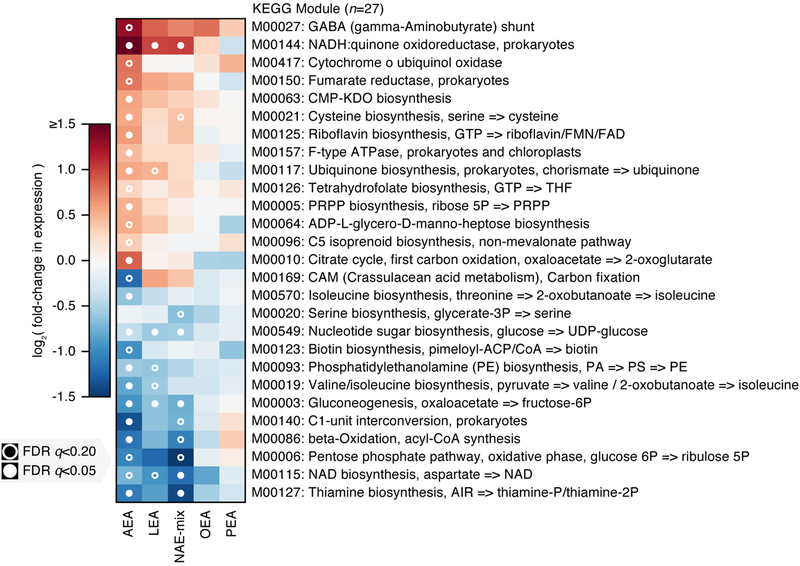
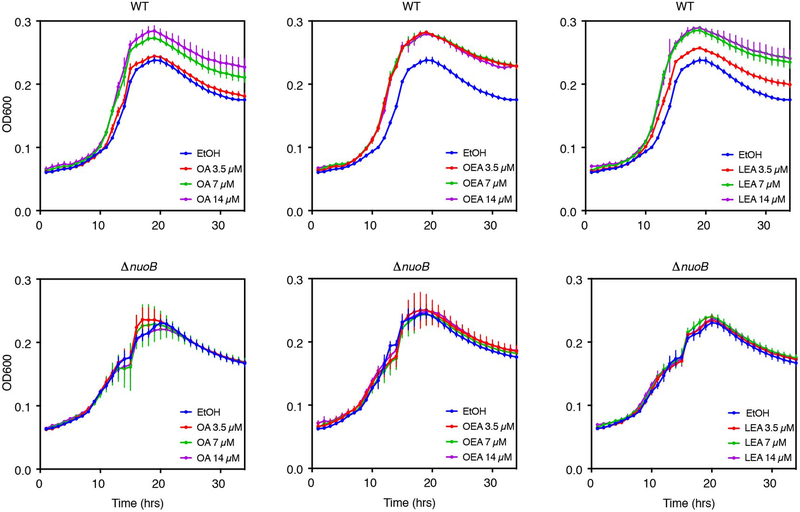
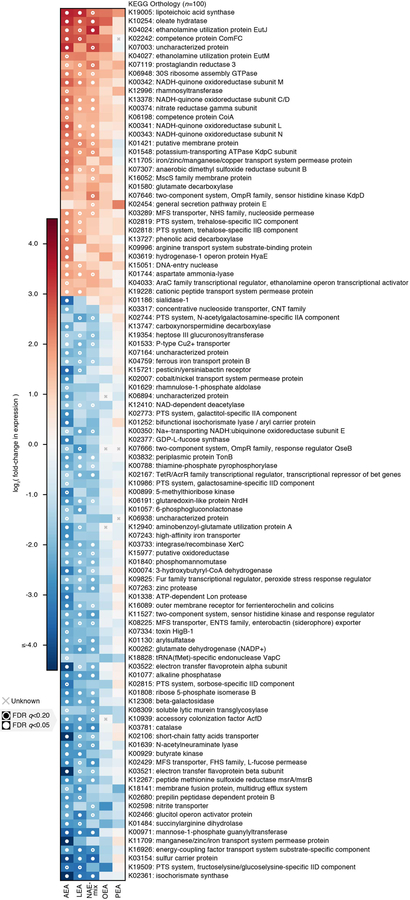
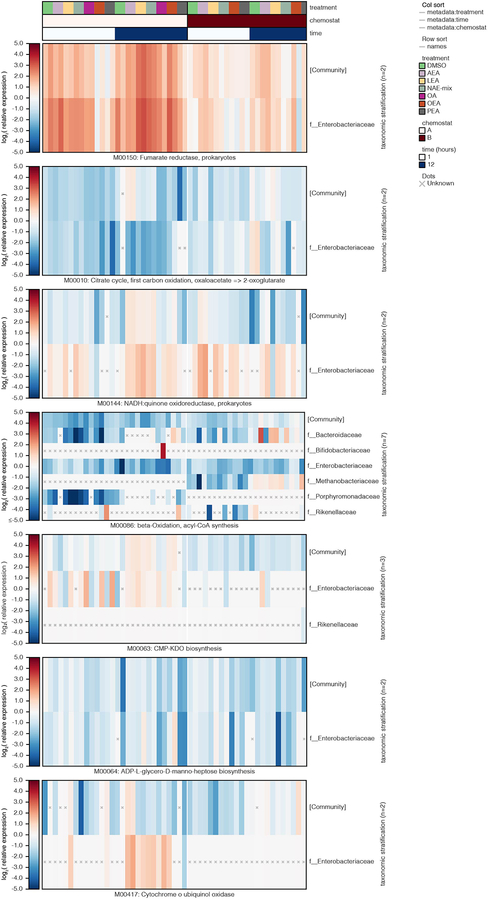
Similar to effects on community growth, AEA, LEA and NAE-mix elicited the most significant transcriptional responses (Fig. 5; Extended Data 8). Significantly altered KEGG modules included amino acid, cofactor, vitamin, carbohydrate, glycan and lipid metabolism functions (Supplementary Table 3). In the presence of AEA, both the anaerobic, reductive (M00150) and the oxidative (M00010) branches of the citrate cycle were upregulated, an effect driven by Enterobacteriaceae (Extended Data 9). Concomitant with increased energy metabolism was upregulation of the respiratory electron transport chain upon treatment with NAEs. Given that complex I (M00144) is required for OA metabolism in E. coli under aerobic conditions22, we tested whether complex I is important for NAE metabolism under anaerobic conditions. We grew wild-type and complex I-deficient (ΔnuoB)27 E. coli strains in the presence of OA, OEA or LEA (Extended Data 6). Unlike wild-type, growth of the ΔnuoB mutant was not enhanced by OA or NAEs, highlighting the necessity of a functional respiratory chain for NAE metabolism. Also enhanced in the presence of AEA and LEA was ubiquinone, a membrane-associated coenzyme in E. coli that transfers electrons from complex I to a final electron acceptor. In aerobic conditions, ubiquinone prevents oxidative stress resulting from fatty acid metabolism22. Our results suggest that its function is equally important for NAE metabolism in anaerobic conditions.
Figure 5. Changes in transcriptional activity in complex microbial communities in response to NAE treatment.
We used a linear model combining profiles of functional activity from both chemostats over time to identify metabolic pathways (KEGG modules) that were consistently differentially expressed under NAE treatment relative to DMSO controls (at the community level; total n=96 ranging from n=15 to 17 per treatment). The top 27 such modules ranked by mean absolute log-scaled fold-change in relative expression are shown. Each of these modules was significantly differentially expressed under at least one treatment after correcting for multiple hypothesis testing. Pathway:treatment pairs with open circles had FDR q<0.2, those with closed circles had FDR q<0.05 (FDR q-values derived from nominal two-tailed p-values of the “treatment” coefficient across per-module linear regression analyses). While trends were most significant under AEA treatment, effect sizes trended similarly under LEA and OEA treatment as well.
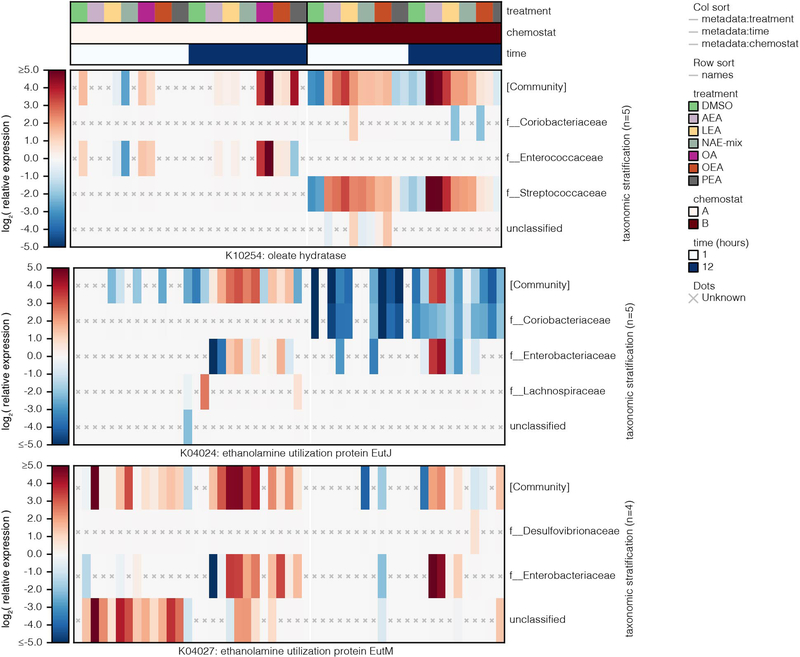
Assuming NAEs are metabolized like LCFAs after cleavage of the ethanolamine group, we investigated the aerobic beta-oxidation module (M00086) and KEGG orthology groups reported to operate in E. coli under anaerobic conditions (K12507, K01782, K00626)28 (Supplementary Dataset 10). In the chemostat communities, anaerobic fatty acid degradation functions were unchanged, and M00086 was repressed in response to OA and NAEs, suggesting the pathways of interest were insufficiently measured or other mechanisms of fatty acid degradation operate in anaerobic conditions. Indicating unsaturated NAE utilization, Streptococcaceae and Enterococcaceae upregulated an oleate hydratase (K10254) ((Extended Data 10)), which hydrates double bonds in fatty acids during an early metabolic step. Additionally, community-level functions involved in ethanolamine utilization (K04024, K04027) were upregulated in response to AEA, LEA and NAE-mix, pointing to NAE breakdown. Ethanolamine is an abundant nutrient source in the gut and many gut bacteria, especially pathogens, carry enzymes for its utilization29. Lipopolysaccharide (LPS) biosynthesis (M00063, M00064) was also upregulated in Enterobacteriaceae, indicative of increased replication in response to NAEs (Extended Data 9). LPS potently activates inflammatory responses and is important in IBD pathogenesis30. The aerobic pathway cytochrome ubiquinol oxidase (M00417) was upregulated in response to AEA; this effect, however, was driven exclusively by Enterobacteriaceae in chemostat A during late exposure times, potentially reflecting oxygen tension. The combined metatranscriptomic analysis of two chemostat communities highlighted the necessity of the respiratory chain for NAE metabolism in Enterobacteriaceae.
Discussion
The gut metabolome plays an increasingly recognized role mediating interactions between gut microbiota and host31,32. In this study, we screened a panel of microbes and metabolites that were differentially abundant in IBD for growth effects, identifying disease-enriched NAEs (AEA, LEA, OEA and PEA) that shift microbial communities toward an IBD-like state. AEA, LEA or a combination of all four NAEs were potent drivers of this shift. NAEs are part of the endocannabinoid system and involved in numerous biological processes including energy homeostasis, inflammation and gut barrier function33,34. Produced primarily by the host17, NAE production varies with diet17,35,36. Endocannabinoid system imbalances are observed in obesity37, type 2 diabetes38 and intestinal inflammation39,40. Although the endocannabinoid system is a promising therapeutic target, few studies linked its dysregulation with altered microbiota composition41–43.
To determine effects of an upregulated endocannabinoid system on gut bacteria, we uncoupled host molecular activity from the microbiota by treating human microbial communities grown ex vivo with NAEs. Metagenomic analysis showed that the combination of NAEs enhanced growth of Proteobacteria at the expense of Bacteroidetes while altering Firmicutes composition, reflecting microbiome composition in IBD4,5,8,12. Perhaps the most compelling response to NAEs was Enterobacteriaceae expansion, a hallmark of IBD. The inflamed gut is prone to oxygen gradients that diffuse from the tissue surface to the lumen, favoring expansion of facultative aerobes, such as Enterobacteriaceae, while being detrimental to obligate anaerobes44–46. Although our study was designed to mimic anaerobic conditions of the gut, we cannot exclude effects of oxygen tension, which may be reflected in later chemostat A timepoints. Nonetheless, the comparison of NAE-treated samples with controls recapitulated perturbed microbial communities observed in IBD, implicating excessive NAE production as an important contributor to these taxonomic shifts. Except for AEA, the NAEs were detected in human stool in the micromolar range and used higher concentrations in our ex vivo system over short time periods to measure effects that may be undetectable using lower concentrations.
Growth responses to NAEs were consistent between chemostat communities and monocultures, demonstrating that responses are specific to NAE treatment and not only a consequence of bacterial interactions within a community. LEA, AEA and the combination of NAEs induced community-wide behavioral changes: cellular metabolism was upregulated in families whose growth was enhanced by NAEs, and LPS production increased in Enterobacteriaceae, potentially amplifying inflammatory effects on the host. Elevated AEA production increases gut permeability, which augments plasma LPS levels and perpetuates inflammation37. Not only does this create a feedback loop with LPS exacerbating gut barrier disruption but also promotes endocannabinoid system imbalance, as LPS stimulates AEA production in immune cells47,48.
How Enterobacteriaceae catabolize NAEs remains unknown. Considering NAE structure, the most likely pathway involves an amidase that separates the amine group from the carbon chain, providing a source of ethanolamine that many gut bacteria can utilize29. Although anaerobic beta-oxidation functions remained unchanged in our experiments, we cannot exclude that the resulting long-chain aldehyde undergoes beta-oxidation after conversion into a carboxylic acid49. We observed clear distinctions between LEA/AEA and OEA/PEA. The more unsaturated LEA/AEA displayed the strongest effects on bacterial growth and gene expression, suggesting that reductases and/or hydratases (such as the oleate hydratase identified in community transcriptomics) play a role in their metabolism and that organisms carrying these enzymes are favored in the presence of NAEs. Finally, our results show that the membrane-associated respiratory chain in Enterobacteriaceae is indispensable for NAE metabolism, which may be key for survival on NAEs. The electron transfer chain is critical for E. coli growth on non-fermentable carbon sources22, further supporting metabolism of NAEs by Enterobacteriaceae.
Our results show that increased NAE levels result in microbial shifts associated with IBD pathogenesis and suggest a pro-inflammatory feedback loop, but precise mechanisms of crosstalk between host and microbiota remain to be determined33. As a consequence of this host-microbial pro-inflammatory loop, NAE concentration could be used as a biomarker in IBD. While NAEs are likely one of many factors causing taxonomic shifts in IBD, our findings encourage the pursuit of therapies targeting NAE metabolism or receptor binding as a means to prevent deleterious changes in gut microbial composition.
Online Methods
Bacterial strains and culture conditions
Strains isolated from human subjects are listed in Supplementary Table 2. The following reference strains were used in this study: E. coli AIEC NC101, an adherent-invasive murine isolate that produces colitis in monoassociated IL10−/− mice and colibactin, a genotoxin that promotes development of colorectal cancer50,51; R. gnavus ATCC 29149 and B. cellulosilyticus DSM 14838 originating from human fecal samples; B. producta DSM 2950 from a case of septicemia; B. fragilis ATCC 25285 from an appendix abscess; and L. gasseri DSM 20243 from a human sample. E. coli and B. fragilis strains were grown in BHI medium (37 g L−1, Sigma-Aldrich) supplemented with 1% vitamin K1-hemin solution (BD Biosciences). All other strains were grown in BHI medium containing: 5% sterile-filtered fetal bovine serum (Sigma-Aldrich), 1% vitamin K1-hemin solution (BD Biosciences), 1% trace mineral supplement (ATCC), 1% trace vitamin supplement (ATCC), 1 g L−1 D-(+)-cellobiose (Sigma-Aldrich), 1 g L−1 D-(+)-maltose (Sigma-Aldrich), 1 g L−1 D-(+)-fructose (Sigma-Aldrich) and 0.5 g L−1 L-cysteine (Sigma-Aldrich). Media were sterilized using a Corning filter unit (0.22 μm pore diameter). Strains were grown under anaerobic conditions (atmosphere 5% H2, 20% CO2, 75% N2) in a soft-sided vinyl chamber (Coy Laboratory Products). The identity of each strain was confirmed by sequencing the rrs gene (16S ribosomal RNA) using primers 27F (5’- AGAGTTTGATCMTGGCTCAG) and 1492R (5’- GGTTACCTTGTTACGACTT)52. E. coli strains BW25113 and an isogenic mutant in gene nuoB (JW5875–2) were obtained from the Coli Genetic Stock Center. Both strains were grown anaerobically in minimal medium made of 2x M9 salts (Teknova, #M1901), 4 g L−1 glucose and 1% trace mineral supplement (ATCC). Strains were preserved in cryotubes (Nunc) at −80°C in growth medium containing 25% glycerol.
Metabolites and bacterial screen
The 50 metabolites used in this study are described in Supplementary Dataset 1. All metabolites were brought to 100 mM in DMSO (Sigma-Aldrich, D2438–10ML) except metabolites that were insoluble at this concentration (D-sphingosine, creatine, C16:0 LPC, L-carnitine, C18:1 CE, 4-guanidinobutanoic acid, C18:1 LPC, ascorbic acid). Purity was assessed by LC-MS (Supplementary Table 1). Twelve metabolites were of unknown purity because they were not detected by LC-MS, 5 metabolites were below 50% purity (mostly LCFAs), 5 metabolites were 80–89% pure, and 28 metabolites were 90–100% pure. Assay Ready Plates were prepared on a Labcyte Echo 555 acoustic dispensing instrument, which dispensed metabolites or DMSO as 0.1 μL droplets to the bottom of 384-well plates (low evaporation lid, Costar 3680). Once the transfers were completed, the plates were sealed and vacuum packed. A HighRes Biosolutions automation system integrated all the instruments needed for the creation of Assay Ready Plates. Each metabolite was dispensed in four replicates and 54 controls (0.25% DMSO) were included per plate. One metabolite replicate for each molecule was tested in sterile medium to verify metabolite sterility and 24 wells contained medium alone. Overnight bacterial cultures were diluted 100-fold in appropriate media and 40 μL were dispensed per well containing metabolite, DMSO or neither. The plates were shaken to ensure homogeneity and bacterial growth was monitored anaerobically (absorbance at 600 nm) in a microplate reader (PowerWave HT Microplate Spectrophotometer, BioTek) for 41 hours at 37°C without shaking. Values recorded for DMSO controls and metabolite-treated triplicates were averaged. The values recorded for each metabolite in sterile media were subtracted from the treated mean. Growth curves were plotted using GraphPad Prism version 7.0. Growth rates and carrying capacities were estimated by fitting degree-5 smoothing splines to measurements of absorbance (OD600) over time using the UnivariateSpline option in Python’s scipy.interpolate package (v0.18.0) with a smoothing factor of 0.002. The maximum interpolated value of each smoothing spline was saved as a robust estimate of carrying capacity (max OD600; Supplementary Dataset 3) while the maximum value of the spline’s first derivative was saved as an estimate of maximum growth rate (Vmax; Supplementary Dataset 3).
Screen results were validated in dose assays for seven metabolites (Sigma-Aldrich) using different batches from those used in the single-dose screen (Extended Data 1). Due to impurities revealed by LC-MS analysis (Supplementary Table 1), long-chain fatty acids were excluded from dose assays. Covariations between differentially abundant NAEs and differentially abundant bacterial species were determined as described in Franzosa, et al8.
To test the effects of all four NAEs on L. gasseri, E. coli, R. gnavus, A. shahii, R. lactaris, S. salivarius, B. fragilis and E. faecalis growth, overnight cultures were diluted 100-fold in appropriate media and 100 μL was dispensed per well in 96-well plates (low evaporation lid, Costar 3370). Controls (0.4% DMSO) and metabolites (PEA, OEA, LEA or AEA) at final concentrations of 50 μM and 100 μM were tested in triplicate. Plates were shaken for homogeneity and growth was monitored anaerobically (absorbance at 600 nm) in a microplate reader for 41 hours at 37°C without shaking. Growth rates and carrying capacities were calculated as above and linear models of maximum growth rate (Vmax) vs. concentration and maximum cell growth (max OD600) vs. concentration were then used to estimate dose response per NAE per isolate.
Overnight cultures of BW25113 and JW5875–2 were diluted 100-fold in minimal media and 100 μL was dispensed per well in 96-well plates. Controls (ethanol 0.05%) and metabolites (OA, OEA or LEA) at final concentrations of 3.5 μM, 7 μM and 14 μM were tested in triplicate. The plates were shaken to ensure homogeneity and bacterial growth was monitored anaerobically (absorbance at 600 nm) in a microplate reader (PowerWave HT Microplate Spectrophotometer, BioTek) for 34 hours at 37°C without shaking. Values recorded for ethanol controls and metabolite-treated triplicates were averaged and are represented in Extended Data 6.
Mice
C57BL/6 Rag2−/− mice were bred and housed in specific pathogen-free (SPF) conditions at the National Gnotobiotic Rodent Resource Center at the University of North Carolina at Chapel Hill (UNC-CH). Mice were fed autoclaved water and a standard rodent chow diet (Teklad, Cat#TD2020). Animal experiments were approved by the UNC-CH Institutional Animal Care and Use Committee (Protocol# 15–345).
Adoptive T-cell transfer
Splenic cells were collected from SPF-raised C57BL/6 female donors (n=4) aged eight to twelve weeks and were mechanically dissociated in RPMI1640 (Gibco/Life Technologies) containing 100 U mL−1 penicillin-streptomycin (Gibco/Life Technologies). Red blood cells were lysed (Sigma-Aldrich) and naïve CD4+ T cells (CD44negCD62L+CD4+ T cells) were magnetically purified by negative-sorting with anti-CD8a, CD11b, CD11c, CD19, CD25, B220, CD49b, CD105, MHC class II, Ter-119, TCR-γ/δ, and CD44 microbeads (Miltenyi Biotec). Purity of naïve CD4+ T cells was confirmed to be greater than 98% by flow cytometry using anti-CD3, TCR-β, CD4, CD8, CD44, CD62L and CD45 antibodies53, while cell viability was shown to be greater than 94% by eosin Y exclusion. SPF-raised C57BL/6 Rag2−/− female recipient mice (n=7) aged eight to twelve weeks received 5 × 10⁵ purified naïve CD4+ T cells suspended in 300 μL of cold sterile 1x PBS (Corning Mediatech) injected into the tail vein. Treated and non-treated control mice (n=4 females; n=3 males) were housed individually in SPF conditions. Fresh feces were collected and immediately snap-frozen before and six weeks after T-cell transfer. A colitis histology score of 6–8 was confirmed in mice developing inflammation54. C57BL/6 mice (n=4 females) and C57BL/6 Rag2−/− mice (n=11 females, n=3 males) were randomly chosen from two and three independent litters, respectively. Numbers were empirically determined based on studies using colitis disease models55 to achieve statistically significant effects.
Approval for human patient research
Human patient research in the PRISM cohort was reviewed and approved by the Partners Human Research Committee (ref. 2004-P-001067). Stool samples from healthy subjects used in the chemostat experiment were obtained under protocol approved by the institutional review board at MIT (IRB protocol ID no. 15102716171631). Participants under both protocols provided informed consent and all experiments adhered to the regulations of the review boards.
Extraction of N-acylethanolamines from stool
Human (PRISM cohort) and mouse (C57BL/6 Rag2−/−) stool was added to pre-weighed 2 mL microcentrifuge tubes and weight was recorded. Three, 3 mm tungsten carbide beads were added to each tube and samples were mixed with a 10-fold aliquot (w/v) of 10% ethanol and vortexed at high speed for 10 minutes to homogenize. A 100 μL aliquot of each homogenate was added to a new 1.5mL microcentrifuge tube and samples were extracted by adding 900 μL of 25:10:65 dichloromethane:isopropanol:methanol spiked with internal standard (100nM d4-AEA). Following room temperature centrifugation at 10,000 g for 10 minutes, 100 μL of each supernatant was added to an autosampler vial for LC-MS/MS analysis.
LC-MS/MS analysis of N-acylethanolamines from stool
Supernatants from human (PRISM cohort) and mouse (C57BL/6 Rag2−/−) stool were analyzed by injection (10 μL and 5 μL respectively) onto a Phenomenex Kinetex C18 column (3×30 mm, 2.6 μm, 100 Å) at a flow rate of 0.4 mL min−1 delivered by a Shimadzu Prominence LC system. All targets were ionized and detected using an AB Sciex 6500 QTRAP operating in MRM mode. The starting mobile phase was maintained for 1 minute and consisted of 60% solvent A (0.1% formic acid in water) and 40% solvent B (0.1% formic acid in acetonitrile). The gradient was then ramped to 90% B at 5 minutes and was held for 1 minute followed by starting mobile phase conditions for 1 minute. NAEs were monitored in positive ion mode with transitions for d4-AEA, AEA, PEA, LEA and OEA at m/z 352.3 → 66.0, 348.3 → 62.0, 300.3 → 62.0, 324.3 → 62.0, and 326.3 → 62.0 respectively. DuoSpray ion source parameters were as follows: curtain gas, 50; collision gas, medium; ion spray voltage, 5500; temperature, 500°C; GS1, 45; GS2, 45. LC-MS/MS data acquisition and analysis were performed in Analyst 1.6.3 (Sciex).
Monoculture transcriptional analysis
Triplicate cultures of B. fragilis ATCC 25285 were diluted 1:100 from overnight cultures into 23 mL of BHI medium supplemented with 1% Vitamin K1-hemin and complex BHI medium and grown to early exponential phase (OD600 0.1–0.3) in anaerobic conditions. Cultures were divided into 6 mL aliquots in 50-mL Falcon tubes and DMSO (0.04%) or LEA (25 μM) or AEA (25 μM) was added to one aliquot from each triplicate culture. After 10 minutes, 1 mL of each condition was pelleted in the anaerobic chamber, the supernatant discarded and the pellet resuspended in 500 μL Trizol. Trizol suspensions underwent a step of bead-beating using ~500 μL of 0.1 mm silica beads (BioSpec). RNA was extracted with the Direct-Zol RNA MiniPrep Plus (Zymo Research) according to manufacturer’s instructions.
Chemostat community and perturbation
Operation and maintenance of the chemostat was based on a system published by the Allen-Vercoe lab56. Cultures were grown in modified-YCFA media in a 500 mL Multifors 2 chemostat (Infors AG) with working volumes of 400 mL at 37 °C and 250 rpm agitation. Anaerobic conditions were maintained by the constant addition of nitrogen gas. The feed rate of the modified-YCFA media was ~400 mL/day throughout the experiment. To inoculate the system, two healthy donors provided fresh fecal samples in a sealed sterile plastic container which was placed in an anaerobic chamber (atmosphere 5% H2, 20% CO2, 75% N2) within 5−10 minutes of defecation. Each fecal sample was processed into a 10% (w/v) fecal slurry by mixing 1 g of feces in 10 mL of growth medium in 5 GentleMACs dissociator tubes (Miltenyi Biotec). Once homogenized, the fecal slurry was combined and centrifuged (5 min, 400g) to remove large particulates, such as residual undigested food. The supernatant was filtered through a 70 μm filter. 40 mL of the fecal slurry was used to inoculate the 400 mL chemostat. Modified-YCFA medium consisted of (per 1 L): 10 g casitone (BD Biosciences), 5 g dextrose, 2.5 g yeast extract, 4 g NaHCO3, 1 g L-cysteine-HCl, 0.45 g K2HPO4, 0.45 g KH2PO4, 0.9 g NaCl, 0.045 g MgSO4 × 7 H2O, 0.09 g CaCl2 × 2 H2O, 1 mg resazurin, 10 mg hemin, 2.5 mL antifoam B emulsion, 1.9 mL acetic acid, 0.7 mL propionic acid, 90 μL iso-butyric acid, 0.1 mL n-valeric acid, and 0.1 mL iso-valeric acid (all chemicals from Sigma-Aldrich). The solution was adjusted to pH 6.7–6.8 and autoclaved. A sterile vitamin mix consisting of 2 mg biotin, 2 mg folic acid, 10 mg pyridoxine-HCl, 5 mg thiamine-HCl x 2 H2O, 5 mg riboflavin, 5 mg nicotinic acid, 5 mg D-Ca-pantothenate, 0.1 mg vitamin B12, 5 mg p-aminobenzoic acid, and 5 mg lipoic acid (all chemicals from Sigma-Aldrich). Complex communities were anaerobically retrieved from the chemostats on day 8 (chemostat A) and day 11 (chemostat B), imported into the anaerobic chamber and diluted fivefold in modified YCFA-medium. The diluted communities were divided into 4 mL aliquots in 50 mL Falcon tubes to which DMSO (0.5%), PEA (500 μM), OEA (500 μM), LEA (500 μM), AEA (500 μM) or a combination of all four NAEs (125:125:125:125 μM PEA:OEA:LEA:AEA) was added in duplicate. Samples (150 μL) for metagenomic and metatranscriptomic analysis were collected prior to treatment and at 1h, 4h, 8h, 12h and 24h (chemostat A only) post-treatment and were frozen at −80°C. Total DNA and RNA were extracted using the AllPrep Power Fecal 96 kit (Qiagen) after thawing the aliquots on ice, pelleting cells and discarding the supernatant.
Generation of RNA sequencing data
Illumina cDNA libraries were generated using a modified version of the RNAtag-seq protocol57. Briefly, 500 ng of total RNA was fragmented, depleted of genomic DNA, dephosphorylated, and ligated to DNA adapters carrying 5’-AN8−3’ barcodes of known sequence with a 5’ phosphate and a 3’ blocking group. Barcoded RNAs were pooled and depleted of rRNA using the RiboZero rRNA depletion kit (Epicentre). Pools of barcoded RNAs were converted to Illumina cDNA libraries in 2 main steps: (i) SMARTScribe (Takara Bio) reverse transcription of the RNA using a primer binding to the constant region of the barcoded adapter and addition of an adapter to the 3’ end of the cDNA by template switching58; and (ii) PCR amplification using primers whose 5’ ends target the constant regions of the 3’ or 5’ adapters of the cDNA and whose 3’ ends contain the full Illumina P5 or P7 sequences. cDNA libraries were sequenced on an Illumina NextSeq for monoculture transcriptomic data and on the Illumina HiSeq 2500 platform to generate paired-end reads for metatranscriptomic data.
Generation of DNA sequencing data
Illumina DNA sequencing libraries were prepared from 100–250 pg of DNA using the Nextera XT DNA Library Preparation Kit (Illumina) according to the manufacturer’s recommended protocol, with reaction volumes scaled accordingly. Equal volumes (200 nL) of each library were pooled and insert sizes and concentrations for each pooled library were determined using an Agilent Bioanalyzer DNA 1000 kit (Agilent Technologies). Metagenomic libraries were sequenced on the HiSeq 2500 platform (Illumina), targeting ~1 Gb of sequence per sample with 101 base pair, paired-end reads.
Analysis of monoculture RNA sequencing data
Sequencing reads from each sample in a pool were demultiplexed based on their associated barcode sequence using custom scripts (https://github.com/broadinstitute/split_merge_pl). Up to one mismatch in the barcode was allowed provided it did not make assignment of the read to a different barcode possible. Barcode sequences were removed from the first read as were terminal G’s from the second read that may have been added by SMARTScribe during template switching. Reads were aligned to the B. fragilis ATCC 25285 genome using Burrows-Wheeler Alignment (BWA) tool59, and read counts were assigned to genes and other genomic features based on NCBI reference sequences. Differential expression analysis was determined with edgeR (Bioconductor)60. Visualization of raw sequencing data and coverage plots in the context of genome sequences and gene annotations was conducted using GenomeView61.
Analysis of metagenomic and metatranscriptomic data
We analyzed our metagenomes and metatranscriptomes with the bioBakery meta’omics workflows introduced in McIver, et al62. Briefly, we first quality controlled sequencing reads using the KneadData pipeline (v0.7.1), which trims low-quality bases and reads from each meta’ome using Trimmomatic and then maps remaining high-quality reads to human genome and transcript databases to deplete host contamination (which was expected to be minimal due to the stool being incubated in a chemostat for long periods of time; chemostat A for eight days and chemostat B for 11 days). We profiled community taxonomy from sample metagenomes using MetaPhlAn2 (v2.2.0)63 and community gene family (UniRef90) abundance using HUMAnN2 (v0.11.1)64. We further profiled community transcript family (UniRef90) abundance from sample metatranscriptomes using HUMAnN2, using the taxonomic profile of each paired metagenome as a guide.
We regrouped community gene and transcript abundances to KEGG65 Orthogroup (KO) abundance using HUMAnN2 utility scripts. We then fed these KO abundances back into HUMAnN2 to compute KEGG module abundance using module definitions from January 2019. This process was carried out with HUMAnN2’s “minpath” and “gap-fill” options disabled to quantify all modules and add robustness to small modules, respectively. Module abundances were normalized to relative abundance units while excluding unintegrated gene and transcript read mass. We then computed module relative expression as a measure of functional activity by taking the log-ratio of the module’s RNA relative abundance to its DNA relative abundance (thus adjusting for the tendency of more broadly encoded modules to have higher raw abundance in metatranscriptomes). When computing relative expression, we treated 0/0, x/0, and 0/x ratios as nan, inf, and -inf, respectively (for x > 0).
We assessed the differential abundance of taxa between DMSO- and NAE-treated samples within each chemostat separately to compensate for their distinct initial taxonomic compositions. Zero-valued taxa were additively smoothed within-sample by half the sample’s smallest non-zero taxon abundance. All abundances were then log-transformed to variance stabilize the data prior to statistical testing. For each taxon exceeding 0.1% (pre-transformed) relative abundance in at least two samples from the same treatment group, we tested differential abundance over treatments using the following linear model evaluated with R’s lm function (v3.2.3):
Coefficients of the different NAE treatments were computed relative to the control (DMSO) level. Because these coefficients reflect the difference in mean, log-transformed abundance under treatment vs. control, we interpret them as a summary estimate of log-transformed fold-change in abundance after treatment. Statistical significance (p-values) of treatment coefficients were subjected to Benjamini-Hochberg FDR control within each treatment.
We computed differential relative expression of KEGG modules over a combination of profiles from both chemostats using the above-described log-transformed relative expression values. (Unlike the per-chemostat taxonomic analysis, this analysis therefore enriches for conserved changes in functional activity in distinct taxonomic backgrounds.) To be analyzed, we required a module to have finite relative expression in 1) at least five samples from two different treatment groups, and 2) at least one sample from each replicate. Such modules were then analyzed with nan, inf, and -inf ratios excluded. Modules were analyzed using the following linear model in base R:
Which incorporates a fixed effect for chemostat and for each replicate within each chemostat. Coefficients for treatments and their p-values were processed as described above for the models of taxonomic abundances.
Extended Data
Extended Data Fig. 1. Validation of metabolite screen results in dose assays.
Growth curves are shown for three strains using seven metabolites in multiple concentrations. Growth was monitored over time in a volume of 40 μL per well in 384-well plates. The final concentration of DMSO per treated and control well was 0.25%. Growth curves representative of three independent tests are shown and error bars in controls represent the standard deviation of the mean of six technical replicates.
Extended Data Fig. 2. Correlation between absolute and relative NAE abundances in stool from PRISM subjects.
NAEs detected in stool from PRISM Crohn’s disease (CD) patients (n=21) in absolute abundances (ng mg−1) are plotted against their respective relative abundances8. Pearson correlation coefficients (r) are shown. Progenesis QI (nonlinear DYNAMICS) was used for the extraction of non-targeted LC-MS features and TraceFinder (Thermo Fisher Scientific) was used for the manual peak extraction of known metabolites on basis of their mass to charge ratio (m/z) and retention times determined using authentic standards. Abbreviations: PEA, palmitoylethanolamide; OEA, oleoyl ethanolamide; LEA, linoleoyl ethanolamide; AEA, arachidonoyl ethanolamide.
Extended Data Fig. 3. Growth effects of N-acylethanolamines on intestinal bacteria elevated in IBD.
Palmitoylethanolamide (PEA), linoleoyl ethanolamide (LEA), oleoyl ethanolamide (OEA) and arachidonoyl ethanolamide (AEA) were added to growing cells (in the range of 106 to 108 CFU mL−1) in three concentrations (0 μM, 50 μM and 100 μM), and growth was monitored in an absorbance reader in the anaerobic chamber over time. Controls contained 0.4% DMSO. Growth curves representative of two independent experiments are shown and error bars represent the standard deviation of the mean of three technical replicates.
Extended Data Fig. 4. Growth effects of N-acylethanolamines on intestinal bacteria depleted or invariable in IBD.
Palmitoylethanolamide (PEA), linoleoyl ethanolamide (LEA), oleoyl ethanolamide (OEA) and arachidonoyl ethanolamide (AEA) were added to growing cells (in the range of 106 to 108 CFU mL−1) in three concentrations (0 μM, 50 μM and 100 μM), and growth was monitored in an absorbance reader in the anaerobic chamber over time. Controls contained 0.4% DMSO. Growth curves representative of two independent experiments are shown and error bars represent the standard deviation of the mean of three technical replicates.
Extended Data Fig. 5. Transcriptional responses of Bacteroides fragilis to linoleoyl ethanolamide (LEA) and arachidonoyl ethanolamine (AEA).
(a) Differential gene expression between three independent exponential cultures treated for 10 minutes with a sub-inhibitory concentration (25 μM) of LEA or AEA and controls (0.04% DMSO). Differential expression was determined with edgeR, and gene functions were defined using InterPro (EMBL), the NCBI Conserved Domain Database (CDD) and the Kyoto Encyclopedia of Genes and Genomes (KEGG) database. Selected significantly differentially expressed genes (|log2 fold-change (treated/control)|>0.5, FDR<0.05; Benjamini-Hochberg FDR values were derived from p-values calculated using the likelihood-ratio test) are shown in color. (b) Genomic environment of the differentially expressed genes using colors that correspond with (a). Genes in white were not significantly differentially expressed. Coordinate maps refer to the genome of strain B. fragilis ATCC 25285. Gene products that have been experimentally shown to be associated with the outer membrane by LC-MS/MS analysis are in bold66.
Extended Data Fig. 6. Oleic acid, oleoyl ethanolamide and linoleoyl ethanolamide do not enhance growth of a complex I mutant.
Growth of wild-type (WT) E. coli BW25113 and a derivative deficient for complex I (NADH:quinone oxidoreductase, ΔnuoB) in minimal medium (M9 with glucose 4 g L−1 and 1% trace minerals) supplemented with EtOH 0.05%, 3.5 μM, 7 μM and 14 μM of oleic acid (OA), oleoyl ethanolamide (OEA) or linoleoyl ethanolamide (LEA). Growth curves representative of two independent experiments are shown and error bars represent the standard deviation of the mean of three technical replicates.
Extended Data Fig. 7. Effects of N-acylethanolamines on the composition of a complex microbial community.
(a) Taxonomic abundances in chemostat B at the family level. Vertical colored bars represent the relative abundance of bacterial families in samples 1 and 12 hr after addition of DMSO (0.5%), individual NAEs, or a combination of all four NAEs (denoted as NAE-mix). Individual NAEs were added to a final concentration of 500 μM. In combination, the PEA:OEA:LEA:AEA ratio was 125:125:125:125 μM. Heatmaps show log2 fold-changes in (b) family- and (c) species-level taxonomic abundances between treated samples and DMSO controls (total n=41 with per-treatment n ranging from 6 to 7). Species that shifted with statistical significance in response to treatment are shown (*q<0.20, **q<0.05; FDR q-values derived from nominal two-tailed p-values of the “treatment” coefficient across per-taxon linear regression analyses). Species enriched (red) and depleted (blue) in PRISM CD stool relative to controls (q≤0.1) are indicated. (d) Principal coordinate (PCo) analysis on Bray-Curtis dissimilarities between chemostat B (n=21) and PRISM (n=155) metagenomes. Times of exposure to AEA, LEA and DMSO control are indicated.
Extended Data Fig. 8. Changes in transcriptional activity in complex microbial communities in response to NAE treatment.
We used a linear model combining profiles of functional activity from both chemostats over time to identify gene families (KEGG orthologies) that were consistently differentially expressed under NAE treatment relative to DMSO controls (at the community level; total n=96 ranging from n=15 to 17 per treatment). The top 100 such orthologies ranked by mean absolute log-scaled fold-change in relative expression are shown. Each of these orthologies was significantly differentially expressed under at least one treatment after correcting for multiple hypothesis testing. Pathway:treatment pairs with open circles had FDR q<0.2, those with closed circles had FDR q<0.05, while an “x” indicates that measurements were insufficient to perform the test (FDR q-values derived from nominal two-tailed p-values of the “treatment” coefficient across per-orthology linear regression analyses). While trends were most significant under AEA treatment, effect sizes trended similarly under LEA and OEA treatment as well.
Extended Data Fig. 9. Changes in transcriptional activity (KEGG modules) in complex microbial communities in response to NAE treatment.
Log2 relative expression is shown for bacterial families contributing to a selection of KEGG modules in samples from chemostats A and B treated with DMSO control, individual NAEs, a combination of all four NAEs (denoted as NAE-mix), or oleic acid (OA). Family-level relative expression values were computed at the species level, averaged over replicates, and then averaged within-family while weighting by species abundance. Unknown (“x”) values represent cases where a function’s DNA and/or RNA abundance were zero for a given stratification (resulting in non-finite log2 relative expression). Col_sort refers to the measure (treatment, time or chemostat used to order the metadata columns). Abbreviations: PEA, palmitoylethanolamide; OEA, oleoyl ethanolamide; LEA, linoleoyl ethanolamide; AEA, arachidonoyl ethanolamide.
Extended Data Fig. 10. Changes in transcriptional activity (KEGG orthologies) in complex microbial communities in response to NAE treatment.
Log2 relative expression is shown for bacterial families contributing to a selection of KEGG orthologies in samples from chemostats A and B treated with DMSO control, individual NAEs, a combination of all four NAEs (denoted as NAE-mix), or oleic acid (OA). Family-level relative expression values were computed at the species level, averaged over replicates, and then averaged within-family while weighting by species abundance. Unknown (“x”) values represent cases where a function’s DNA and/or RNA abundance were zero for a given stratification (resulting in non-finite log2 relative expression). Col_sort refers to the measure (treatment, time or chemostat used to order the metadata columns). Abbreviations: PEA, palmitoylethanolamide; OEA, oleoyl ethanolamide; LEA, linoleoyl ethanolamide; AEA, arachidonoyl ethanolamide.
Supplementary Material
Chemostat microbial species relative abundance profiles. Taxonomic composition of the chemostat community prior to and after treatment with NAEs, determined using MetaPhlAn263.
Model results in chemostat communities. Outputs of statistical models comparing microbial species relative abundance, microbial family relative abundance, KO relative expression, and KEGG Module relative expression to NAE treatment (one tab per feature type) in chemostats A (total n=66 with per-treatment n ranging from 8 to 10) and B (total n=41 with per-treatment n ranging from 6 to 7). Columns indicate the dependent variable (e.g. an individual species), covariate (e.g. treatment with LEA), model coefficient, p-value, and FDR q-value.
Metabolites used in this study. Properties of metabolites used in this study, including metabolite class, name, molecular weight, HMDB ID and formula as found in the Human Metabolome Database (http://www.hmdb.ca).
KEGG modules and KEGG orthologies in chemostat communities.
IBD-metabolite associations. Model results (t-statistics, p-values, and q-values) for metabolite features associated against the two IBD phenotypes (CD and UC) in the PRISM (n=155) and iHMP (n=132) cohorts. This list is reproduced from Franzosa, et al.8 and Lloyd-Price, et al.12 to include the newly validated arachidonoyl ethanolamine.
Metabolite effects on bacterial growth. Growth rate (Vmax) and maximum cell growth (max OD600) per concentration of metabolite.
Rag2−/− mouse microbial species relative abundance profiles. Taxonomic composition of the Rag2−/− mouse fecal microbiota determined using MetaPhlAn263. Units are relative abundance (out of 1.0).
S5: NAE effects on bacterial growth. Growth rate (Vmax) and maximum cell growth (max OD600) per concentration of NAE.
Microbial species-NAE associations. Spearman correlations between species relative abundances and NAEs that were differentially abundant in IBD samples from the PRISM cohort (n=155)8.
Transcriptomic responses of B. fragilis to LEA and AEA. Transcriptomic data of B. fragilis treated with LEA or AEA for 10 minutes. Differential expression analysis between DMSO- and NAE-treated cultures was conducted with edgeR60.
Acknowledgements
The authors are grateful to Anita Vrcic and Samuel Figueroa-Lazu for preparing the metabolites and to Tiffany Poon for coordinating DNA and RNA sequencing. Broad Technology Labs generated metagenomic libraries, and RNA-Seq libraries were constructed and sequenced at the Broad Institute of MIT and Harvard by the Microbial ‘Omics Core and Genomics Platform, respectively. The Microbial ‘Omics Core also provided guidance on experimental design and conducted preliminary analysis for all RNA-Seq data. We are deeply indebted to Theresa Reimels for helpful discussions, editing the manuscript, and figure generation. We thank Brantley Hall, Douglas Kenny, Damian Plichta, Zach Costliow, Guadalupe Jasso, Jason Rush and Xiaobo Ke for insightful discussions. This work was funded by grants from the National Institutes of Health (NIH) R24DK110499 and U54DK102557 (C.H. and R.J.X.), R01AT009708 (R.J.X.), P01DK094779 and P40OD010995 (RBS), the Crohn’s and Colitis Foundation (R.J.X.), and the Center for Microbiome Informatics and Therapeutics (R.J.X.).
Footnotes
Code Availability
Custom scripts used to analyze monoculture transcriptomic data are available at https://github.com/broadinstitute/split_merge_pl. The bioBakery tools (KneadData, MetaPhlAn2 and HUMAnN2) used to process meta’omic sequencing data from the two chemostats are available via http://huttenhower.sph.harvard.edu/biobakery as source code and installable packages. Downstream analyses were conducted using custom Python and R scripts. This code (and associated usage notes) are available from the authors upon request.
Data Availability
Metagenomic, metatranscriptomic and transcriptomic data are available in NCBI Sequence Read Archive as BioProject PRJNA532456. Tables of processed mouse microbial species, monoculture transcriptomic data and chemostat microbial species are available as Supplementary Datasets 4, 7 and 8, respectively.
Competing Interests
The authors declare no competing interests.
References
- 1.Xavier RJ & Podolsky DK Unravelling the pathogenesis of inflammatory bowel disease. Nature 448, 427–434 (2007). [DOI] [PubMed] [Google Scholar]
- 2.Schirmer M, Garner A, Vlamakis H & Xavier RJ Microbial genes and pathways in inflammatory bowel disease. Nat Rev Microbiol 17, 497–511 (2019). [DOI] [PMC free article] [PubMed] [Google Scholar]
- 3.Plichta DR, Graham DB, Subramanian S & Xavier RJ Therapeutic Opportunities in Inflammatory Bowel Disease: Mechanistic Dissection of Host-Microbiome Relationships. Cell 178, 1041–1056 (2019). [DOI] [PMC free article] [PubMed] [Google Scholar]
- 4.Lewis JD, et al. Inflammation, Antibiotics, and Diet as Environmental Stressors of the Gut Microbiome in Pediatric Crohn’s Disease. Cell Host Microbe 18, 489–500 (2015). [DOI] [PMC free article] [PubMed] [Google Scholar]
- 5.Hall AB, et al. A novel Ruminococcus gnavus clade enriched in inflammatory bowel disease patients. Genome Med 9, 103 (2017). [DOI] [PMC free article] [PubMed] [Google Scholar]
- 6.Dorrestein PC, Mazmanian SK & Knight R Finding the missing links among metabolites, microbes, and the host. Immunity 40, 824–832 (2014). [DOI] [PMC free article] [PubMed] [Google Scholar]
- 7.Santoru ML, et al. Cross sectional evaluation of the gut-microbiome metabolome axis in an Italian cohort of IBD patients. Sci Rep 7, 9523 (2017). [DOI] [PMC free article] [PubMed] [Google Scholar]
- 8.Franzosa EA, et al. Gut microbiome structure and metabolic activity in inflammatory bowel disease. Nat Microbiol 4, 293–305 (2019). [DOI] [PMC free article] [PubMed] [Google Scholar]
- 9.Smith PM, et al. The microbial metabolites, short-chain fatty acids, regulate colonic Treg cell homeostasis. Science 341, 569–573 (2013). [DOI] [PMC free article] [PubMed] [Google Scholar]
- 10.Blander JM, Longman RS, Iliev ID, Sonnenberg GF & Artis D Regulation of inflammation by microbiota interactions with the host. Nat Immunol 18, 851–860 (2017). [DOI] [PMC free article] [PubMed] [Google Scholar]
- 11.Imhann F, et al. Interplay of host genetics and gut microbiota underlying the onset and clinical presentation of inflammatory bowel disease. Gut 67, 108–119 (2018). [DOI] [PMC free article] [PubMed] [Google Scholar]
- 12.Lloyd-Price J, et al. Multi-omics of the gut microbial ecosystem in inflammatory bowel diseases. Nature 569, 655–662 (2019). [DOI] [PMC free article] [PubMed] [Google Scholar]
- 13.Zhang LS & Davies SS Microbial metabolism of dietary components to bioactive metabolites: opportunities for new therapeutic interventions. Genome Med 8, 46 (2016). [DOI] [PMC free article] [PubMed] [Google Scholar]
- 14.Ni J, et al. A role for bacterial urease in gut dysbiosis and Crohn’s disease. Sci Transl Med 9(2017). [DOI] [PMC free article] [PubMed] [Google Scholar]
- 15.Wahlstrom A, Sayin SI, Marschall HU & Backhed F Intestinal Crosstalk between Bile Acids and Microbiota and Its Impact on Host Metabolism. Cell Metab 24, 41–50 (2016). [DOI] [PubMed] [Google Scholar]
- 16.Le Gall G, et al. Metabolomics of fecal extracts detects altered metabolic activity of gut microbiota in ulcerative colitis and irritable bowel syndrome. J Proteome Res 10, 4208–4218 (2011). [DOI] [PubMed] [Google Scholar]
- 17.Hansen HS Role of anorectic N-acylethanolamines in intestinal physiology and satiety control with respect to dietary fat. Pharmacol Res 86, 18–25 (2014). [DOI] [PubMed] [Google Scholar]
- 18.Surana NK & Kasper DL The yin yang of bacterial polysaccharides: lessons learned from B. fragilis PSA. Immunol Rev 245, 13–26 (2012). [DOI] [PMC free article] [PubMed] [Google Scholar]
- 19.Gevers D, et al. The treatment-naive microbiome in new-onset Crohn’s disease. Cell Host Microbe 15, 382–392 (2014). [DOI] [PMC free article] [PubMed] [Google Scholar]
- 20.Read S & Powrie F Induction of inflammatory bowel disease in immunodeficient mice by depletion of regulatory T cells. Curr Protoc Immunol Chapter 15, Unit 15 13 (2001). [DOI] [PubMed] [Google Scholar]
- 21.Fujita Y, Matsuoka H & Hirooka K Regulation of fatty acid metabolism in bacteria. Mol Microbiol 66, 829–839 (2007). [DOI] [PubMed] [Google Scholar]
- 22.Agrawal S, et al. A genome-wide screen in Escherichia coli reveals that ubiquinone is a key antioxidant for metabolism of long-chain fatty acids. J Biol Chem 292, 20086–20099 (2017). [DOI] [PMC free article] [PubMed] [Google Scholar]
- 23.Garrett WS, et al. Enterobacteriaceae act in concert with the gut microbiota to induce spontaneous and maternally transmitted colitis. Cell Host Microbe 8, 292–300 (2010). [DOI] [PMC free article] [PubMed] [Google Scholar]
- 24.Kanehisa M, Furumichi M, Tanabe M, Sato Y & Morishima K KEGG: new perspectives on genomes, pathways, diseases and drugs. Nucleic Acids Res 45, D353–D361 (2017). [DOI] [PMC free article] [PubMed] [Google Scholar]
- 25.Abubucker S, et al. Metabolic reconstruction for metagenomic data and its application to the human microbiome. PLoS Comput Biol 8, e1002358 (2012). [DOI] [PMC free article] [PubMed] [Google Scholar]
- 26.Franzosa EA, et al. Relating the metatranscriptome and metagenome of the human gut. Proc Natl Acad Sci U S A 111, E2329–2338 (2014). [DOI] [PMC free article] [PubMed] [Google Scholar]
- 27.Schneider D, et al. Assembly of the Escherichia coli NADH:ubiquinone oxidoreductase (complex I). Biochim Biophys Acta 1777, 735–739 (2008). [DOI] [PubMed] [Google Scholar]
- 28.Campbell JW, Morgan-Kiss RM & Cronan JE Jr. A new Escherichia coli metabolic competency: growth on fatty acids by a novel anaerobic beta-oxidation pathway. Mol Microbiol 47, 793–805 (2003). [DOI] [PubMed] [Google Scholar]
- 29.Kaval KG & Garsin DA Ethanolamine Utilization in Bacteria. MBio 9(2018). [DOI] [PMC free article] [PubMed] [Google Scholar]
- 30.Pasternak BA, et al. Lipopolysaccharide exposure is linked to activation of the acute phase response and growth failure in pediatric Crohn’s disease and murine colitis. Inflamm Bowel Dis 16, 856–869 (2010). [DOI] [PMC free article] [PubMed] [Google Scholar]
- 31.Lee WJ & Hase K Gut microbiota-generated metabolites in animal health and disease. Nat Chem Biol 10, 416–424 (2014). [DOI] [PubMed] [Google Scholar]
- 32.Donia MS & Fischbach MA HUMAN MICROBIOTA. Small molecules from the human microbiota. Science 349, 1254766 (2015). [DOI] [PMC free article] [PubMed] [Google Scholar]
- 33.Cani PD, et al. Endocannabinoids--at the crossroads between the gut microbiota and host metabolism. Nat Rev Endocrinol 12, 133–143 (2016). [DOI] [PubMed] [Google Scholar]
- 34.Alhouayek M & Muccioli GG The endocannabinoid system in inflammatory bowel diseases: from pathophysiology to therapeutic opportunity. Trends Mol Med 18, 615–625 (2012). [DOI] [PubMed] [Google Scholar]
- 35.Diep TA, et al. Dietary fat decreases intestinal levels of the anorectic lipids through a fat sensor. FASEB J 25, 765–774 (2011). [DOI] [PubMed] [Google Scholar]
- 36.Fu J, et al. Food intake regulates oleoylethanolamide formation and degradation in the proximal small intestine. J Biol Chem 282, 1518–1528 (2007). [DOI] [PMC free article] [PubMed] [Google Scholar]
- 37.Muccioli GG, et al. The endocannabinoid system links gut microbiota to adipogenesis. Mol Syst Biol 6, 392 (2010). [DOI] [PMC free article] [PubMed] [Google Scholar]
- 38.Jourdan T, Godlewski G & Kunos G Endocannabinoid regulation of beta-cell functions: implications for glycaemic control and diabetes. Diabetes Obes Metab 18, 549–557 (2016). [DOI] [PMC free article] [PubMed] [Google Scholar]
- 39.Di Sabatino A, et al. The endogenous cannabinoid system in the gut of patients with inflammatory bowel disease. Mucosal Immunol 4, 574–583 (2011). [DOI] [PubMed] [Google Scholar]
- 40.D’Argenio G, et al. Up-regulation of anandamide levels as an endogenous mechanism and a pharmacological strategy to limit colon inflammation. FASEB J 20, 568–570 (2006). [DOI] [PubMed] [Google Scholar]
- 41.Geurts L, et al. Adipose tissue NAPE-PLD controls fat mass development by altering the browning process and gut microbiota. Nat Commun 6, 6495 (2015). [DOI] [PMC free article] [PubMed] [Google Scholar]
- 42.Geurts L, et al. Altered gut microbiota and endocannabinoid system tone in obese and diabetic leptin-resistant mice: impact on apelin regulation in adipose tissue. Front Microbiol 2, 149 (2011). [DOI] [PMC free article] [PubMed] [Google Scholar]
- 43.Di Paola M, et al. Oleoylethanolamide treatment affects gut microbiota composition and the expression of intestinal cytokines in Peyer’s patches of mice. Sci Rep 8, 14881 (2018). [DOI] [PMC free article] [PubMed] [Google Scholar]
- 44.Rivera-Chavez F, Lopez CA & Baumler AJ Oxygen as a driver of gut dysbiosis. Free Radic Biol Med 105, 93–101 (2017). [DOI] [PubMed] [Google Scholar]
- 45.Rigottier-Gois L Dysbiosis in inflammatory bowel diseases: the oxygen hypothesis. ISME J 7, 1256–1261 (2013). [DOI] [PMC free article] [PubMed] [Google Scholar]
- 46.Albenberg L, et al. Correlation between intraluminal oxygen gradient and radial partitioning of intestinal microbiota. Gastroenterology 147, 1055–1063 e1058 (2014). [DOI] [PMC free article] [PubMed] [Google Scholar]
- 47.Liu J, et al. Lipopolysaccharide induces anandamide synthesis in macrophages via CD14/MAPK/phosphoinositide 3-kinase/NF-kappaB independently of platelet-activating factor. J Biol Chem 278, 45034–45039 (2003). [DOI] [PubMed] [Google Scholar]
- 48.Maccarrone M, et al. Lipopolysaccharide downregulates fatty acid amide hydrolase expression and increases anandamide levels in human peripheral lymphocytes. Arch Biochem Biophys 393, 321–328 (2001). [DOI] [PubMed] [Google Scholar]
- 49.Wentzel A, Ellingsen TE, Kotlar HK, Zotchev SB & Throne-Holst M Bacterial metabolism of long-chain n-alkanes. Appl Microbiol Biotechnol 76, 1209–1221 (2007). [DOI] [PubMed] [Google Scholar]
- 50.Arthur JC, et al. Intestinal inflammation targets cancer-inducing activity of the microbiota. Science 338, 120–123 (2012). [DOI] [PMC free article] [PubMed] [Google Scholar]
- 51.Kim SC, et al. Variable phenotypes of enterocolitis in interleukin 10-deficient mice monoassociated with two different commensal bacteria. Gastroenterology 128, 891–906 (2005). [DOI] [PubMed] [Google Scholar]
- 52.Lane DJ 16S/23S rRNA sequencing., (John Wiley and Sons, New York, NY, 1991). [Google Scholar]
- 53.Mishima Y, et al. Microbiota maintain colonic homeostasis by activating TLR2/MyD88/PI3K signaling in IL-10-producing regulatory B cells. J Clin Invest 130, 3702–3716 (2019). [DOI] [PMC free article] [PubMed] [Google Scholar]
- 54.Liu B, Tonkonogy SL & Sartor RB Antigen-presenting cell production of IL-10 inhibits T-helper 1 and 17 cell responses and suppresses colitis in mice. Gastroenterology 141, 653–662, 662 e651–654 (2011). [DOI] [PMC free article] [PubMed] [Google Scholar]
- 55.Olson TS, et al. Expanded B cell population blocks regulatory T cells and exacerbates ileitis in a murine model of Crohn disease. J Clin Invest 114, 389–398 (2004). [DOI] [PMC free article] [PubMed] [Google Scholar]
- 56.McDonald JA, et al. Evaluation of microbial community reproducibility, stability and composition in a human distal gut chemostat model. J Microbiol Methods 95, 167–174 (2013). [DOI] [PubMed] [Google Scholar]
- 57.Shishkin AA, et al. Simultaneous generation of many RNA-seq libraries in a single reaction. Nat Methods 12, 323–325 (2015). [DOI] [PMC free article] [PubMed] [Google Scholar]
- 58.Zhu YY, Machleder EM, Chenchik A, Li R & Siebert PD Reverse transcriptase template switching: a SMART approach for full-length cDNA library construction. Biotechniques 30, 892–897 (2001). [DOI] [PubMed] [Google Scholar]
- 59.Li H & Durbin R Fast and accurate short read alignment with Burrows-Wheeler transform. Bioinformatics 25, 1754–1760 (2009). [DOI] [PMC free article] [PubMed] [Google Scholar]
- 60.Robinson MD, McCarthy DJ & Smyth GK edgeR: a Bioconductor package for differential expression analysis of digital gene expression data. Bioinformatics 26, 139–140 (2010). [DOI] [PMC free article] [PubMed] [Google Scholar]
- 61.Abeel T, Van Parys T, Saeys Y, Galagan J & Van de Peer Y GenomeView: a next-generation genome browser. Nucleic Acids Res 40, e12 (2012). [DOI] [PMC free article] [PubMed] [Google Scholar]
- 62.McIver LJ, et al. bioBakery: a meta’omic analysis environment. Bioinformatics 34, 1235–1237 (2018). [DOI] [PMC free article] [PubMed] [Google Scholar]
- 63.Truong DT, et al. MetaPhlAn2 for enhanced metagenomic taxonomic profiling. Nat Methods 12, 902–903 (2015). [DOI] [PubMed] [Google Scholar]
- 64.Franzosa EA, et al. Species-level functional profiling of metagenomes and metatranscriptomes. Nat Methods 15, 962–968 (2018). [DOI] [PMC free article] [PubMed] [Google Scholar]
- 65.Kanehisa M & Goto S KEGG: kyoto encyclopedia of genes and genomes. Nucleic Acids Res 28, 27–30 (2000). [DOI] [PMC free article] [PubMed] [Google Scholar]
- 66.Wilson MM, Anderson DE & Bernstein HD Analysis of the outer membrane proteome and secretome of Bacteroides fragilis reveals a multiplicity of secretion mechanisms. PLoS One 10, e0117732 (2015). [DOI] [PMC free article] [PubMed] [Google Scholar]
Associated Data
This section collects any data citations, data availability statements, or supplementary materials included in this article.
Supplementary Materials
Chemostat microbial species relative abundance profiles. Taxonomic composition of the chemostat community prior to and after treatment with NAEs, determined using MetaPhlAn263.
Model results in chemostat communities. Outputs of statistical models comparing microbial species relative abundance, microbial family relative abundance, KO relative expression, and KEGG Module relative expression to NAE treatment (one tab per feature type) in chemostats A (total n=66 with per-treatment n ranging from 8 to 10) and B (total n=41 with per-treatment n ranging from 6 to 7). Columns indicate the dependent variable (e.g. an individual species), covariate (e.g. treatment with LEA), model coefficient, p-value, and FDR q-value.
Metabolites used in this study. Properties of metabolites used in this study, including metabolite class, name, molecular weight, HMDB ID and formula as found in the Human Metabolome Database (http://www.hmdb.ca).
KEGG modules and KEGG orthologies in chemostat communities.
IBD-metabolite associations. Model results (t-statistics, p-values, and q-values) for metabolite features associated against the two IBD phenotypes (CD and UC) in the PRISM (n=155) and iHMP (n=132) cohorts. This list is reproduced from Franzosa, et al.8 and Lloyd-Price, et al.12 to include the newly validated arachidonoyl ethanolamine.
Metabolite effects on bacterial growth. Growth rate (Vmax) and maximum cell growth (max OD600) per concentration of metabolite.
Rag2−/− mouse microbial species relative abundance profiles. Taxonomic composition of the Rag2−/− mouse fecal microbiota determined using MetaPhlAn263. Units are relative abundance (out of 1.0).
S5: NAE effects on bacterial growth. Growth rate (Vmax) and maximum cell growth (max OD600) per concentration of NAE.
Microbial species-NAE associations. Spearman correlations between species relative abundances and NAEs that were differentially abundant in IBD samples from the PRISM cohort (n=155)8.
Transcriptomic responses of B. fragilis to LEA and AEA. Transcriptomic data of B. fragilis treated with LEA or AEA for 10 minutes. Differential expression analysis between DMSO- and NAE-treated cultures was conducted with edgeR60.


