Abstract
Coeliac disease (CeD) is a complex, polygenic inflammatory enteropathy caused by exposure to dietary gluten that selectively occurs in a subset of genetically susceptible HLA-DQ8 and HLA-DQ2 individuals1,2. The need to develop non-dietary treatments is now widely recognized3, but it is hampered by the lack of a pathophysiologically relevant gluten- and HLA-dependent preclinical model. Furthermore, while human studies have led to major advances in our understanding of CeD pathogenesis4, direct demonstration of the respective roles of disease-predisposing HLA molecules, and adaptive and innate immunity in the development of tissue damage is missing. To address these unmet needs, we engineered a mouse model that reproduces the dual overexpression of IL-15 in the gut epithelium and the lamina propria (LP) characteristic of active CeD, expresses the predisposing HLA-DQ8 molecule, and develops villous atrophy (VA) upon gluten ingestion. We show that overexpression of IL-15 in both the epithelium and LP is required for the development of VA, demonstrating the location-dependent central role of IL-15 in CeD pathogenesis. Furthermore, our study reveals that CD4+ T cells and HLA-DQ8 are required for VA development, because of their critical role in the licensing of cytotoxic T cells to mediate intestinal epithelial cell (IEC) lysis. Finally, it establishes that IFN-γ and transglutaminase 2 (TG2) are central for tissue destruction. This mouse model, by reflecting the complex interplay between gluten, genetics and the IL-15-driven tissue inflammation, represents a powerful preclinical model for the characterization of cellular circuits critically involved in intestinal tissue damage in CeD, and the identification and testing of new therapeutic strategies.
CeD is characterized by dietary gluten induced destruction of the small intestinal epithelium and a substantial infiltration of intraepithelial lymphocytes (IELs)5. The presence of IgG antibodies against deamidated gliadin peptides (DGP) and anti-TG2 IgG and IgA antibodies are hallmarks of active CeD that are used for diagnosis of patients5,6.
The mechanisms underlying the clinical spectrum of CeD remain poorly understood5. IL15 is a proinflammatory cytokine that is presented by its private chain IL-15Rα on the cell surface under conditions of stress and inflammation7,8. In active CeD, IL-15 is upregulated in both the LP and in IECs. IL-15 expressed by IECs plays a critical role in the expansion of IELs with a cytotoxic phenotype in CeD patients9. In addition, studies in gluten-immunized mouse models suggest that gluten specific CD4 T cells are not sufficient to induce VA10. These observations led us to propose in 2006 a model where the combination of adaptive anti-gluten immunity and IL-15 overexpression in IECs is required for CD8+ cytotoxic intraepithelial T cells (IE-CTLs) to mediate tissue destruction by acquiring a fully activated killer phenotype11. In keeping with this hypothesis, potential CeD patients, who conserve a normal intestinal morphology despite having lost oral tolerance to gluten lack IL-15 upregulation in IECs9. Furthermore, studies using ovalbumin as a model dietary antigen and transgenic mice with CD4+ T cells specific for ovalbumin, showed that the cooperation between IL-15 and CD4+ T cells is critical to activate CD8 T cells and induce tissue damage12.
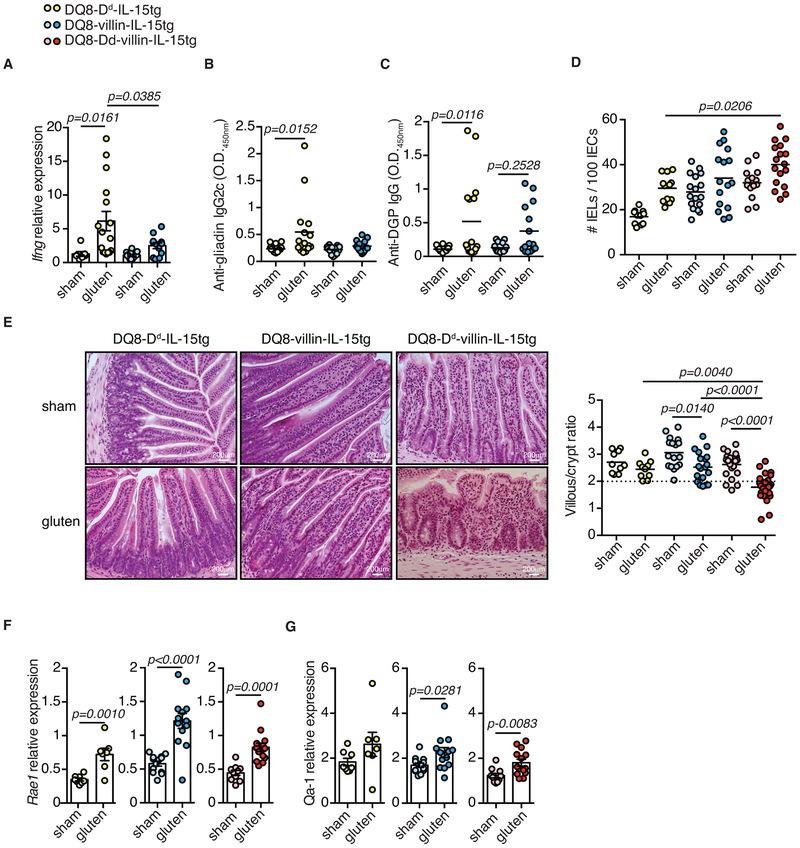
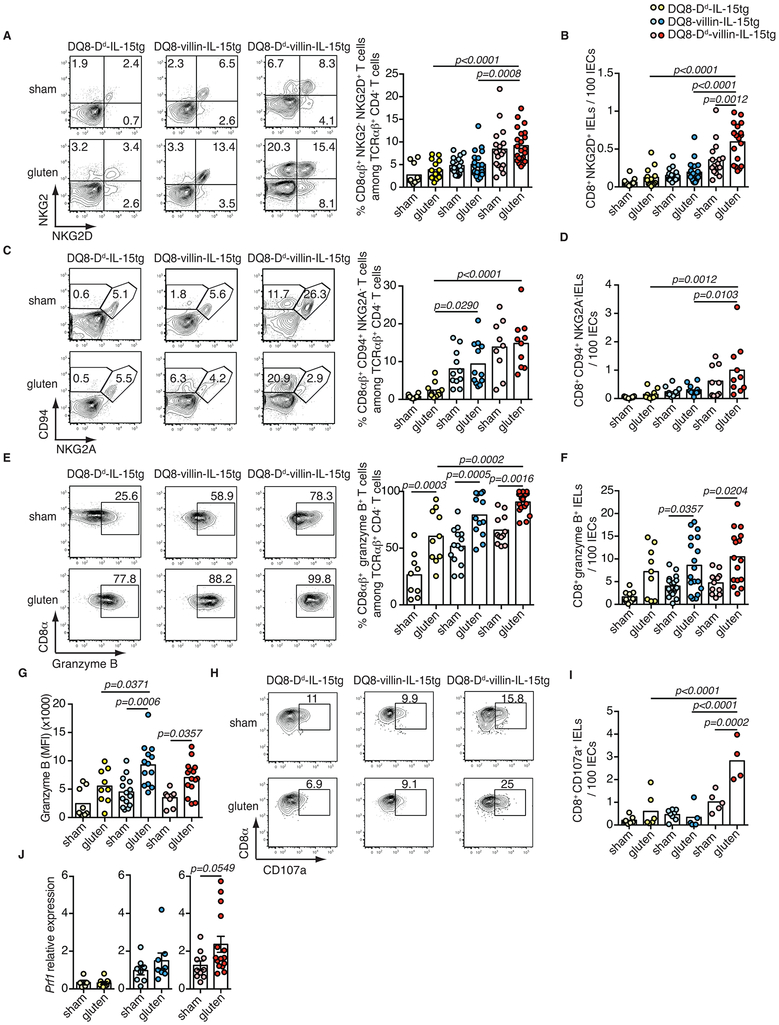
To define the pathophysiological role of IL-15 in the different mucosal compartments, we studied mice over-expressing IL-15 in IECs, the LP, or both. DQ8-Dd-IL-15tg mice that overexpress IL-15 under the MHC class I promoter Dd, which drives IL-15 upregulation in the LP and mesenteric lymph nodes, but not in IECs, developed T-helper 1 (TH1) immunity to gluten and anti-DGP antibodies without altering the cytolytic phenotype of IELs13 (Extended Data Fig. 1A-D and Extended Data Fig. 2). In contrast, DQ8-villin-IL-15tg mice that overexpress IL-15 in IECs under the intestinal epithelium-specific villin promoter failed to develop adaptive anti-gluten immunity, as assessed by the absence of anti-gluten IgG2c (Extended Data Fig. 1B) and anti-DGP antibodies (Extended Data Fig. 1C). However, they displayed an expansion of IELs with high levels of granzyme B and perforin expression (Extended Data Fig. 2E-G, J). Notably, both DQ8-Dd-IL-15tg mice and DQ8-villin-IL-15tg mice failed to develop VA (Extended Data Fig. 1E).
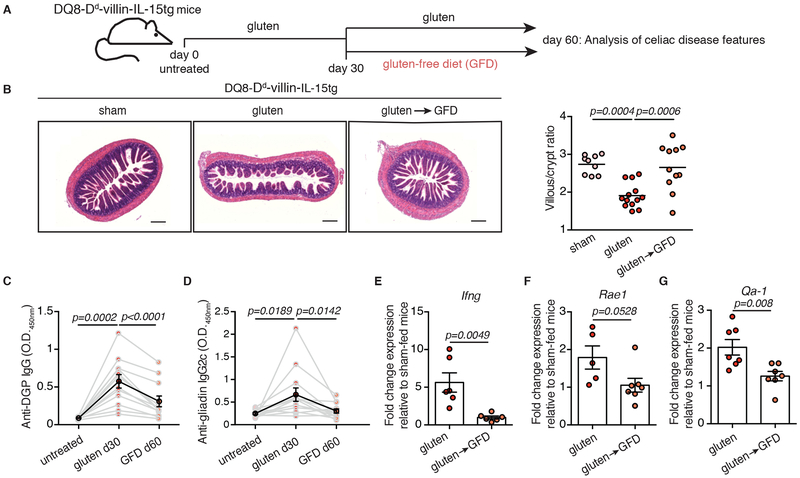
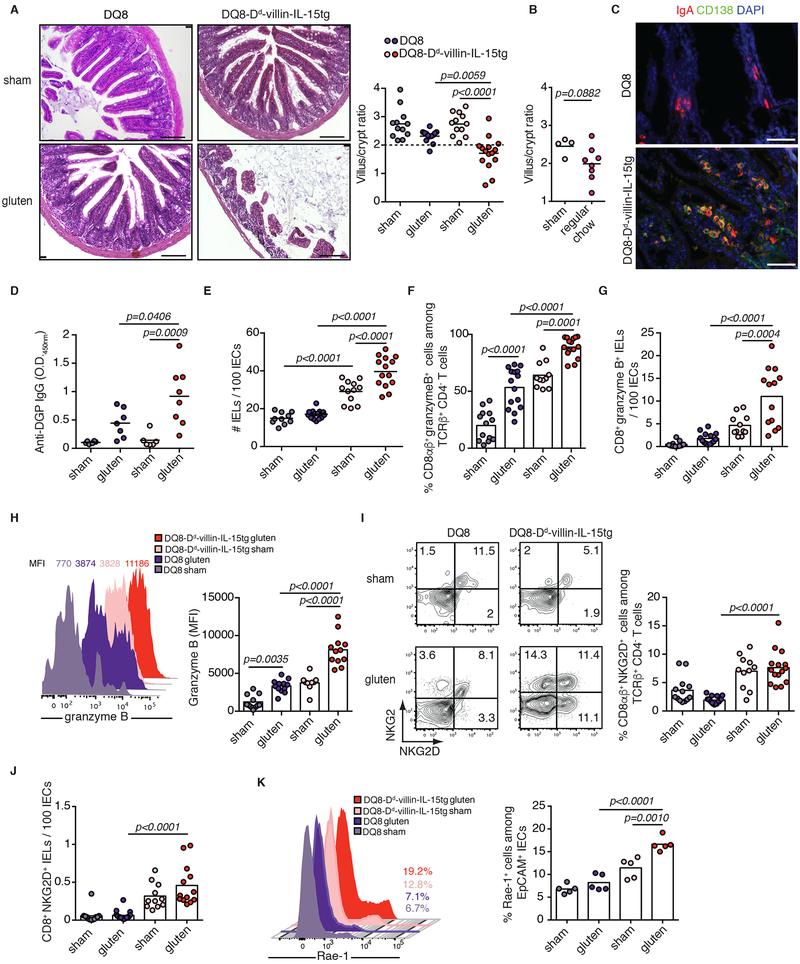
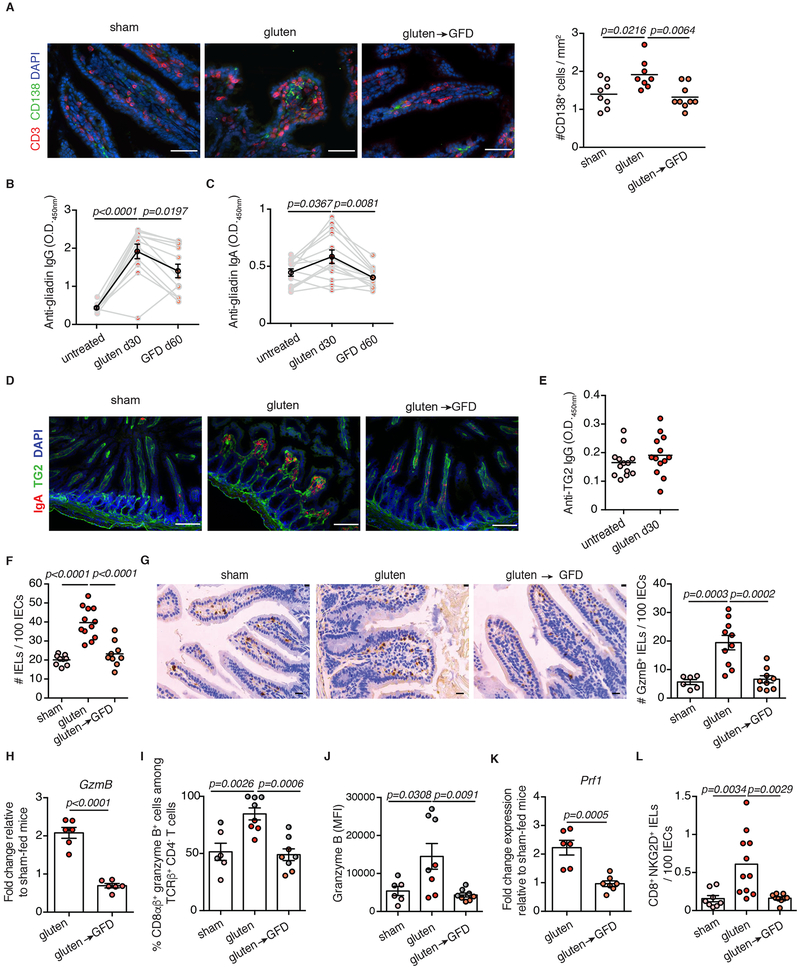
To test the hypothesis that IL-15 upregulation both in IECs and the LP is required for the development of VA, we generated DQ8-Dd-villin-IL-15tg mice. Approximately 75% of DQ8-Dd-villin-IL-15tg mice developed small intestinal tissue destruction upon 30 days of gluten feeding (Extended Data Fig. 1E and Extended Data Fig. 3A, B). Importantly, the villous architecture was restored upon gluten exclusion (Fig. 1A, B). Furthermore, as in CeD patients, gluten-fed DQ8-Dd-villin-IL-15tg mice: (i) developed plasmacytosis in the LP (Extended Data Fig. 3C and Extended Data Fig. 4A); (ii) had circulating anti-gluten IgG and IgA antibodies (Extended Data Fig. 4B, C), and (iii) anti-DGP IgG antibodies (Fig. 1C and Extended Data Fig. 3D). Despite our ability to detect IgA and TG2 colocalization in the small intestine (Extended Data Fig. 4D), we failed to detect consistently anti-TG2 antibodies in the serum (Extended Data Fig. 4E). This may reflect the absence of a mouse homolog of the human VH5-51 gene segment that recognizes TG2 in its germline configuration14. The presence of circulating anti-gluten IgG2c antibodies (Fig. 1D) was indicative of gliadin-specific B cell activation by anti-gluten TH1 T cells. In accordance, IFN-γ, the predominant cytokine associated with CeD in humans15, was upregulated in the LP of gluten-fed DQ8-Dd-villin-IL-15tg mice (Fig. 1E).
Figure 1. DQ8-Dd-villin-IL-15tg mice: a gluten-dependent model of CeD with villous atrophy.
(A-G) DQ8-Dd-villin-IL-15tg mice were maintained on a GFD (sham), fed with gluten for 60 days (gluten), or fed with gluten for 30 days and then reverted to a GFD (gluten→GFD) for 30 days.
(A) Experimental timeline.
(B) Hematoxylin and eosin (H&E) staining of paraffin-embedded ileum sections. Scale bar, 200 μm. The graph depicts the ratio of the morphometric assessment of villous height to crypt depth. (sham, n=9; gluten, n=13; gluten→GFD, n=11 mice, four independent experiments). ANOVA) / Tukey’s multiple comparison; mean.
(C) Serum anti-deamidated gliadin peptide (DGP) IgG levels were measured by ELISA. Sera were collected sequentially from four independent experiments in the same mice (n=12) before gluten feeding (untreated), thirty days after gluten feeding (gluten d30), and thirty days after reversion to a GFD (GFD d60). The black line represents the average mean ± s.e.m.. Paired, two-tailed, t-test.
(D) Serum anti-gliadin IgG2c levels measured as in (C) (n=12 mice per group, four independent experiments). Paired, two-tailed, t-test.
(E) Expression of IFN-γ in the LP was measured by qPCR. Relative expression levels in gluten-fed (n=6) and gluten→GFD (n=6) mice were normalized against the expression levels observed in sham-fed DQ8-Dd-villin-IL-15tg mice. Two independent experiments; Unpaired, two-tailed, t-test.
(F, G) Expression of Rae1 (gluten, n=5; gluten→GFD, n=7) (F) and Qa-1 (gluten, n=7; gluten→GFD, n=7) (G) in the intestinal epithelium measured by qPCR as in (E). Two independent experiments; mean ± s.e.m; Unpaired, two-tailed, t-test.
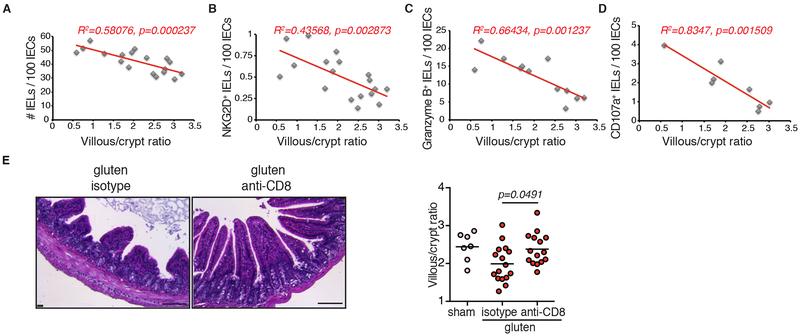
Studies in humans suggest that expansion of IELs expressing activating NK receptors NKG2D and NKG2C/CD94 in the absence of inhibitory NKG2A/CD9416,17 mediate cytolysis of IECs. IECs destruction is facilitated via the recognition of non-classical MHC molecules MICA/B and HLA-E, which are induced upon stress and are the main ligands for NKG2D and CD94/NKG2C, respectively16-18. In accordance with the selective development of VA in gluten-fed mice overexpressing IL-15 both in the LP and IECs, analysis of IELs revealed that only DQ8-Dd-villin-IL-15tg mice displayed expansion of degranulating IE-CTLs with a fully activated killer phenotype, as assessed by activating NK receptors, granzyme B and perforin expression (Extended Data Fig. 3E-J). Acquisition of cytotoxic features by IELs was gluten-dependent (Extended Data Fig. 4F-L) and accompanied by the upregulation of Rae-1, the mouse ligand for NKG2D (Fig. 1F, Extended Data Fig. 1F and Fig. 3K) and Qa-1, the mouse ligand for CD94/NKG2 receptors (Fig. 1G and Extended Data Fig. 1G) in the epithelium. Finally, supporting the notion that IE-CTLs are the key effector cells mediating tissue destruction in CeD, the number of IE-CTLs with cytolytic functions was correlated with the development of VA (Fig. 2A-D), and depletion of CD8+ IE-CTLs in gluten-fed DQ8-Dd-villin-IL-15tg mice was associated with a conservation of intestinal morphology (Fig. 2E and Extended Data Fig. 5). Taken together, these data demonstrate that IL-15 overexpression in IECs and in the LP need to synergize to activate IE-CTLs. These findings provide a mechanistic basis as to why potential CeD patients with adaptive anti-gluten immunity and family members with IL-15 overexpression in IECs lack IE-CTLs with a fully activated phenotype and do not develop VA. Despite the high prevalence of HLA-DQ8 in the general population (up to 40% in certain populations), only 1% of individuals develop CeD1. In agreement with such observations, HLA-DQ8 transgenic mice failed to acquire IE-CTLs with a fully activated killer phenotype (Extended Data Fig. 3E-J) and hence to develop VA (Extended Data Fig. 3A) upon gluten feeding.
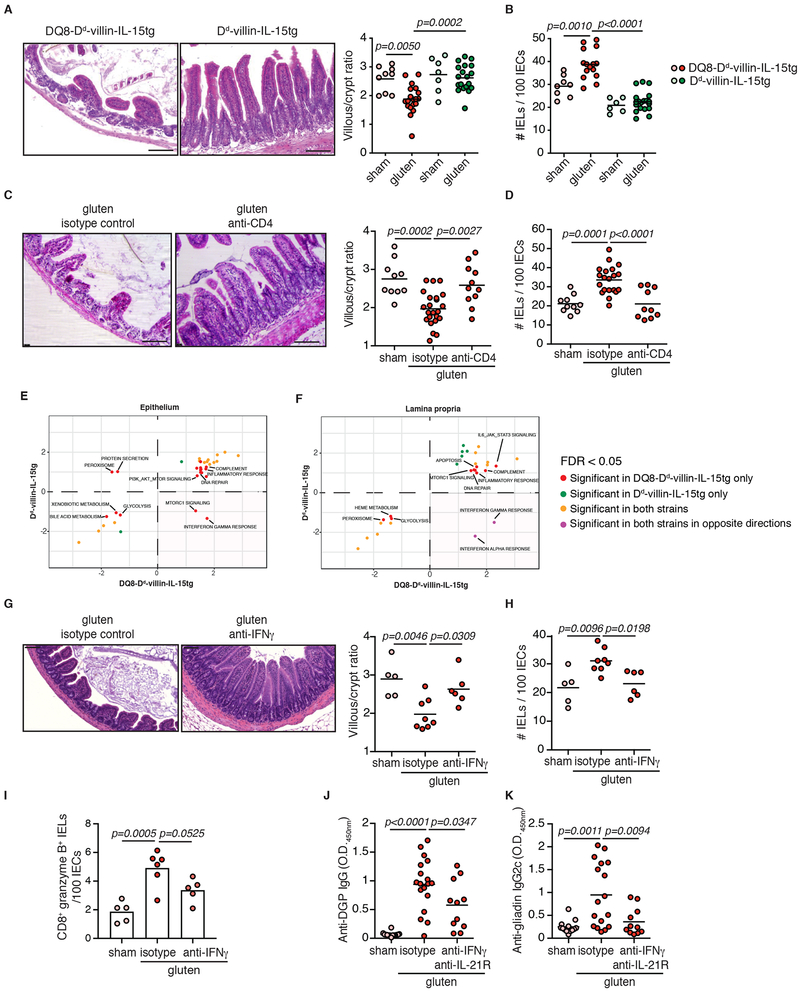
Figure 3. HLA-DQ8, CD4+ T cells and IFN-γ are required for tissue destruction.
(A-B) DQ8-Dd-villin-IL-15tg and Dd-villin-IL-15tg mice were maintained on a GFD (sham) or fed with gluten for 30 days (gluten).
(A) H&E staining of paraffin-embedded ileum sections of gluten-fed mice. Scale bar, 100 μm. The graph depicts the villous to crypt ratio. Six independent experiments (DQ8-Dd-villin-IL-15tg, sham n=9, gluten n=19; Dd-villin-IL-15tg, sham n=7, gluten n=19); mean; ANOVA / Tukey’s multiple comparison.
(B) Quantification of IELs among IECs. Six independent experiments (DQ8-Dd-villin-IL-15tg, sham n=8, gluten n=15; Dd-villin-IL-15tg, sham n=6, gluten n=19); mean; ANOVA / Tukey’s multiple comparison.
(C-D) DQ8-Dd-villin-IL-15tg mice were maintained on a GFD (sham), fed with gluten for 30 days (gluten), or fed with gluten and concurrently treated with an anti-CD4 antibody (treatment regimen and efficacy summarized in Extended Data Figure 7).
(C) H&E staining of ileum sections. Scale bar, 100 μm. The graph depicts the villous to crypt ratio. Six independent experiments (sham, n=10; gluten n=23; gluten + anti-CD4, n=11); mean; ANOVA) / Tukey’s multiple comparison.
(D) Quantification of IELs among IECs. Six independent experiments (sham, n=10; gluten n=20; gluten + anti-CD4, n=10); mean; ANOVA / Tukey’s multiple comparison.
(E-F) GSEA for gluten-responsive genes in DQ8-Dd-villin-IL-15tg and Dd-villin-IL-15tg mice. We contrast the enrichment scores for DQ8-Dd-villin-IL-15tg (x-axis) and Dd-villin-IL-15tg mice (y-axis) for all pathways enriched at an FDR <5% in at least of the strains, in the epithelium and the LP. Positive and negative scores represent enrichments among genes that are more highly or lowly expressed in gluten-fed animals, respectively. The bottom right quadrant refers to pathways, notably IFN-γ, that in response to gluten are up-regulated in DQ8-Dd-villin-IL-15tg but down-regulated in Dd-villin-IL-15tg mice. IFN-γ shows a reversed response to gluten when comparing DQ8-Dd-villin-IL-15tg against DQ8 mice (Extended Data Figure 8).
(G-K) DQ8-Dd-villin-IL-15tg mice were maintained on a GFD (sham), fed with gluten for 30 days and concurrently treated with anti-IFN-γ antibody, anti-IFN-γ and IL-21R antibodies together or isotype control.
(G) H&E staining of ileum sections. The graph depicts the villous to crypt ratio. Scale bar, 100 μm. Two independent experiments (sham, n=5, gluten n=8, gluten + anti-IFN-γ, n=6); mean; ANOVA / Tukey’s multiple comparison.
(H) Quantification of IELs among IECs. Two independent experiments (sham, n=5; gluten n=8; gluten + anti-IFN-γ, n=6); mean; ANOVA / Tukey’s multiple comparison.
(I) The intestinal epithelium was isolated and analyzed by flow cytometry. IELs were identified as TCRβ+ CD4− CD8+ cells. granzyme B+ IELs are indicated by absolute number / 100 IECs. Two independent experiments (sham, n=5, gluten + isotype, n=6, gluten + anti-IFN-γ, n= 5); mean; ANOVA / Tukey’s multiple comparison.
(J) Serum anti-DGP IgG levels were measured by ELISA thirty days after gluten feeding. Four independent experiments (sham, n=14; gluten n=18; gluten + anti-IFN-γ + anti-IL-21R, n=11); mean; ANOVA/ Tukey’s multiple comparison.
(K) Serum anti-gliadin IgG2c levels. Four independent experiments (sham, n=13; gluten n=17; gluten + anti-IFN-γ + anti-IL-21R, n=11); mean; ANOVA / Tukey’s multiple comparison.
Figure 2. Cytotoxic IELs are the key effector cells mediating tissue destruction.
(A-D) Correlations between the extent of villous atrophy determined by analysis of the villous/crypt ratio (Extended Data Fig. 1E) and (A) the number of IELs / 100 IECs (Extended Data Fig. 1D), (B) the number of IELs expressing NKG2D / 100 IECs (Extended Data Fig. 2B), (C) the number of IELs expressing granzyme B / 100 IECs (Extended Data Fig. 2F), and (D) the amount of IELs expressing CD107a (Extended Data Fig. 2I) in sham and gluten-fed DQ8-Dd-villin-IL-15tg mice. Pearson’s correlation test.
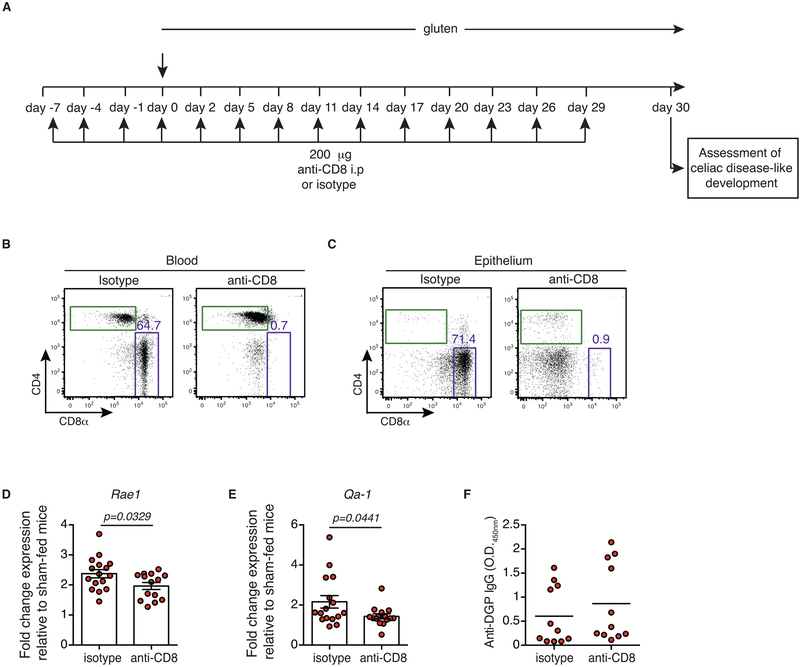
(E) H&E staining of ileum sections of DQ8-Dd-villin-IL-15tg mice fed with gluten for 30 days and concurrently treated with a CD8 depleting antibody or isotype control (treatment regimen and efficacy summarized in Extended Data Figure 5). Scale bar 100 μm. The graph depicts the villous to crypt ratio. Four independent experiments (sham, n=7; gluten n=16; gluten + anti-CD8, n=15); mean; One-way ANOVA / Tukey’s multiple comparison.
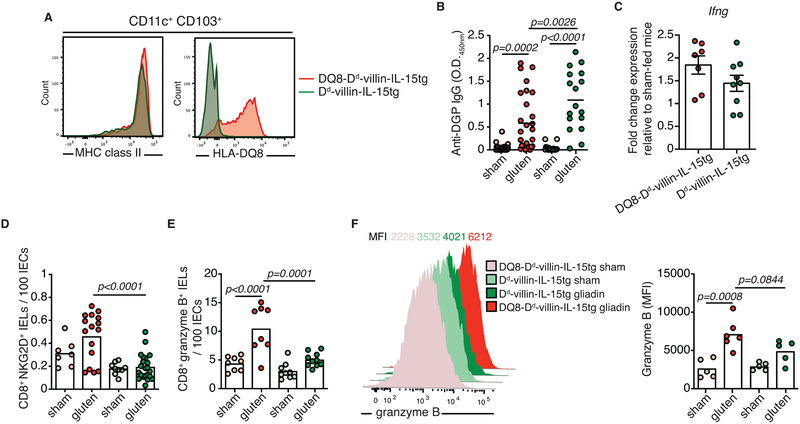
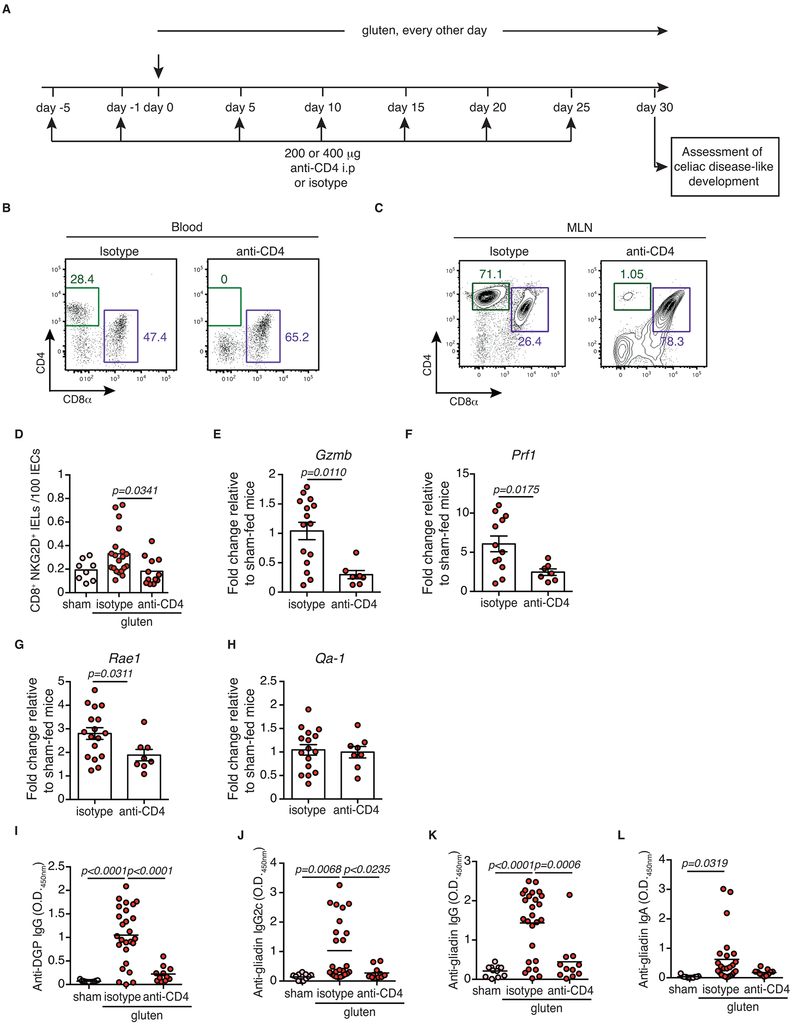
CeD is characterized by the presence of HLA-DQ2 or HLA-DQ8 restricted gluten-specific T cells producing IFN-γ and IL-21 in the LP4. An analysis of Dd-villin-IL-15tg mice lacking CeD-associated HLA molecules, but expressing I-Ab MHC class II molecules, revealed that HLA-DQ8 is not required for the development of the TH1 anti-gluten response (Extended Data Fig. 6A-C), even though it is critical for the development of VA (Fig. 3A). In line with the critical role of HLA-DQ8 in IEC destruction, gluten-fed DQ8-Dd-villin-IL-15tg mice in which CD4+ T cells were depleted also failed to develop VA (Fig. 3C). Analysis of IE-CTLs in mice lacking HLA-DQ8 or CD4+ T cells, suggested that HLA-DQ8 and CD4+ T cells are critical in promoting the licensing of IE-CTLs to kill IECs in DQ8-Dd-villin-IL-15tg mice fed with gluten (Fig. 3A-D, Extended Data Fig. 6D-F and Extended Data Fig. 7A-F). In addition, CD4+ T cell depletion suggested that CD4+ T cells were required for the generation of anti-DGP and anti-gliadin IgG2c antibodies (Extended Data Fig. 7I-L), and play a role in the upregulation of Rae-1 (Extended Data Fig. 7G) but not Qa-1 (Extended Data Fig. 7H). These findings uncover a potential mechanistic basis for the role of CD4+ T cells in the pathogenesis of CeD and why CeD only develops in HLA-DQ2 or HLA-DQ8 individuals.
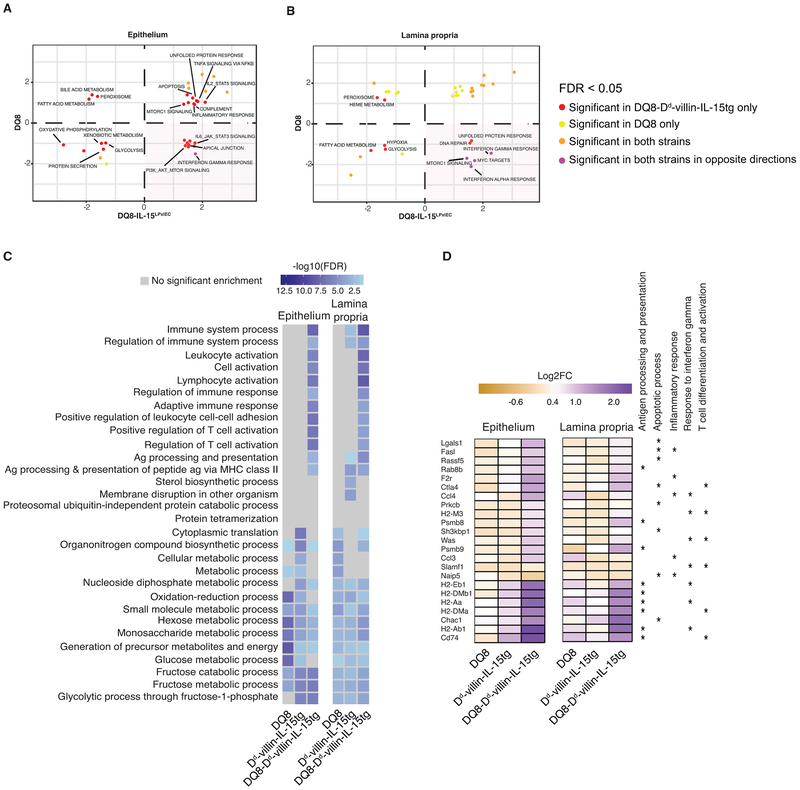
To further decipher the role of HLA-DQ8, we conducted a comparative transcriptional analysis of total cells isolated from the epithelium of gluten-fed DQ8, Dd-villin-IL-15tg, and DQ8-Dd-villin-IL-15tg mice. This analysis revealed that the interplay between HLA-DQ8, IL-15 and gluten was critical to enable transcriptional pathways in the epithelium and the LP downstream of IFN-γ (Fig. 3E, F and Extended Data Fig. 8A, B). Furthermore, a large number of pathways related to lymphocyte activation and antigen presentation were enriched in gluten-fed DQ8-Dd-villin-IL-15tg mice as compared to Dd-villin-IL-15tg or DQ8 mice in both the LP and the epithelium (Extended Data Fig. 8C, D, and Dataset 1 for the entire list of gene ontology terms enriched in all strains among genes responding to gluten challenge). The finding that HLA-DQ8 was critical for the IFN-γ response, combined with the observation that gluten-specific T cells in CeD patients produce IL-21 in addition to IFN-γ19, led us to evaluate the direct contribution of IFN-γ and IL-21 to CeD pathogenesis using neutralizing antibodies. Strikingly, IFN-γ (Fig. 3G, H), but not IL-21 (Extended Data Fig. 9A, B), was required for development of VA and expansion of IELs. In addition, IFN-γ alone (Fig. 3I) or in combination with IL-21 promotes the expansion of granzyme B+ IE-CTLs (Extended Data Fig. 9C-E). Finally, IFN-γ and IL-21 may play a cooperative role in the generation of anti-DGP and anti-gliadin IgG2c antibodies, as only concomitant neutralization of both cytokines significantly decreased the levels of these anti-gluten antibodies (Fig. 3J, K and Extended Data Fig. 9F-I). Taken together, our results demonstrate that IFN-γ is critical for the development of VA, and indicate that IL-15 in the LP plays a role in the induction of TH1 immunity, while HLA-D8 promotes and amplifies pathways downstream of IFN-γ.
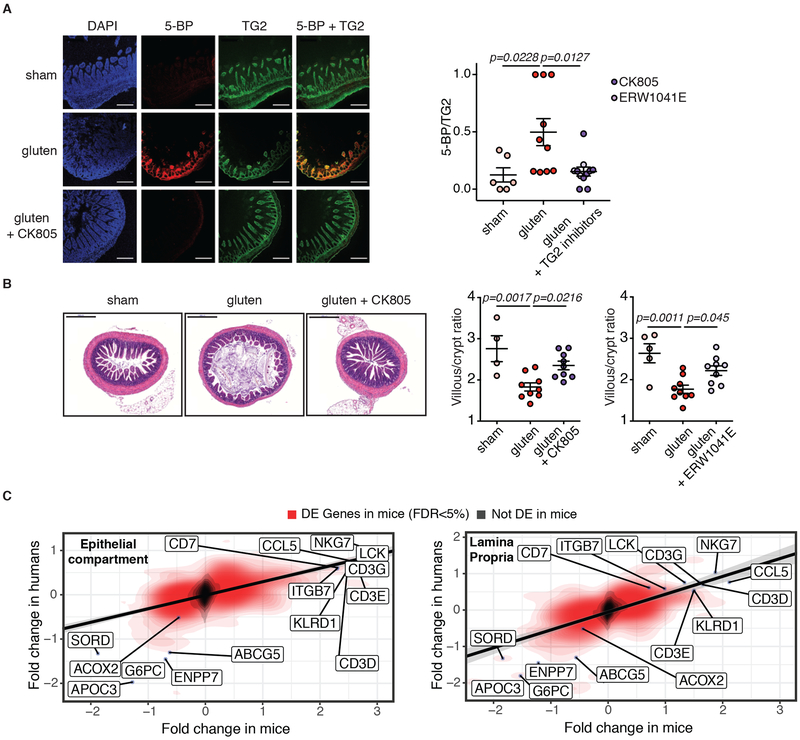
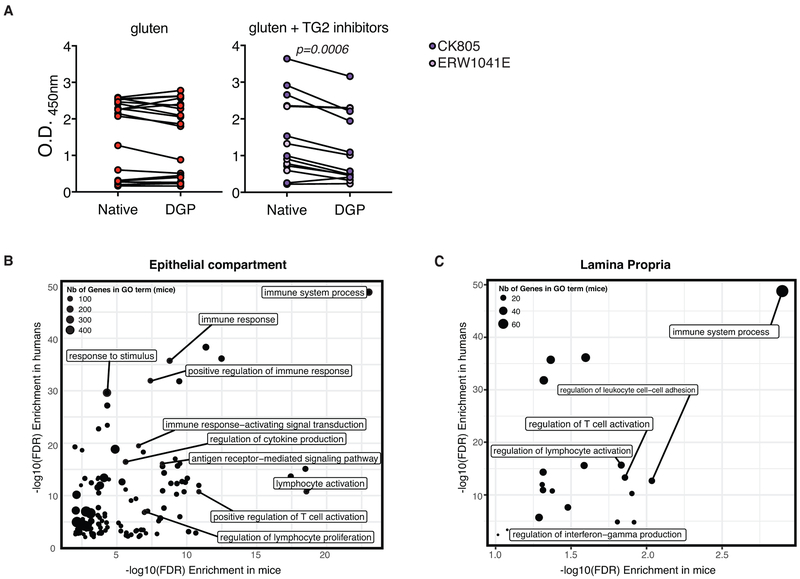
TG2 increases the affinity of gluten peptides for HLA-DQ2 and HLA-DQ8 by deamidating specific Gln residues in these peptides to Glu4,20,21. We first established that small intestinal TG2 is activated and that two different pharmacological inhibitors of TG2 (ERW1041E and CK805)22 were able to inhibit its activity in vivo, as assessed by a reduction in antibodies against DGP but not native gliadin peptides (Fig. 4A and Extended Data Fig. 10A). In line with the concept that TG2 plays a critical role in the pathogenesis of CeD by amplifying the anti-gluten T cell response in the context of HLA-DQ2 or HLA-DQ8 molecules, administration of two different TG2 inhibitors, ERW1041E and CK805, with dietary gluten prevented development of VA (Fig. 4B). Taken together, our findings suggest that TG2 constitutes a therapeutic target for the treatment of CeD and indicate that DQ8-Dd-villin-IL-15tg mice constitute a relevant animal model for drug development and discovery. Finally, the value and relevance of DQ8-Dd-villin-IL-15tg mice as a preclinical model for CeD was further supported by observations that differences in gene expression between gluten-fed DQ8 and DQ8-Dd-villin-IL-15tg mice were strongly correlated to the changes in gene expression observed between active CeD patients and healthy controls (Fig. 4C, p< 1×10⁻⁵ for both the epithelium and the LP). Furthermore, there was a strong concordance between the gene ontology terms enriched among genes induced by gluten challenge in DQ8-Dd-villin-IL-15tg mice and genes that were differentially expressed between active CeD patients and healthy controls (Extended Data Fig. 10B, C).
Figure 4. DQ8-Dd-villin-IL-15tg mice represent a preclinical model for coeliac disease.
(A-C) DQ8-Dd-villin-IL-15tg mice were maintained on a GFD (sham), fed with gluten for 30 days (gluten), or fed with gluten with concurrent administration of transglutaminase 2 (TG2) inhibitors ERW1041E or CK805 intraperitonially twice daily (25 mg/kg) for 30 days (gluten + TG2 inhibitors).
(A) TG2 protein (green) and TG2 enzymatic activity (red, as assessed by 5-biotinamido pentylamine (5-BP) crosslinking), were distinguished by IHC staining of frozen ileum sections. Scale bar, 200 μm. The graph depicts a semiquantitative analysis of the intensity of TG2 activity (5-BP) staining relative to the intensity of total TG2 protein, with each point representing the relative TG2 activity of an individual mouse. Three independent experiments (sham, n=6; gluten n=10; gluten + TG2 inhibitors n=11); mean ± s.e.m ; ANOVA / Tukey’s multiple comparison.
(B) H&E staining of paraffin-embedded ileum sections. Scale bar, 200μm. The graphs show the means of the villous to crypt ratio for two independent experiments (sham, n=4; gluten n=9; gluten + CK805 n=9, left panel) and (sham, n=5; gluten n=9; gluten + ERW1041E n=9, right panel).One-way ANOVA / Tukey’s multiple comparison.
(C) Transcriptional comparison of the intestinal epithelium and LP of gluten-fed DQ8-Dd-villin-IL-15tg mice and whole biopsies of active CeD patients. The figure shows the correlation between the log2 fold-changes in gene expression between gluten-fed DQ8 and DQ8-Dd-villin-IL-15tg mice (x-axis) in the epithelial compartment that encompass IELs and IECs (left panel) and the LP (right panel) and the log2 fold-changes in gene expression observed between active CeD patients (n=51) and healthy controls (n=45) (y-axis). The red density gradient shows the correlation among genes that are differentially expressed in gluten-fed DQ8-Dd-villin-IL-15tg mice.
Discussion:
Our study presents the first pathophysiological animal model of CeD in which the ingestion of gluten in an immunocompetent host is enough to promote small intestinal VA in a gluten- and HLA-DQ8- dependent manner – the same features seen in active CeD patients.
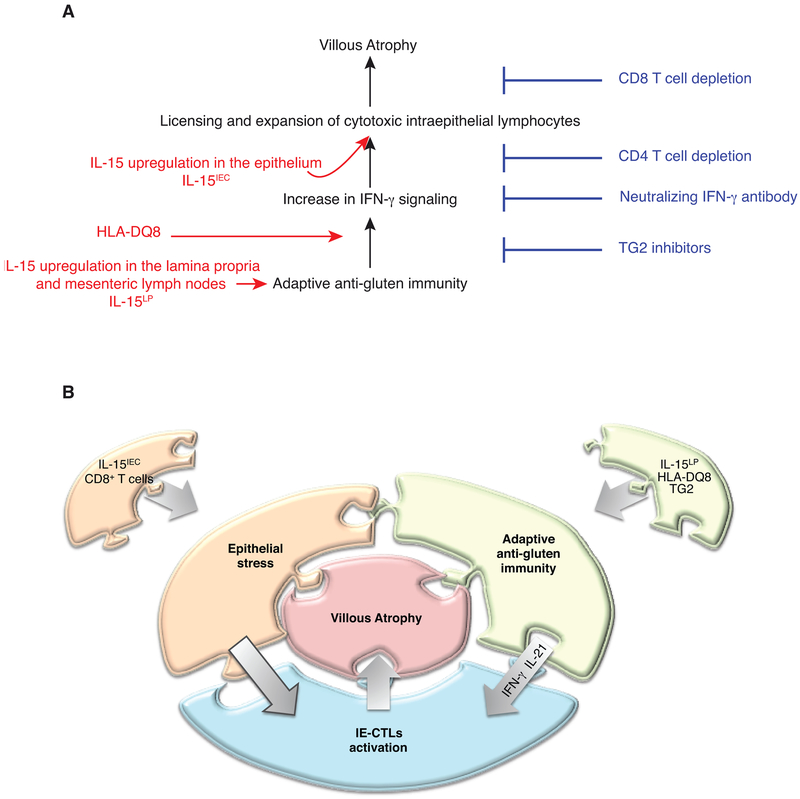
Complex immune disorders like CeD do not develop from the functional defect of a single gene, but rather from the cumulative effect of small changes in gene expression across many immune-relevant genes. Our study suggests that IL-15, HLA-DQ8, TG2, CD4+ T cells, IE-CTLs and gluten cooperatively regulate CeD immunopathology to promote VA by up-regulating the IFN-γ response and promoting the expansion of IE-CTLs with a fully activated cytolytic phenotype (Extended Data Fig. 11). The absence of critical checkpoints in previous mouse models using either lymphopenic mice lacking regulatory T cells23 or T cell receptor transgenic mice with a high frequency of dietary-antigen specific T cells12, may explain why VA developed in these mice in absence of the CeD-predisposing HLA molecules DQ2 or DQ8. Taken together, our findings underline how CeD develops as the result of a complex interplay between multiple innate and adaptive immune pathways that culminates in tissue destruction, and provide a mechanistic basis for the wide spectrum of clinical presentation of CeD5. The DQ8-Dd-villin-IL-15tg mouse model, by recapitulating key immunological and transcriptional aspects and requirements of CeD, hence offers a unique opportunity for preclinical validation of novel therapeutic strategies.
Methods
Mice
Mice used in these studies are on the C57BL/6 background. Mice were maintained under specific pathogen-free conditions at the University of Chicago and at the Sainte-Justine University Hospital Research Center. Importantly, no differences in the outcome of the experiments were observed between the two institutions, enabling pooling of the data. HLA-DQ8 transgenic mice (DQ8) and Dd-IL-15tg mice expressing IL-15 under the minimal MHC class I Dd promoter (DQ8- Dd-IL-15tg in the present study) were previously described13. Of note, Dd-IL-15tg mice express IL-15 in all compartments, and in particular in the LP and mesenteric lymph nodes, but not in the epithelium. Villin-IL-15tg mice expressing IL-15 under the intestine-specific 9Kb villin promoter of IECs24,25 were crossed to HLA-DQ8 mice (DQ8-villin-IL-15tg mice in the present study). Dd-IL-15tg mice were then crossed onto DQ8-villin-IL-15tg mice to obtain the first generation DQ8-Dd-villin-IL-15tg mice. Next generations were obtained by backcrossing DQ8-Dd-villin-IL-15tg mice with DQ8-villin-IL-15tgmice. Finally, DQ8-Dd-villin-IL-15tg mice were crossed to Dd-IL-15tg or villin-IL-15tg mice to obtain Dd-villin-IL-15tg mice. All mice expressing HLA-DQ8 also express I-Ab MHC class II molecules. All strains were maintained on a gluten-free chow (AIN76A, Envigo). For all experiments, mice were used at 10 weeks of age. All experiments were performed in accordance with the Institutional Biosafety Committee and the Institutional Care and Use Committee of the University of Chicago, and with the Canadian Council on Animal Care guidelines and the Institutional Committee for Animal Care in Research of the Sainte-Justine University Hospital Research Center.
Antibodies and flow cytometry
The following conjugated antibodies were purchased from eBioscience: TCRβ APC (H57–597), CD8α APC-eFluor 780 (53–6.7), CD8β PE-Cy5 (eBioH35-17.2), CD314 (NKG2D) PE (CX5), NKG2AB6 PE (16a11), CD94 FITC (18d3), CD11c PE (N418). The following antibodies were purchased from BD Biosciences: CD4 PE-Cy7 (GK1.5), CD4 BV711 (GK1.5), CD103 APC (M290), NKG2A/C/E FITC (20d5), CD3ε FITC (17A2), CD3ε BUV737 (17A2), IgA FITC (C10–3), CD16/CD32 (Fc Block) (2.4G2), CD107a FITC (1D4B). HLA-DQ8 PE (HLADQ81), CD11c BV421 (N418), CD3ε PE/Cy7 (145-2c11), Ep-CAM PerCP/Cy5.5 (G8.8), F4/80(BM8), NK1.1(PK136) and CD45 Pacific Blue (30-F11) were purchased from Biolegend. Rae1ε AF647 (FAB1135R) was purchased from R&D Systems. Granzyme B PE (GB12), I-Ab FITC (M5/114.15.2), CD8α APC-eFluor 780 (53–6.70), B220 PE-Cyanine7 (RA3–6B2) and LIVE/DEAD™ Fixable Violet Dead Cell Stain Kit were purchased from Thermo Fisher Scientific.
For CD107a detection, 2×10⁵ cells in 100 μl of culture medium were cultured in a 96-well round-bottom cell for 3.5 hours at 37°C with 100 μl of a working solution containing PMA (20 ng/ml), ionomycin (200 ng/ml), and Golgi Stop, and with 10 μl of CD107a (0.1 μg). Following incubation, the plate was centrifuged at 400xg for 5min and cells were stained with additional antibodies. Flow cytometry was performed with a BD LSRFortessa II cell analyzer (BD Biosciences) or BD FACSCanto II cell analyzer (BD Biosciences), and data were analyzed using FlowJo software (Treestar).
Epithelial, lamina propria, and mesenteric lymph node cell isolation
Epithelial cells including IELs and LP cells were isolated as previously described26 using EDTA containing calcium-free media and collagenase VIII, respectively. For the analysis of the NK receptors by flow cytometry, cytotoxic molecules on IELs by flow cytometry and qPCR, and for the analysis of IFN-γ on LP cells, a cell purification step using 40% Percoll (GE Healthcare) was used to enrich lymphocyte cell populations. Briefly, PBS-washed epithelial and LP cells were resuspended in 10ml 40% Percoll solution then centrifuged for 30 minutes at 3000 x g. After removal of the supernatant, cells were washed in PBS and counted. Mesenteric lymph nodes were dissected, made into a single cell suspension by mechanical disruption and passed through a 70μm nylon cell strainer (Corning).
Gluten feeding and depletions
To study the response to dietary gluten, mice were transferred from a GFD to a standard rodent chow at the beginning of each experiment and allowed to consume the gluten-containing chow ad libitum. Additionally, supplemental gluten (20mg crude gliadin (Sigma-Aldrich) or 100μg peptic-tryptic digests of gliadin) was administered via intragastric gavage, every other day for thirty or sixty days, using a 22-gauge round-tipped needle (Cadence Science) except for Extended Data Fig. 3B, where mice only consumed standard rodent chow. To study the impact of reversion to a GFD, mice were fed with gluten for thirty days, then placed on a GFD until the end of the experiment.
In some experiments, DQ8-Dd-villin-IL-15tg mice were injected i.p. before initiation of gluten feeding and every 4–5 days at the time of feeding and continuing until termination with 200μg or 400μg of anti-CD4 (GK1.5, rat IgG2b), or 200μg anti-CD8α (2.43.1, rat IgG2b) or corresponding isotype controls obtained from the Fitch Monoclonal Antibody Core Facility at the University of Chicago or purchased from BioXCell. In some experiments, DQ8-Dd-villin-IL-15tg mice were injected i.p. once before initiation of gluten feeding and every 3 days over the course of feeding with 500μg of IFNγ blocking antibody (XMG1.2) and/or an IL-21R blocking antibody (4A9) or corresponding isotype controls purchased from BioXCell.
Preparation of chymotrypsin-digested gliadin (CT-gliadin), peptic-tryptic digests of gliadin (PT-gliadin) and deamidated gliadin peptides (DGP)
CT-gliadin was prepared following a previously described protocol27. To obtain DGP, CT-gliadin was dissolved in Tris-buffered saline (TBS) containing 10mM CaCl2 and guinea pig liver transglutaminase (Zedira) and incubated for 2 hours at 37°C with continuous shaking. The concentration of DGP was calculated based on the concentration of the CT-glia and the volume added during deamidation. Alternatively, in experiments to measure the effects of TG2 inhibition on anti-native gliadin and anti-DGP responses, CT-gliadin preparations were first dialyzed against 5 mM sodium phosphate, pH = 7.4 using dialysis tubing with a molecular weight cutoff of 1 kDa and then lyophilized to dryness. To obtain DGP, murine TG2 produced recombinantly in E. coli was incubated with the CT-gliadin preparations in 100 mM MOPS buffer, pH = 7.4 containing 5 mM CaCl2 at a TG2:gliadin ratio of 1:50 (weight/weight) for 1 hour at 37°. TG2 was quenched by boiling for 10 minutes, and the digests were dialyzed against 5 mM sodium phosphate, pH = 7.4 and lyophilized as described above. DGP concentration was determined by BCA assay. To obtain PT-gliadin, gliadin was digested in 0.2 N HCl (pH 1.8) with pepsin (Sigma) for 2h at 37°C. Once the pH was adjusted to 8.0, the digest was incubated with purified trypsin for 4h at 37°C, and thereafter with Cotazym (lipase from porcine pancreas Type II, Sigma) for 2h under constant stirring. The concentration of PT-gliadin was determined using a BCA assay (Pierce).
Anti-TG2, anti-gluten and anti-DGP ELISA
Serum was harvested thirty or sixty days after mice received the first gliadin feeding. For anti-gluten IgG2c, IgG and IgA ELISA, high-binding ELISA 96-well plates (Nunc, Thermo-Scientific) were coated with 50 μl of 100 μg/ml CT-gliadin in 100 mM Na2HPO4 overnight at 4 °C. Plates were washed three times with PBS containing 0.05% Tween-20 (PBS-T) and blocked with 200 μl of 2% BSA in PBS-T for 2 hours at room temperature. Serum was assessed in duplicate and at two dilutions, typically 1/50 and 1/200. Sera were incubated overnight at 4 °C and plates were washed three times with PBS-T. Anti-mouse Ig-horseradish peroxidase (HRP) (Southern Biotech) in blocking buffer was added to plates and incubated for 1 hour at room temperature. Plates were washed five times with PBS-T. 50 μl HRP substrate TMB (Thermo-Scientific) was added and the reaction stopped by the addition of 50 μl 2N H2SO4 (Fluka Analytical). Absorbance was read at 450 nm on a Molecular Devices Versamax tunable microplate reader. For anti-DGP IgG ELISA, deamidated CT-gliadin was coated onto Immulon-2 HB ELISA plates (Thermo Scientific) at a concentration of 100 μg/ml in 0.1M Na2HPO4 (Sigma Aldrich) and incubated overnight at 4°C. Blocking buffer of 4% BSA/0.05% Tween-20 in PBS was used, and sera were diluted at 1/200 with a diluent of 0.1% BSA/0.05% Tween-20 in PBS. Biotinylated anti-mouse IgG and streptavidin-HRP (Both Jackson Immunoresearch) were used as the detection reagents. TMB (Sigma Aldrich) was used as the substrate and the reaction stopped by the addition of 50 μl 2N H2SO4 (Fluka Analytical). Plates were then read at 450nm. Levels of anti-DGP IgG and anti-gliadin IgG, IgG2c, IgA were expressed in OD values.
Histology
Hematoxylin & Eosin staining was performed on 5 μm thick sections of 10% formalin-fixed paraffin-embedded ileum. Slides were analyzed using a Leica DM 2500 microscope with a HC PLAN APO 20x/0.7 NA and a HCX PL APO 100x/1.40–0.70 objective or a Leica DMi8 microscope with a HC PL FLUOTAR L 20x/0.40 and a HC PL APO 40x/0.75 objective and equipped with the image processing and analysis software LasX (Leica). Analysis were performed blinded by two investigators. The villous height/crypt depth ratios were obtained from morphometric measurements of five well-oriented villi. The villous to crypt ratio was calculated by dividing the villous height by the corresponding crypt depth. Villous height was measured from the tip to the shoulder of the villous or up to the top of the crypt of Lieberkuhn. The crypt depth was measured as the distance from the top of the crypt of Lieberkuhn to the deepest level of the crypt. The intraepithelial lymphocyte count was assessed by counting the number of intraepithelial lymphocytes among at least 100 enterocytes. Additional 5μm sections were processed for immunohistochemical detection of Granzyme B. Slides were deparaffinized, rehydrated, and washed in PBS. Sections were incubated in citrate buffer (1 M pH 6.0) for 20 min at 68 °C. Then the sections were permeabilized with 0.3% Triton X-100 at room temperature for 30 min. Endogenous peroxidase activity was quenched for 15 minutes with 2% hydrogen peroxide in PBS. Sections were blocked with normal donkey serum (Vector Laboratories) for 1 h and incubated with polyclonal Goat IgG anti-mouse Granzyme B (R&D Systems) for 2 hours at room temperature. Sections were then washed in PBS, incubated with biotinylated anti-goat IgG (Vector Laboratories) for 1 hour at room temperature, and stained using the avidin-biotin complex method (Vectastain ABC kit; Vector Laboratories). Color was developed using 3,3’-diaminobenzidine (Dako Diagnostics) containing hydrogen peroxide. Slides were counterstained with Harris modified hematoxylin, dehydrated, cleared, mounted, and examined under light microscopy as described above.
Immunohistochemistry
Mice were euthanized and intestines were resected. Distal ileum pieces were snap-frozen in optimum cutting temperature (OCT) compound (Tissue-Tek) submerged in isopentane cooled with liquid nitrogen. Frozen tissues were cryosectioned (5 μm thickness) and sections were fixed for 10 min in acetone. Slides were sequentially rehydrated for 10 minutes in PBS, treated for 30 min at room temperature with PBS containing 3% bovine serum albumin (BSA), and incubated for 1 hour at room temperature with Alexa Fluor 594 anti-mouse CD3 (17A2, rat IgG2b, Biolegend), purified anti-mouse CD138 (281–2, rat IgG2a, BD Biosciences), anti-mouse IgA-biotin (goat IgG, Southern Biotech), or anti-transglutaminase 2 (rabbit polyclonal, produced by Pacific Immunology as described before3) diluted in PBS containing 1% BSA. After three washes in PBS, slides were then incubated for 1 hour at room temperature with secondary antibody goat anti-rat IgG Alexa Fluor 488, goat anti-rat IgG Alexa Fluor 633, Alexa Fluor 594 streptavidin, or goat anti-rabbit Alexa Fluor 488 (Molecular Probes). For IgA staining, slides were blocked for 1 h at room temperature in Tris-buffered saline (TBS) containing 0.05% Tween-20 (TBS-T) and 3% BSA, and the antibodies were diluted in TBS-T containing 1% BSA. After three washes in PBS, slides were mounted with Fluoromount-G containing DAPI (Southern Biotech).
Plasma cells were quantified on stained frozen sections by counting the number of CD138+ cells in the small intestinal LP. The small intestinal LP was demarcated by the presence of TG2 protein staining3,27, and the number of plasma cells was normalized to the total area measured on a per mouse basis. Counting was performed on at least 5 villi per mouse
Quantification of IELs with cytotoxic properties
To perform our cytotoxic IELs determinations. By flow cytometry we have identified IELs with CD45 staining that encompasses all the lymphocyte subsets (excluding the epithelial cells). We next determined the amount of TCRαβ+ among CD45+ cells, and the amount of CD8+ T cells expressing NKG2D among TCR αβ + cells. Hence the flow cytometry analysis allows us to obtain the frequency of CD8+ NKG2D+ TCR αβ + cells among CD45+ IELs. On Hematoxylin & Eosin stained slides, we have determined the total amount of IELs per 100 IECs. Hence we performed the following calculation to approximate the absolute numbers of CD8+ NKG2D+ IELs/100 IECs: (% CD8+ NKG2D+ TCR αβ + * # IELs/100 IECs)/100.
Visualization and Quantification of TG2 Protein and Activity
5-biotinamidopentylamine (5-BP), a biotinylated TG2 substrate, was synthesized and characterized as reported28. 5-BP was dissolved in PBS, and was administered intraperitoneally (100 mg/kg, 2 doses) 3 and 6 hours prior to sacrifice, and TG2 protein and activity were quantified via immunohistochemistry according to established protocols3,27. The 5-BP/TG2 ratio was determined by averaging signals form at least three images per mouse. To facilitate comparison of data from the three independent experiments, the image with the maximum 5-BP/TG2 ratio from each experiment was assigned a value of one, whereas the image with the minimum 5-BP/TG2 ratio was assigned a value of zero. Values between these ratios were scaled linearly using the minimum-maximum normalization tool in GraphPad Prism 8.0.
TG2 Inhibition
CK805 and ERW1041E were synthesized and characterized by previously published routes22. CK805 was formulated in 40% PBS, 40% PEG-4000, and 20% DMSO, and ERW1041E was formulated in 2.5% (2-hydroxypropyl)-β-cyclodextrin, 2.0% Tween-80, 10% DMSO, and PBS, as described previously3. An initial dose of inhibitor (25 mg/kg, i.p.) was administered 12 hours prior to initiation of gluten feeding, and then every 12 hours during the course of the 30-day gluten feeding.
RNA extraction, cDNA synthesis, and quantitative real-time PCR
Total RNA isolation was performed on epithelial and LP cells using the RNeasy Mini Kit (Qiagen). RNA concentration and quality were determined by UV spectrophotometry (Epoch Microplate Spectrophotometer, BioTek). cDNA synthesis was performed using qScript cDNA SuperMix (QuantaBio) according to the manufacturer’s instructions. Expression analysis was performed in technical duplicate via quantitative real-time PCR on an Applied Biosystems® StepOne™ Real-Time PCR Systems (Applied Biosystems) with a Power SYBR Green Master Mix (Thermo Fisher Scientific). Expression levels were quantified and normalized to Gapdh expression using the following murine primer pairs:
Gapdh: 5′-AGGTCGGTGTGAACGGATTTG-3′, 5′-TGTAGACCATGTAGTTGAGGTCA-3′ Ifng:5′-ATGAACGCTACACACTGCATC-3′, 3′-TCTAGGCTTTCAATGACTGTGC-5′
Qa1: 5′- AACACACGGAGAGTCAAGGG-3‱, 3′-ATCAAGGCCATCATAGGCGAA-5′.
Expression analysis for murine GzmB, Prf1 and Rae1 was performed with TaqMan gene expression assays and normalized to Gapdh (Thermo Fisher Scientific). Relative gene expression levels were determined using the delta–delta Ct method to calculate the relative changes in gene expression relative to sham-fed mice.
Gene expression microarray
RNA from mouse samples was obtained as described above, quantified spectrophotometrically, and the quality was assessed with the Agilent 2100 Bioanalyzer (Agilent Technologies). Only samples with no evidence for RNA degradation (RNA integrity number >8) were kept for further experiments. Genome-wide gene expression profiling of the epithelium and LP of five individual DQ8, DQ8-Dd-villin-IL-15tg, and Dd-villin-IL-15tg mice were determined by using the MouseWG-6 v2.0 Expression BeadChips from Illumina. Low-level microarray analyses were performed in R, using the Bioconductor software package lumi29. We first applied a variance stabilizing transformation to all arrays30 and then quantile normalized the data. After normalization, we removed probes with intensities indistinguishable from background noise (as measured by the negative controls present on each array).
Identifying genes differentially expressed between mouse strains
To identify genes differently expressed between the different strains of mice, we used a linear modeling-based approach. Specifically, we used the Bioconductor limma package31 to fit, for each gene, a linear model with individual treatment (i.e., gluten feeding), and mice strains as fixed effects. For each gene, we subsequently used the empirical Bayes approach of Smyth31 to calculate a moderated t statistic and P value. We corrected for multiple testing using the false discovery rate (FDR) approach of Benjamini and Hochberg32.
Patients
One duodenal biopsy was obtained from ninety-six individuals undergoing upper gastrointestinal endoscopy during diagnostic work-up at the University of Chicago Medicine and at Mayo Clinic, including forty-five non-coeliac controls and fifty-one untreated CeD patients (active CeD) for subsequent RNA-sequencing. Control subjects included 29 females and 16 males and underwent upper gastrointestinal endoscopy during a diagnostic work-up for anemia, failure to thrive or other intestinal disorders not associated with CeD. All controls had normal small intestinal histology, no family history of CeD, and no significant levels of anti-TG2 IgA antibodies in the serum. Active CeD patients included 31 females and 20 males; all had positive anti-TG2 antibodies and small intestinal enteropathy with increased infiltration of IELs, crypts hyperplasia and villous atrophy, according to currently accepted diagnostic guidelines5. Each subject signed an informed consent as provided by the Institutional Review Board of each institution (IRB-12623B for the University of Chicago and IRB-1491–03 for Mayo Clinic).
RNA-sequencing on gut biopsies from control and coeliac disease patients
A single duodenal biopsy fragment was directly submerged in RNA-later (QIAGEN), kept at 4°C for 24 hours and then frozen at −80°C upon RNA later removal until processing. Defrosted tissues were homogenized using magnetic beads and a Cell Tissue Homogenizer (Bullet Blender by Next Advance) and RNA was extracted using RNeasy columns (QIAGEN). RNA integrity was assessed by Bioanalyzer (Agilent). All included samples showed an RNA integrity number (RIN) above 8. RNA-sequencing libraries were prepared using the SMARTer® Stranded Total RNA Sample Prep Kit-HI Mammalian by Clontech Laboratories (Takara), according to manufacturer’s instructions. Library quality was checked by Bioanalyzer (Agilent) prior to pooling and sequencing. Indexed cDNA libraries were pooled in equimolar amounts and sequenced with single-end 50bp reads with a high output Flow Cell (8 lane flow cell) on an Illumina HiSeq4000 at the University of Chicago Genomic Facility.
Adaptor sequences and low-quality score bases (Phred score < 20) were first trimmed using Trim Galore (version 0.2.7). The resulting reads were then mapped to the human genome reference sequence (Ensembl GRCh37 release 75) using Kallisto v0.43.033 with a GRch38 transcript annotation GTF file downloaded from Ensembl rel 87. Gene expression was normalized across samples using the weighted trimmed mean of M-values algorithm (TMM), as implemented in the R package edgeR34. After normalization, we log-transformed the data using the voom function in the limma package35. For all downstream analyses, we excluded non-coding and lowly expressed genes with a median read count lower than 20 in all samples. Following this pre-processing of the data, we fitted the log-transformed expression estimates to linear models using the lmFit function from the limma package35 to look at differences in gene expression between control and coeliac disease patients, while considering variation in sex and age of the donors. Gene ontology enrichment analysis were performed in Gorilla36. We corrected for multiple testing using the FDR approach of Benjamini and Hochberg32.
Gene set enrichment analyses
Gene set enrichment analyses (GSEA) was ran using the javaGSEA Desktop application by the Broad Institute (http://software.broadinstitute.org/gsea/index.jspversion3.0) against the “Hallmark gene sets” from the Molecular Signatures Database collection. The GSEA pre-rank mode was used ranking genes according to t statistics for differences in gene expression between sham- and gluten-fed mice (for all three strains separately). The t statistics captures both the significance level and the direction of the effects: large positive and negative values refer to genes showing a significantly higher or low expression in gluten-fed animals as compared to sham-fed, respectively. The complete results of these analyses are shown in Dataset 2.
Statistical Analysis.
Tests were performed as indicated in figure legends using GraphPad Prism. Data are presented as mean ± SEM. The statistical test used, and p values are indicated in each figure legend. P values of < 0.05 were considered to be statistically significant. *P < 0.05, **P < 0.01, ***P < 0.001 and ****P < 0.0001.
Extended Data
Extended Data Figure 1. Development of villous atrophy requires IL-15 expression in both the lamina propria and epithelium.
(A-G) DQ8-Dd-IL-15tg, DQ8-villin-IL-15tg, and DQ8-Dd-villin-IL-15tg mice that were raised on a GFD were maintained on a GFD (sham) or fed with gluten for 30 days (gluten).
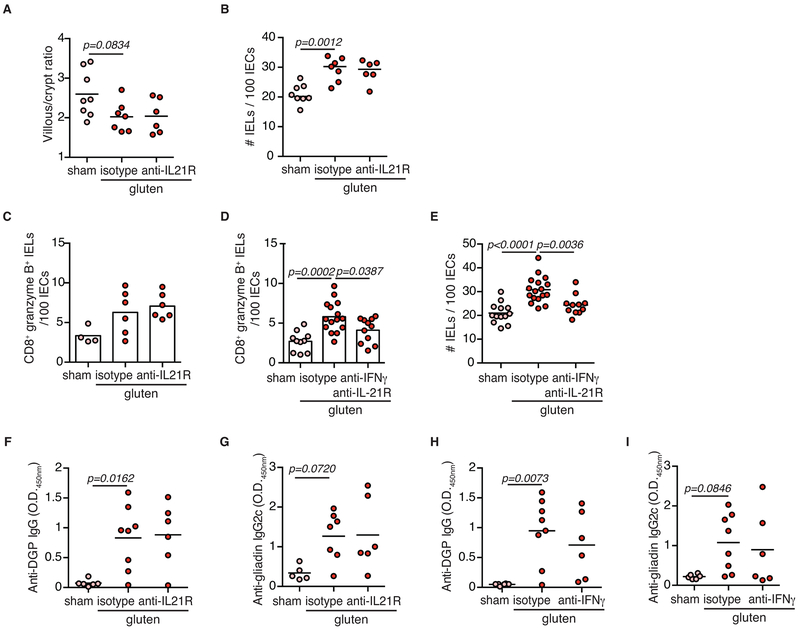
(A) Expression of Ifng in the LP was measured by qPCR. Data are representative of three independent experiments shown as mean ± s.e.m (DQ8-Dd-IL-15tg sham, n=7, gluten n=16; DQ8-villin-IL-15tg sham, n=13, gluten n=12). One-way analysis of variance (ANOVA) / Tukey’s multiple comparison.
(B) Serum anti-gliadin IgG2c levels were measured by ELISA thirty days after gluten feeding. Three independent experiments shown (DQ8-Dd-IL-15tg sham, n=16, gluten n=16; DQ8-villin-IL-15tg sham, n=15, gluten n=15); mean; ANOVA / Tukey’s multiple comparison.
(C) Serum anti-deamidated gliadin peptides (DGP) IgG levels were measured by ELISA thirty days after gluten feeding. Three independent experiments (DQ8-Dd-IL-15tg sham, n=10, gluten n=10; DQ8-villin-IL-15tg sham, n=9, gluten n=9); mean; ANOVA / Tukey’s multiple comparison.
(D) Quantification of IELs among IECs was performed on H&E stained ileum sections. Four independent experiments (DQ8-Dd-IL-15tg sham, n=11, gluten n=12; DQ8-villin-IL-15tg sham, n=17, gluten n=16; DQ8-Dd-villin-IL-15tg sham, n=14, gluten n=17); mean; ANOVA / Tukey’s multiple comparison.
(E) H&E staining of paraffin-embedded ileum sections. The graph depicts the ratio of the morphometric assessment of villous height to crypt depth. Six independent experiments shown as mean (DQ8-Dd-IL-15tg sham, n=10, gluten n=10; DQ8-villin-IL-15tg sham, n=17, gluten n=19; DQ8-Dd-villin-IL-15tg sham, n=21, gluten n=28); ANOVA) / Tukey’s multiple comparison.
(F, G) Expression of (F) Rae1and (G) Qa-1 in the intestinal epithelium was measured by qPCR. Relative expression levels in sham and gluten-fed mice for each strain are shown. Data are representative of three (DQ8-Dd-IL-15tg sham, n=16, gluten n=16; DQ8-villin-IL-15tg sham, n=15, gluten n=15) or four (DQ8-Dd-villin-IL-15tg sham, n=20, gluten n=26) independent experiments shown as mean ± s.e.m.. Unpaired, two-tailed, t-test.
Extended Data Figure 2. Acquisition of cytotoxic properties by intraepithelial lymphocytes requires IL-15 expression in both the lamina propria and epithelium.
(A-J) DQ8-Dd-IL-15tg, DQ8-villin-IL-15tg, and DQ8-Dd-villin-IL-15tg mice were maintained on a GFD (sham) or fed with gluten for 30 days (gluten).
(A-I) The intestinal epithelium was isolated and analyzed by flow cytometry. A subset of IELs was identified as TCRβ+ CD4− CD8αβ+ cells. In parallel, total IELs were identified as TCRβ+ CD4− CD8+ cells by flow cytometry and quantified among IECs on H&E stained ileum sections.
(A) Percentage of NKG2D+ NKG2− CD8αβ+ IELs are indicated. Six independent experiments (DQ8-Dd-IL-15tg sham, n=11, gluten n=14; DQ8-villin-IL-15tg sham, n=20, gluten n=20; DQ8-Dd-villin-IL-15tg sham, n=17, gluten n=22); mean; ANOVA/ Tukey’s multiple comparison.
(B) Numbers of NKG2D+ NKG2− CD8+ IELs / 100 IECs. Six independent experiments (DQ8-Dd-IL-15tg sham, n=11, gluten n=13; DQ8-villin-IL-15tg sham, n=20, gluten n=20; DQ8-Dd-villin-IL-15tg sham, n=16, gluten n=19); mean; ANOVA / Tukey’s multiple comparison.
(C) Percentage of CD94+ NKG2A− CD8αβ+ IELs are indicated. Three independent experiments (DQ8-Dd-IL-15tg sham, n=10, gluten n=10; DQ8-villin-IL-15tg sham, n=11, gluten n=11; DQ8-Dd-villin-IL-15tg sham, n=9, gluten n=10); mean; ANOVA / Tukey’s multiple comparison.
(D) Numbers of CD94+NKG2A− CD8+ IELs / 100 IECs. Three independent experiments (DQ8-Dd-IL-15tg sham, n=10, gluten n=10; DQ8-villin-IL-15tg sham, n=11, gluten n=11; DQ8-Dd-villin-IL-15tg sham, n=9, gluten n=10); mean; ANOVA / Tukey’s multiple comparison.
(E) Intracellular granzyme B+ IELs are indicated by percentage. Data are representative of five independent experiments shown as mean (DQ8-Dd-IL-15tg sham, n=9, gluten n=10; DQ8-villin-IL-15tg sham, n=14, gluten n=13; DQ8-Dd-villin-IL-15tg sham, n=12, gluten n=18). ANOVA / Tukey’s multiple comparison.
(F) Numbers of granzyme B+ IELs / 100 IECs. Five independent experiments (DQ8-Dd-IL-15tg sham, n=11, gluten n=13; DQ8-villin-IL-15tg sham, n=20, gluten n=20; DQ8-Dd-villin-IL-15tg sham, n=16, gluten n=19); mean; ANOVA / Tukey’s multiple comparison.
(G) Intracellular granzyme B mean fluorescence intensity (MFI) was measured. Four independent experiments (DQ8-Dd-IL-15tg sham, n=9, gluten n=9; DQ8-villin-IL-15tg sham, n=14, gluten n=13; DQ8-Dd-villin-IL-15tg sham, n=10, gluten n=15); mean; ANOVA / Tukey’s multiple comparison.
(H) The percentages of CD8αβ+ CD107a+ IELs are indicated.
(I) Numbers of CD8+ CD107a+ IELs / 100 IECs are shown. Two independent experiments (DQ8-Dd-IL-15tg sham, n=7, gluten n=6; DQ8-Dd-villin-IL-15tg sham, n=8, gluten n=5; DQ8-Dd-villin-IL-15tg sham, n=5, gluten n=4). ANOVA / Tukey’s multiple comparison.
(J) Expression of Prf1 in the intestinal epithelium was measured by qPCR. Relative expression levels in sham and gluten-fed mice for each strain are shown (DQ8-Dd-IL-15tg sham, n=16, gluten n=16; DQ8-villin-IL-15tg sham, n=15, gluten n=15; DQ8-Dd-villin-IL-15tg sham, n=20, gluten n=26). Unpaired, two-tailed, t-test.
Extended Data Figure 3. Overexpression of IL-15 in HLA-humanized DQ8 mice confers susceptibility to development of coeliac disease-like features in a gluten-dependent manner.
(A-K) DQ8 and DQ8-Dd-villin-IL-15tg mice were maintained on a GFD (sham) or fed with gluten for 30 days (gluten).
(A) H&E staining of paraffin-embedded ileum sections. Scale bar, 100 μm. The graph depicts the ratio of the morphometric assessment of villous height to crypt depth. Four independent experiments shown (DQ8 sham, n=12, gluten n=13; DQ8-Dd-villin-IL-15tg sham, n=12, gluten n=15); mean; ANOVA / Tukey’s multiple comparison.
(B) Villous to crypt ratio from sham-fed DQ8-Dd-villin-IL-15tg mice and DQ8-Dd-villin-IL-15tg mice fed a standard rodent chow without supplemental gluten. Two independent experiments (sham, n=4, gluten n=8); mean; Unpaired, two-tailed, t-test.
(C) IgA (red) and CD138+ plasma cells (green) were distinguished by immunohistochemistry (IHC) staining of frozen ileum sections.
(D) Serum anti-deamidated gliadin peptides (DGP) IgG levels as measured by ELISA. Sera were collected thirty days after gluten feeding. Two independent experiments (DQ8 sham, n=6, gluten n=7; DQ8-Dd-villin-IL-15tg sham, n=6, gluten n=7); mean; ANOVA / Tukey’s multiple comparison.
(E) Quantification of IELs among IECs performed on H&E stained ileum sections. Four independent experiments (DQ8 sham, n=10, gluten n=16; DQ8-Dd-villin-IL-15tg sham, n=12, gluten n=14); mean; ANOVA / Tukey’s multiple comparison.
(F-J) The intestinal epithelium was isolated and analyzed by flow cytometry. IELs were identified as TCRβ+ CD4− CD8+ and TCRβ+ CD4− CD8αβ+ cells.
(F) Granzyme B+ IELs are indicated by percentage. Four independent experiments (DQ8 sham, n=13, gluten n=15; DQ8-Dd-villin-IL-15tg sham, n=11, gluten n=15); mean; ANOVA / Tukey’s multiple comparison.
(G) Numbers of granzyme B+ CD8+ IELs / 100 IECs. Four independent experiments (DQ8 sham, n=11, gluten n=14; DQ8-Dd-villin-IL-15tg sham, n=11, gluten n=13); mean; ANOVA / Tukey’s multiple comparison.
(H) Granzyme B MFI. Data are representative of three independent experiments shown as mean (DQ8 sham, n=11, gluten n=12; DQ8-Dd-villin-IL-15tg sham, n=9, gluten n=12). ANOVA / Tukey’s multiple comparison.
(I) NKG2D+ NKG2− IELs are indicated by percentage. Four independent experiments (DQ8 sham, n=13, gluten n=17; DQ8-Dd-villin-IL-15tg sham, n=11, gluten n=15); mean; ANOVA / Tukey’s multiple comparison.
(J) Numbers of NKG2D+ NKG2− IELs / 100 IECs. Four independent experiments (DQ8 sham, n=12, gluten n=16; DQ8-Dd-villin-IL-15tg sham, n=11, gluten n=13); mean; ANOVA / Tukey’s multiple comparison.
(K) The intestinal epithelium was isolated and analyzed by flow cytometry. Intestinal epithelial cells (IECs) were identified as EpCAM+ CD45− cells. Rae1ε+ IECs are indicated by percentage. Two independent experiments (n=5 mice per group); mean; ANOVA / Tukey’s multiple comparison.
Extended Data Figure 4. Gluten-free diet decreases the anti-gluten antibody response and the number of cytotoxic intraepithelial lymphocytes.
(A-H, K-L) DQ8-Dd-villin-IL-15tg\ mice that were raised on a gluten-free diet (GFD) were maintained on a GFD (denoted “sham”), fed with gluten for 30 days (“gluten”), or fed with gluten for 30 days and then reverted to a GFD (“gluten→GFD”) for 30 days.
(A) CD3ε+ T cells (red) and CD138+ plasma cells (green) were distinguished by immunohistochemistry (IHC) staining of frozen ileum sections. Scale bar, 50 μm. The graph depicts the number of CD138+ cells per section, normalized to lamina propria (LP) area. Three independent experiments (sham, n=8 mice; gluten, n=8 mice; gluten→GFD, n=9 mice); mean; ANOVA / Tukey’s multiple comparison.
(B, C) Serum anti-gliadin (C) IgG and (D) IgA levels were measured by ELISA. Sera were collected sequentially in the same mice before gluten feeding (untreated), thirty days after gluten feeding (gluten d30), and thirty days after reversion to a GFD (GFD d60). Data are representative of four independent experiments (n=12 or 13 mice per group for anti-gliadin IgG and IgA, respectively). The black line represents the average for each of the groups (mean ± s.e.m.). ANOVA) / Tukey’s multiple comparison.
(D) Mucosal IgA deposits (red) and transglutaminase 2 (TG2, green) were identified by immunohistochemistry (IHC) staining of frozen ileum sections.
(E) Serum anti-TG2 IgG antibody levels measured by ELISA thirty days after gluten feeding. Data are representative of four independent experiments shown as mean (n=13 mice per group).
(F) Quantification of intraepithelial lymphocytes (IELs) among intestinal epithelial cells (IECs) was performed on H&E stained ileum sections. Four independent experiments (sham, n=8 mice; gluten, n=12 mice; gluten→GFD, n=9 mice); mean; ANOVA / Tukey’s multiple comparison.
(G) Granzyme B staining by IHC on paraffin-embedded ileum sections. Scale bar, 20 μm. The graph depicts the average number of granzyme B+ IELs / 100 IECs per mouse. Three independent experiments (sham, n=6 mice; gluten, n=10 mice; gluten→GFD, n=9 mice). mean ± s.e.m.; ANOVA / Tukey’s multiple comparison.
(H) Expression of GzmB in the intestinal epithelium was measured by qPCR. Relative expression levels in gluten and gluten→GFD groups were normalized against the expression levels observed in sham-fed DQ8-Dd-villin-IL-15tg mice. Two independent experiments (n=6 mice per group). mean ± s.e.m.; Unpaired, two-tailed, t-test.
(I, J) DQ8-Dd-villin-IL-15tg mice that were raised on a gluten-free diet (GFD) were maintained on a GFD (denoted “sham”), fed with gluten for 30 days (“gluten”), or fed with gluten for 30 days and then reverted to a GFD (“gluten→GFD”) for 60 (day 90, red dots) or 90 days (day 120, gray dots). The intestinal epithelium was isolated and analyzed by flow cytometry. IELs were identified as TCRβ+ CD4− CD8αβ+ cells. Granzyme B+ IELs are indicated by (I) percentage and (J) MFI. Two independent experiments (sham, n=6 mice; gluten, n=8 mice; gluten→GFD, n=8 mice); mean ± s.e.m.; ANOVA / Tukey’s multiple comparison.
(K) Expression of Prf1 in the intestinal epithelium was measured by qPCR. Analysis was performed as in (F). Two independent experiments (gluten, n=6 mice; gluten→GFD, n=7 mice). mean ± s.e.m ; Unpaired, two-tailed, t-test.
(L) The intestinal epithelium was isolated and analyzed by flow cytometry. IELs were identified as TCRβ+ CD4− CD8+ cells. In parallel, IELs were quantified among IECs on H&E stained ileum sections. NKG2D+ NKG2− IELs are indicated by absolute number / 100 IECs. Two independent experiments( sham, n=8 mice; gluten, n=11 mice; gluten→GFD, n=9 mice). mean ± s.e.m; ANOVA / Tukey’s multiple comparison.
Extended Data Figure 5. Impact of CD8 T cell depletion on antibody production and epithelial stress markers.
(A-F) Ten-week old DQ8-Dd-villin-IL-15tg mice were treated with 200 or 400 μg of depleting anti-CD8α antibody (clone 2.43) or its isotype control (rat IgG2b) twice prior to and during the course of gluten feeding.
(A) Experimental scheme.
(B, C) Representative dot-plots showing depletion efficiency in the (B) blood and (C) epithelium of DQ8-Dd-villin-IL-15tg mice after 30 days of anti-CD8α treatment.
(D, E) Rae1 (D) and Qa-1 (E) gene expression in the intestinal epithelium was determined by qPCR. Relative expression levels were normalized against the expression levels observed in sham-fed DQ8-Dd-villin-IL-15tg mice. Four independent experiments (gluten + isotype, n=16; gluten + anti-CD8, n=14). mean ± s.e.m; Unpaired, two-tailed, t-test.
(F) Anti-deamidated gluten peptide (DGP) IgG levels from serum collected thirty days after gluten feeding. Data are representative of three independent experiments shown as mean (gluten + isotype, n=11; gluten + anti-CD8, n=11).
Extended Data Figure 6. HLA-DQ8 is required for the expansion of cytotoxic intraepithelial lymphocytes.
(A) Cells isolated from the mesenteric lymph nodes of DQ8-Dd-villin-IL-15tg and Dd-villin-IL-15tg mice. CD11c+ CD103+ dendritic cells were analyzed by flow cytometry for their expression of MHC class II and HLA-DQ8 molecules.
(B-F) DQ8-Dd-villin-IL-15tg and Dd-villin-IL-15tg mice that were raised on a GFD were maintained on a GFD (sham) or fed with gluten for 30 days (gluten).
(B) Anti-DGP IgG levels were measured by ELISA. Sera were collected thirty days after gluten feeding. Six independent experiments (DQ8-Dd-villin-IL-15tg, sham n=17, gluten n=28; Dd-villin-IL-15tg, sham n=17, gluten n=28); mean; ANOVA / Tukey’s multiple comparison.
(C) Expression of IFN-γ in the LP was measured by qPCR. Relative expression levels in gluten groups were normalized against the expression levels observed in sham-fed DQ8-Dd-villin-IL-15tg mice and sham-fed Dd-villin-IL-15tg. Three independent experiments (DQ8-Dd-villin-IL-15tg, n=8; Dd-villin-IL-15tg, n=9);mean ± s.e.m..
(D-F) The intestinal epithelium was isolated and analyzed by flow cytometry. IELs were identified as TCRβ+ CD4− CD8+ cells.
(D) NKG2D+ NKG2− IELs are indicated by absolute number / 100 IECs. Six independent experiments (DQ8-Dd-villin-IL-15tg, sham n=8, gluten n=16; Dd-villin-IL-15tg, sham n=9, gluten n=22); mean; ANOVA / Tukey’s multiple comparison.
(E) Granzyme B+ IELs are indicated by absolute number / 100 IECs. Four independent experiments (DQ8-Dd-villin-IL-15tg, sham n=8, gluten n=8; Dd-villin-IL-15tg, sham n=9, gluten n=10); mean; ANOVA / Tukey’s multiple comparison.
(F) Intracellular granzyme B mean fluorescence intensity (MFI) was measured. Data are representative of two independent experiments shown as mean (DQ8-Dd-villin-IL-15tg, sham n=5, gluten n=6; Dd-villin-IL-15tg, sham n=5, gluten n=5). ANOVA / Tukey’s multiple comparison.
Extended Data Figure 7. CD4+ T cells are required for coeliac disease pathogenesis.
(A-J) DQ8-Dd-villin-IL-15tg mice were treated with 200 or 400 μg of depleting anti-CD4 antibody (clone GK1.5) or its isotype control (rat IgG2b) twice prior to and during the course of gluten feeding.
(A) Experimental scheme.
(B, C) Representative dot-plots showing depletion efficiency in the (B) blood and (C) mesenteric lymph nodes (MLN) of DQ8-Dd-villin-IL-15tg mice.
(D) The intestinal epithelium was isolated and analyzed by flow cytometry. IELs were identified as TCRβ+ CD4− CD8+ cells. NKG2D+ NKG2− IELs are indicated by absolute number / 100 IECs. Four independent experiments (sham, n=8; gluten + isotype, n=20, gluten + anti-CD4, n=12); mean; ANOVA / Tukey’s multiple comparison.
(E-H) Expression of (E) GzmB, (F) Prf1, (G) Rae1, and (H) Qa-1 in the intestinal epithelium as measured by qPCR. Relative expression levels were normalized against the expression levels observed in sham-fed DQ8-Dd-villin-IL-15tg mice. Four independent experiments ± s.e.m (gluten + isotype, n=12 to 17, gluten + anti-CD4, n=8); mean; Unpaired, two-tailed, t-test.
(I, L) Anti-DGP IgG (I), anti-gliadin IgG2c (J), anti-gliadin IgG (K) and anti-gliadin IgA (L) levels were measured by ELISA from serum collected thirty days after gluten feeding. Four independent experiments (sham, n=11; gluten + isotype, n=25-26, gluten + anti-CD4, n=11); mean; ANOVA / Tukey’s multiple comparison.
Extended Data Figure 8. Transcriptional programs promoted by HLA-DQ8, IL-15 and gluten.
(A, B) We contrasted the enrichment scores in the epithelium and the lamina propria for DQ8-Dd-villin-IL-15tg (x-axis) and DQ8 mice (y-axis) for all pathways enriched at an FDR <5% in at least one of the strains. Positive and negative scores represent enrichments among genes that are more highly or lowly expressed in gluten-fed animals, respectively. The bottom right quadrant refers to pathways that in response to gluten are up-regulated in DQ8-Dd-villin-IL-15tg but down-regulated in DQ8 mice.
(C) Gene ontology terms significantly enriched among genes differently expressed in response to gluten challenge in DQ8, Dd-villin-IL-15tg, and DQ8-Dd-villin-IL-15tg mice.
(D) Heatmap of genes showing a stronger response to gluten in DQ8-Dd-villin-IL-15tg mice as compared to DQ8 and Dd-villin-IL-15tg mice. The colors reflect the magnitude of the response to gluten (in log2 scale), and the stars highlight gene ontology terms associated with each of the genes plotted.
Extended Data Figure 9. Impact of IFN-γ and IL-21 neutralization on the development of coeliac disease.
(A-I) DQ8-Dd-villin-IL-15tg mice were treated with 500 μg of anti-IFNγ (clone XMG1.2) and/or anti-IL21R (clone 4A9) antibodies or corresponding isotype controls (rat IgG1 and rat IgG2a, respectively) once prior to, and every 3 days during the course of gluten feeding as indicated in the panels.
(A) Ratio of the morphometric assessment of villous height to crypt depth. Data are representative of two independent experiments shown as mean (sham, n=8, gluten + isotype, n=7, gluten + anti-IL-21R, n= 6). ANOVA / Tukey’s multiple comparison.
(B) Quantification of IELs among IECs was performed on H&E stained ileum sections. Two independent experiments (sham, n=8, gluten + isotype, n=7, gluten + anti-IL-21R, n= 6); mean; ANOVA / Tukey’s multiple comparison.
(C) The intestinal epithelium was isolated and analyzed by flow cytometry. IELs were identified as TCRβ+ CD4− CD8+ cells. Granzyme B+ IELs are indicated by absolute number / 100 IECs. Data are representative of two independent experiments shown as mean (sham, n=8, gluten + isotype, n=7, gluten + anti-IL-21R, n= 6).
(D) Granzyme B+ IELs are indicated as in (C). Four independent experiments (sham, n=12, gluten + isotype, n=16, gluten + anti-IL-21R + anti- IFN-γ, n= 11); mean; ANOVA / Tukey’s multiple comparison.
(E) Quantification of IELs among IECs was performed on H&E stained ileum sections. Four independent experiments (sham, n=13, gluten + isotype, n=17, gluten + anti-IL-21R+ anti- IFN-γ, n= 11); mean; ANOVA / Tukey’s multiple comparison.
(F-G) Serum anti-DGP IgG (F) and anti-gliadin IgG2c (G) levels were measured by ELISA. Sera were collected thirty days after gluten feeding. Two independent experiments (sham, n=5 and 6, gluten + isotype, n=8 and 7, gluten + anti-IL-21R, n= 6); mean; ANOVA / Tukey’s multiple comparison.
(H-I) Serum anti-DGP IgG (H) and anti-gliadin IgG2c (I) levels were measured as in (F-G). Two independent experiments (sham, n=6 and 6, gluten + isotype, n=8, gluten + anti- IFN-γ, n= 6); mean; ANOVA/ Tukey’s multiple comparison.
Extended Data Figure 10. Validation of DQ8-Dd-villin-IL-15tg mice as a preclinical mouse model of coeliac disease.
(A) Serum anti-native gliadin peptides (Native) and anti-deamidated gliadin peptide (DGP) IgG levels in gluten-fed DQ8-Dd-villin-IL-15tg mice dosed with TG2 inhibitors (gluten + TG2 inhibitors) or vehicle (gluten) were compared by ELISA. Four independent experiments (gluten n=17; gluten + TG2 inhibitors n=13); Paired, two-tailed, t-test. In all cases, serum samples were obtained on day 30 after initiating the gluten challenge.
(B) Similar gene regulatory mechanisms underlie the development of CeD in humans and DQ8-Dd-villin-IL-15tg mice. Contrast between the gene ontology terms enriched among genes induced by gluten challenge in DQ8-Dd-villin-IL-15tg mice (depicted in the form of −log10 p-values on the x-axis) and the gene ontology terms enriched among genes differently expressed between CeD patients and healthy controls (depicted in the form of −log10 p-values on the x-axis) in the epithelial compartment (A) and the LP (B). The transcriptional comparison was made between the intestinal epithelium and LP of gluten-fed DQ8-Dd-villin-IL-15tg mice and whole duodenal biopsies of active CeD patients.
Extended Data Figure 11. Interplay between IL-15, TG2, and HLA-DQ8 promote the development of villous atrophy.
(A) Representation of the respective roles of HLA-DQ8, IL-15 in the epithelial and LP compartments, IFN-γ, TG2, CD4+ and CD8+ T cells in promoting VA. IL-15 upregulation in the LP is required to induce the adaptive anti-gluten TH1 response, and HLA-DQ8 facilitates and enhances the IFN-γ response that is required for the development of VA. The adaptive TH1 immune response promoted by HLA-DQ8 and IL-15 in the LP, is however insufficient to cause tissue destruction. It needs to synergize with IL-15 in the epithelium to further promote the expansion of cytolytic IELs and their degranulation, leading to CD8 T cell dependent killing of epithelial cells and VA. The value of this mouse model as a gluten and HLA-DQ8-dependent preclinical model for CeD, is further emphasized by the finding that TG2 inhibition prevents VA.
(B) CeD can be represented as a jigsaw puzzle where each piece representing one component of the anti-gluten immune response must interlock to lead to the development of VA, the diagnostic hallmark of active CeD.
Supplementary Material
Data Set 1: GSEA hallmark pathways
Data Set 2: Differentially expressed genes between sham and gluten-fed mice
Acknowledgments
We thank patients with coeliac disease and their family members, as well as the University of Chicago Celiac Disease Center, for supporting our research. We thank Charlotte Zaouter from BZ-Histo Services Inc. (Montreal, Quebec, Canada) for her technical assistance with the histological processing of intestinal samples. We also thank the Human Tissue Resource Center and the Integrated Light Microscopy Core Facility at the University of Chicago. This work was supported by grants from NIH: R01 DK67180 and R01 DK63158, and Digestive Diseases Research Core Center P30 DK42086 at the University of Chicago as well as by funding from F. Oliver Nicklin associated with the First Analysis Institute of Integrative Studies and the Regenstein Foundation to B.J., from the CIHR (catalyst grant in environments, genes, and chronic disease) to V.A. and L.B.B., the SickKids Foundation (NI15-040) and the Canadian Celiac Association to V.A., from NIH: R01 DK063158 and R01 DK100619 to C.K., award from the Wallonie-Bruxelles International-World Excellence and from FRQNT to T.L., The Carlino Fellowship for Celiac Disease Research from the University of Chicago Celiac Disease Center supported V.D.
Footnotes
Competing interests
The authors declare no competing financial interests. B.J. and J.A.M. are consultants to Celimmune and Bionix. C.K. is a member of the Board of Directors of Protagonist Therapeutics.
Data availability
Source data for all experiments are provided with the paper. The RNA-seq experiments reported in this paper were deposited into the Gene Expression Omnibus Database under the accession code GSE134900.
References
- 1.Abadie V, Sollid LM, Barreiro LB & Jabri B Integration of genetic and immunological insights into a model of celiac disease pathogenesis. Annu Rev Immunol 29, 493–525 (2011). [DOI] [PubMed] [Google Scholar]
- 2.Green PH & Cellier C Celiac disease. N Engl J Med 357, 1731–1743 (2007). [DOI] [PubMed] [Google Scholar]
- 3.Plugis NM & Khosla C Therapeutic approaches for celiac disease. Best Pract Res Clin Gastroenterol 29, 503–521 (2015). [DOI] [PMC free article] [PubMed] [Google Scholar]
- 4.Jabri B & Sollid LM Tissue-mediated control of immunopathology in coeliac disease. Nat Rev Immunol 9, 858–870 (2009). [DOI] [PubMed] [Google Scholar]
- 5.Husby S et al. European Society for Pediatric Gastroenterology, Hepatology, and Nutrition guidelines for the diagnosis of coeliac disease. J Pediatr Gastroenterol Nutr 54, 136–160 (2012). [DOI] [PubMed] [Google Scholar]
- 6.Dieterich W et al. Identification of tissue transglutaminase as the autoantigen of celiac disease. Nat Med 3, 797–801 (1997). [DOI] [PubMed] [Google Scholar]
- 7.Jabri B & Abadie V IL-15 functions as a danger signal to regulate tissue-resident T cells and tissue destruction. Nat Rev Immunol 15, 771–783 (2015). [DOI] [PMC free article] [PubMed] [Google Scholar]
- 8.Waldmann TA The biology of interleukin-2 and interleukin-15: implications for cancer therapy and vaccine design. Nat Rev Immunol 6, 595–601 (2006). [DOI] [PubMed] [Google Scholar]
- 9.Setty M et al. Distinct and Synergistic Contributions of Epithelial Stress and Adaptive Immunity to Functions of Intraepithelial Killer Cells and Active Celiac Disease. Gastroenterology 149, 681–691 e610 (2015). [DOI] [PMC free article] [PubMed] [Google Scholar]
- 10.Black KE, Murray JA & David CS HLA-DQ determines the response to exogenous wheat proteins: a model of gluten sensitivity in transgenic knockout mice. J Immunol 169, 5595–5600 (2002). [DOI] [PubMed] [Google Scholar]
- 11.Jabri B & Sollid LM Mechanisms of disease: immunopathogenesis of celiac disease. Nat Clin Pract Gastroenterol Hepatol 3, 516–525 (2006). [DOI] [PubMed] [Google Scholar]
- 12.Korneychuk N et al. Interleukin 15 and CD4(+) T cells cooperate to promote small intestinal enteropathy in response to dietary antigen. Gastroenterology 146, 1017–1027 (2014). [DOI] [PubMed] [Google Scholar]
- 13.DePaolo RW et al. Co-adjuvant effects of retinoic acid and IL-15 induce inflammatory immunity to dietary antigens. Nature 471, 220–224 (2011). [DOI] [PMC free article] [PubMed] [Google Scholar]
- 14.Di Niro R et al. High abundance of plasma cells secreting transglutaminase 2-specific IgA autoantibodies with limited somatic hypermutation in celiac disease intestinal lesions. Nat Med 18, 441–445 (2012). [DOI] [PMC free article] [PubMed] [Google Scholar]
- 15.Nilsen EM et al. Gluten induces an intestinal cytokine response strongly dominated by interferon gamma in patients with celiac disease. Gastroenterology 115, 551–563 (1998). [DOI] [PubMed] [Google Scholar]
- 16.Meresse B et al. Reprogramming of CTLs into natural killer-like cells in celiac disease. J Exp Med 203, 1343–1355 (2006). [DOI] [PMC free article] [PubMed] [Google Scholar]
- 17.Meresse B et al. Coordinated induction by IL15 of a TCR-independent NKG2D signaling pathway converts CTL into lymphokine-activated killer cells in celiac disease. Immunity 21, 357–366 (2004). [DOI] [PubMed] [Google Scholar]
- 18.Hue S et al. A direct role for NKG2D/MICA interaction in villous atrophy during celiac disease. Immunity 21, 367–377 (2004). [DOI] [PubMed] [Google Scholar]
- 19.Bodd M et al. HLA-DQ2-restricted gluten-reactive T cells produce IL-21 but not IL-17 or IL-22. Mucosal Immunol 3, 594–601 (2010). [DOI] [PubMed] [Google Scholar]
- 20.van de Wal Y et al. Selective deamidation by tissue transglutaminase strongly enhances gliadin-specific T cell reactivity. J Immunol 161, 1585–1588 (1998). [PubMed] [Google Scholar]
- 21.Molberg O et al. Tissue transglutaminase selectively modifies gliadin peptides that are recognized by gut-derived T cells in celiac disease. Nat Med 4, 713–717 (1998). [DOI] [PubMed] [Google Scholar]
- 22.Klock C, Herrera Z, Albertelli M & Khosla C Discovery of potent and specific dihydroisoxazole inhibitors of human transglutaminase 2. J Med Chem 57, 9042–9064 (2014). [DOI] [PMC free article] [PubMed] [Google Scholar]
- 23.Freitag TL et al. Gliadin-primed CD4+CD45RBlowCD25- T cells drive gluten-dependent small intestinal damage after adoptive transfer into lymphopenic mice. Gut 58, 1597–1605 (2009). [DOI] [PMC free article] [PubMed] [Google Scholar]
Additional References
- 24.Meisel M et al. Interleukin-15 promotes intestinal dysbiosis with butyrate deficiency associated with increased susceptibility to colitis. ISME J 11, 15–30 (2017). [DOI] [PMC free article] [PubMed] [Google Scholar]
- 25.Pinto D, Robine S, Jaisser F, El Marjou FE & Louvard D Regulatory sequences of the mouse villin gene that efficiently drive transgenic expression in immature and differentiated epithelial cells of small and large intestines. J Biol Chem 274, 6476–6482 (1999). [DOI] [PubMed] [Google Scholar]
- 26.Lefrancois L & Lycke N Isolation of mouse small intestinal intraepithelial lymphocytes, Peyer’s patch, and lamina propria cells. Curr Protoc Immunol Chapter 3, Unit 3 19 (2001). [DOI] [PubMed] [Google Scholar]
- 27.Bouziat R et al. Reovirus infection triggers inflammatory responses to dietary antigens and development of celiac disease. Science 356, 44–50 (2017). [DOI] [PMC free article] [PubMed] [Google Scholar]
- 28.DiRaimondo TR et al. Elevated transglutaminase 2 activity is associated with hypoxia-induced experimental pulmonary hypertension in mice. ACS Chem Biol 9, 266–275 (2014). [DOI] [PMC free article] [PubMed] [Google Scholar]
- 29.Du P, Kibbe WA & Lin SM lumi: a pipeline for processing Illumina microarray. Bioinformatics 24, 1547–1548 (2008). [DOI] [PubMed] [Google Scholar]
- 30.Lin SM, Du P, Huber W & Kibbe WA Model-based variance-stabilizing transformation for Illumina microarray data. Nucleic Acids Res 36, e11 (2008). [DOI] [PMC free article] [PubMed] [Google Scholar]
- 31.Smyth GK Linear models and empirical bayes methods for assessing differential expression in microarray experiments. Stat Appl Genet Mol Biol 3, Article3 (2004). [DOI] [PubMed] [Google Scholar]
- 32.Benjamini Y H. Y Controlling the false discovery rate: A practical and powerful approach to multiple testing. J R Stat Soc Ser A Stat Soc 57, 289–300 (1995). [Google Scholar]
- 33.Bray NL, Pimentel H, Melsted P & Pachter L Near-optimal probabilistic RNA-seq quantification. Nat Biotechnol 34, 525–527 (2016). [DOI] [PubMed] [Google Scholar]
- 34.Robinson MD, McCarthy DJ & Smyth GK edgeR: a Bioconductor package for differential expression analysis of digital gene expression data. Bioinformatics 26, 139–140 (2010). [DOI] [PMC free article] [PubMed] [Google Scholar]
- 35.Ritchie ME et al. limma powers differential expression analyses for RNA-sequencing and microarray studies. Nucleic Acids Res 43, e47 (2015). [DOI] [PMC free article] [PubMed] [Google Scholar]
- 36.Eden E, Navon R, Steinfeld I, Lipson D & Yakhini Z GOrilla: a tool for discovery and visualization of enriched GO terms in ranked gene lists. BMC Bioinformatics 10, 48 (2009). [DOI] [PMC free article] [PubMed] [Google Scholar]
Associated Data
This section collects any data citations, data availability statements, or supplementary materials included in this article.
Supplementary Materials
Data Set 1: GSEA hallmark pathways
Data Set 2: Differentially expressed genes between sham and gluten-fed mice


