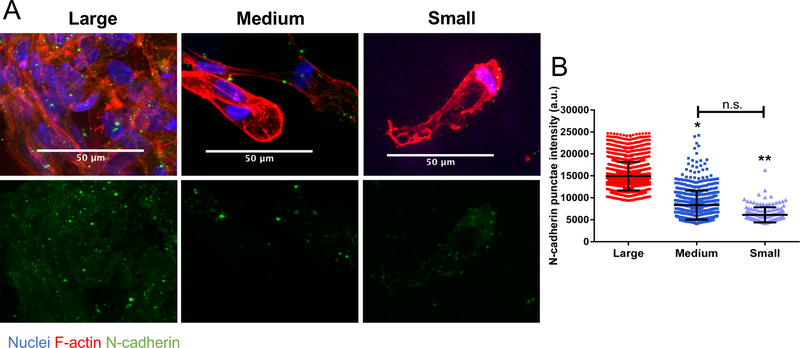
Figure 4: N-cadherin interaction and expression increases with increased cell clustering.
(A) hMSCs in large (190±100μm) diameter microgel scaffolds (top, right) with highly clustered cells show more intense staining for N-cadherin punctate compared with smaller clusters in medium (110±60μm) diameter microgel scaffolds (middle, right) and largely single cells in small (13±6μm) diameter microgel scaffolds (bottom, right) Cells stained for nuclei (blue), N-cadherin (green), and F-actin (red). (B) Intensity quantification of the N-cadherin punctate. Stars represent significance relative to large microgel scaffolds. ** p<0.01, * p<0.05, n.s. – non-significant

