Abstract
The spinal cord is composed of gray matter and white matter. It is well known that the properties of these two tissues differ considerably. Spinal diseases often present with symptoms that are caused by spinal cord compression. Understanding the mechanical properties of gray and white matter would allow us to gain a deep understanding of the injuries caused to the spinal cord and provide information on the pathological changes to these distinct tissues in several disorders. Previous studies have reported on the physical properties of gray and white matter, however, these were focused on longitudinal tension tests. Little is known about the differences between gray and white matter in terms of their response to compression. We therefore performed mechanical compression test of the gray and white matter of spinal cords harvested from cows and analyzed the differences between them in response to compression. We conducted compression testing of gray matter and white matter to detect possible differences in the collapse rate. We found that increased compression (especially more than 50% compression) resulted in more severe injuries to both the gray and white matter. The present results on the mechanical differences between gray and white matter in response to compression will be useful when interpreting findings from medical imaging in patients with spinal conditions.
Keywords: biomechanical study, cervical spondylotic myelopathy, collapse rate, compression, gray matter, mechanical properties, spinal cord injury, white matter
Introduction
Spinal diseases such as cervical spondylotic myelopathy, ossification of the posterior longitudinal ligament, and disc herniation often present with symptoms that are associated with spinal cord compression. As the symptoms progress, the patient’s daily activities and quality of life are adversely affected (Shimomura et al., 1968; Al-Mefty et al., 1993; Ono et al., 1999). Spinal cord disorders are associated with injuries to the gray and white matter (Ono et al., 1977) and hence it is important to understand the mechanical properties of these tissues.
Based on tension testing of bovine spinal cord by Ichihara et al. (2001), we recently conducted tension testing of the porcine cauda equina as well as mechanical tests that focused on age-related changes to the spinal cord to study the physical properties of nerve tissues (Okazaki et al., 2018). We also previously conducted extensive compression analysis of the spinal cord using computer simulation (Nishida et al., 2011, 2012, 2013). Myelography, computed tomography and magnetic resonance imaging are performed to diagnose myelopathy and to detect spinal cord compression (Matsuyama et al., 1995). Pathological studies of myelopathy have also focused on spinal cord compression (Ono et al., 1977). In studies that compare cases with or without postoperative morphological restoration of the spinal cord, compression and decompression were analyzed in relation to the cross-sectional force applied to the spinal cord. Hence, one of the limitations of our earlier data on the physical properties of the spinal cord was that the results were derived from longitudinal tension tests. To the best of our knowledge, no previous study has experimentally investigated the differences between gray and white matter in terms of their response to compression. We therefore applied a constant compression force to gray and white matter collected from cows and analyzed the difference in response to compression. In addition, we studied the mechanical properties of both tissues.
Materials and Methods
Animals
Due to their ready availability, spinal cords were collected from male castrated Holstein cows for this study. The nine cows aged 21 ± 1 months, weighing 425–470 kg, were killed by exsanguination at the Hofu city meat center, which is a licensed establishment. The study used bovine spongiform encephalopathy-negative spinal cords sourced within 6 hours of slaughter and all experimentation was completed within 12 hours of slaughter. The specimens and instruments used for this experiment were under the instruction and supervision of the Hofu City Public Health Center and Department of Sanitation of the Yamaguchi Prefecture. Regulations of Yamaguchi University are subject to review researches using living animals. This study used spinal cord of cows that were slaughtered for food. The Institutional Animal Care and Use Committee of Yamaguchi University waived requirement for ethical approval.
After cutting off 100 mm from both ends of the excised spinal cord with a medical scalpel, the cord was cut into 20 mm length pieces at 25°C as reported earlier (Ichihara et al., 2001). Both ends of the cord were cut off as a precaution since these may have been damaged by the tensile load applied to the neck during slaughter of the cow (Figure 1).
Figure 1.
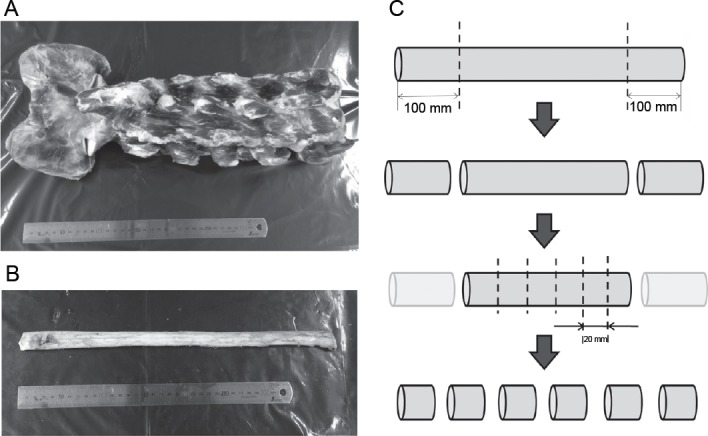
Spine and spinal cords collected from Holstein cows.
(A) The spine. (B) The spinal cord. (C) After cutting 100 mm from both ends of the excised spinal cord with a medical scalpel, the cord was cut into 20-mm pieces.
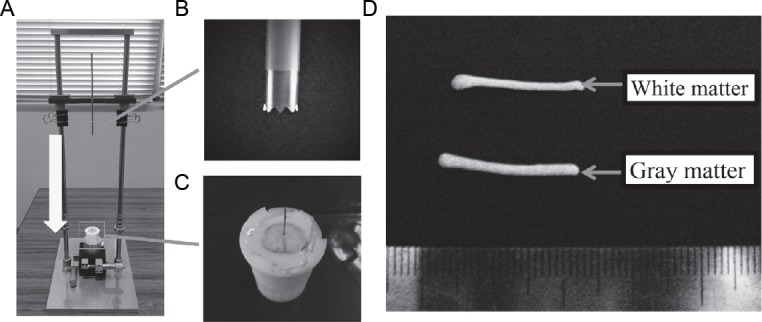
A semicircular polyethylene terephthalate (PET) agent was inserted into the trabeculae between the pia mater and the arachnoid membrane of the bovine cervical cord and the fibrous tissue connecting these was cut off to excise the spinal cord (Figure 2C).
Figure 2.
The needle drop sampling method.
(A) After the case containing the spinal cord was mounted on the instrument, an X-Y stage attached to the base was moved to reposition the needle to the drop position (The needle dropped quickly in the direction of the white arrow). (B) The needle (inner diameter was 2.7 mm and outer diameter was 3.1 mm). (C) A semicircular polyethylene terephthalate agent was inserted into the trabeculae between the pia mater and arachnoid membrane of the bovine cervical cord. (D) Samples: the lateral funiculus (white matter) and the anterior horn (gray matter).
Needle drop sampling
The needle drop sampling method was used for sample collection in this study. The spinal cord was fixed in a plastic case created using a 3D printer. When a biopsy needle is inserted into the tissue to collect a sample, the tissue may collapse and consequently a smooth tissue sample may not be obtained. We therefore created a new instrument that allows the collection of tissue samples using a constant force. After the case containing the spinal cord was mounted on the instrument, an X-Y stage attached to the base was moved to reposition the needle to the drop position (Figure 2A). The needle-fixing base was raised to its upper limit and then dropped to punch out a sample from the tissue (Figure 2B). With this system, precise needle positioning was achieved by moving the X-Y stage as required, allowing for consistent sampling. Samples were collected from the lateral funiculus (white matter) and the anterior horn (gray matter), as these areas were large enough to avoid mixing the two types of tissue (Figure 2D).
Test equipment for compression testing
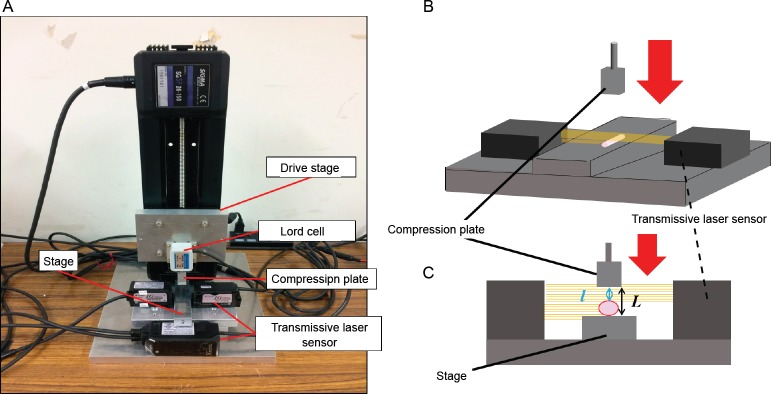
Samples were compressed in a horizontal plane and the reaction force from the sample was measured. At the same time, the degree of sample collapse before and after compression was measured with a transmissive laser sensor (IG-010; KEYENCE, Tokyo, Japan) (Figure 3A). The sensor was positioned appropriately to allow measurement of the distance between the stage and the compression plate (= L), as well as the distance between the sample on the stage and the compression plate (= l). The difference in the distance before and after placement of the sample (L–l) was defined as the sample diameter (Figure 3B and C).
Figure 3.
Test equipment for compression testing.
(A) Device. (B) The sample was compressed with a compression plate attached to an automatic drive stage. (C) Samples were compressed in a horizontal plane and the reaction force from the sample was measured. The transmissive laser sensor was positioned appropriately to allow for measuring the distance between the stage and the compression plate (= L) and the distance between the sample on the stage and the compression plate (= l). The difference in the distance before and after placement of the sample (L–l) was deemed as the sample diameter.
Experimental procedure
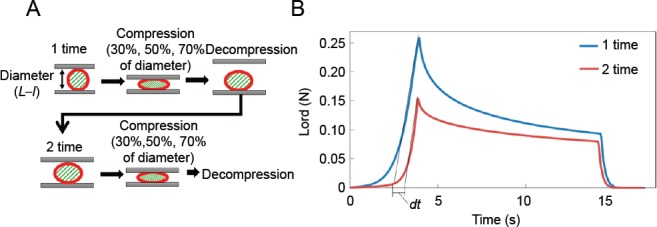
Compression was applied to achieve 30%, 50%, and 70% of the anteroposterior diameter of the gray matter and white matter. The number of samples of white and gray matter to which these compressions were applied was 5 and 4, 3 and 4, and 3 and 3, respectively. The detailed procedure was as follows (Figure 4A):
Figure 4.
Compression analysis.
(A) 1) The sample was dried off to eliminate all moisture and placed on the base. 2) The sample diameter (L–l) was measured with a transmissive laser sensor and the height of the compression plate was adjusted to the sample diameter. 3) The compression plate was lowered at a velocity of 0.2 mm⁄s to compress 30%, 50%, 70% of diameter of the sample respectively. 4) The plate was allowed to stay in position for about 10 seconds while the sample was being compressed. 5) The compression plate was raised at a velocity of 0.2 mm⁄s up to the height corresponding to the sample diameter. 6) After approximately 15 seconds, steps 3–5 were repeated once again on the same sample to ensure compression-induced injury. 7) After the second compression, the sample diameter was measured again with the transmissive laser sensor. (B) The collapse rate Cd[%] was calculated from the difference in the positions at which the load increase occurred in the time-load relationship. The time difference between the intersection of each approximate line and the time axis was calculated as dt[s].
1) The sample was dried to eliminate all moisture and then placed on the base. 2) The sample diameter was measured with a transmissive laser sensor and the height of the compression plate was adjusted to the sample diameter. 3) The compression plate was lowered at a velocity of 0.2 mm⁄s to compress the sample to 30%, 50%, or 70% of its diameter. 4) The plate was allowed to stay in position for about 10 seconds while the sample was being compressed. 5) The compression plate was raised at a velocity of 0.2 mm⁄s up to the height corresponding to the sample diameter. 6) After approximately 15 seconds, steps 3–5 were repeated on the same sample to ensure compression-induced injury was achieved. 7) After the second compression, the sample diameter was measured again with the transmissive laser sensor.
One compression only was used to determine the extent of crushing of gray and white matter. To evaluate the plasticity of the tissues, the same experiment was performed twice using the same compression rate and compression time. Saline was frequently sprayed on to the samples to keep them wet.
Change of compression time
To determine the effect of compression time, the same experiment was carried out but with the compression hold time increased from 10 to 20 seconds. The number of samples to which 30%, 50% and 70% compression was applied was 4, 7, and 7 (white matter) and 4, 6, and 7 (gray matter), respectively. The discrepancy in sample numbers between the gray and white matter was due to exclusion of displaced samples.
The degree of sample collapse caused by the compression load was defined as the collapse rate and was used to evaluate the experimental data. The sample was compressed with a compression plate attached to an automatic drive stage (SGSP26-150; Sigmakoki, Tokyo, Japan). The reaction force from the sample was converted to electric signals using a load cell (LTS-200GA; Kyowa Electronic instruments Corporation. Tokyo, Japan) and captured as distortion signals that were entered into a personal computer via a data logger (PCD-300B; Kyowa Electronic instruments Corporation. Tokyo, Japan). From this data, the collapse rate Cd[%] was calculated using the difference in the positions at which the load increase occurred in the time-load relationship. More specifically, the magnitude of compression was estimated from the difference in the positions at which a significant increase in load occurred between two compression sessions.
Since the time-load curve obtained through compression testing was almost linear at load values ranging from 50% of maximum up to the maximum, approximate lines were created for this range. The time difference between the intersection of each approximate line and the time axis was calculated as dt[s] (Figure 4B). The product of the moving velocity of the compression plate 0.2 mm⁄s and dt was defined as the collapse amount, CI[mm]. The collapse rate, Cd[%], was calculated as the ratio of the collapse amount to the sample diameter, or the difference in the positions at which load increase occurred, using the following formula:
Cd = 100 × dt × compression velocity/(sample diameter [mm])
The collapse rate for each experiment was determined using the above formula.
Statistical analysis
Since the sex, age and collection site (spinal cord) of the experimental animals was the same, statistical analysis was performed under the conditions of collapse rates after 10- and 20-second compression.
The values of the collapse rate (Cd) measured for white matter and gray matter were set as objective variables, while the difference in compression rates at 30%, 50%, and 70% was set constantly as explanatory variables.
Also set as objective variables were the values of collapse rates (Cd) measured at compression rates of 30%, 50%, and 70%, while the white and gray matter were set constantly as explanatory variables
The analysis was performed using StatFlex Ver. 6 (Artech Co., Ltd. Osaka, Japan). P values of < 0.05 were considered statistically significant using one-way analysis of variance.
Results
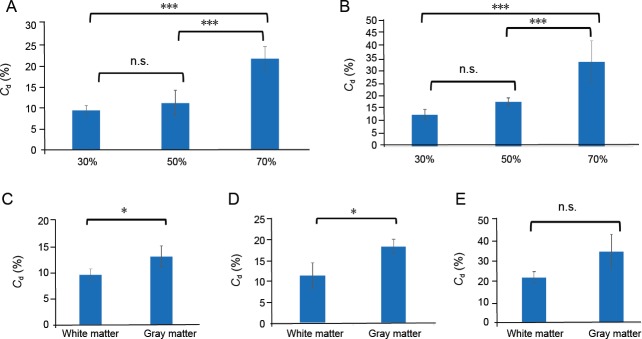
After a 10-second compression of the white and gray matter (Figure 5A and B), no significant difference was found in the collapse rate between 30% and 50% compression. However, the collapse rate measured at 70% compression was significantly greater than that for 30% and 50% compression (P < 0.001).
Figure 5.
The mean Cd values after 10-second compression with a compression rate of 30%, 50%, and 70% in the white and the gray matter are reported.
(A) 10-second 30%, 50%, and 70% compression of the white matter. (B) 10-second 30%, 50%, and 70% compression of the gray matter. (C–E) When analyzed according to compression rate, the collapse rates of the white matter and gray matter with 30% (C), 50% (D) and 70% compression (E). *P < 0.05, ***P < 0.001 (one-way analysis of variance). Cd: Collapse rate; n.s.: not significant.
Collapse rates for the gray matter at 30% and 50% compression (Figure 5C and D) were significantly higher than those for white matter (P < 0.05). No significant difference was observed at 70% compression (Figure 5E), although the gray matter tended to show more collapse.
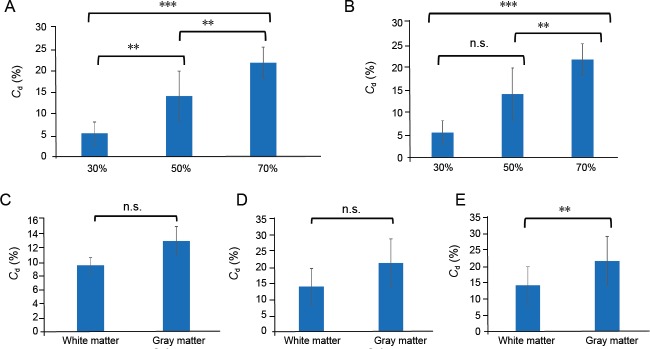
The collapse rate increased significantly after 20-second compression of the white matter, with increasing compression rates observed from 30% to 50% and then to 70% Figure 6A).
Figure 6.
The mean Cd values after 20-second compression with a compression rate of 30%, 50%, and 70% in the white and the gray matter are reported.
Vertical axis is the collapse rate Cd[%]. (A) 20-second 30%, 50%, and 70% compression of the white matter. (B) 20-second 30%, 50%, and 70% compression of the gray matter. (C–E) When analyzed according to compression rate, the collapse rates of the white matter and gray matter with 30% (C), 50% (D) and 70% compression (E). *P < 0.05, **P < 0.01, ***P < 0.001 (one-way analysis of variance). n.s.: Not significant.
After 20-second compression of the gray matter, the collapse rate was higher at 50% compression than at 30% compression, but this was not statistically significant. The collapse rate at 70% compression was significantly higher than for both 30% (P < 0.001) and 50% compression (P < 0.01) (Figure 6B).
The collapse rates for gray matter at 30% and 50% compression (Figure 6C and D) were greater than for white matter, although these differences were not statistically significant. However, the collapse rate of gray matter at 70% compression was significantly greater than that of white matter (P < 0.01) (Figure 6E).
Discussion
Previously, we conducted simulation analyses of the spinal cord based on data from tension testing with the bovine spinal cord (Ichihara et al., 2001). In animal studies, we demonstrated varying hardness of different nerve tissues, with the cauda equina being 17 and 47 times harder than the gray and white matter of the spinal cord, respectively (Nishida et al., 2015). We also demonstrated age-related changes in the hardness of nerve tissues by comparing older and younger cows (Okazaki et al., 2018). However, spinal cord injury can be caused by compression and shear force as well as tension (Taylor, 1953; Penning, 1962; Nagata et al., 1990; Henderson et al., 2005). We therefore studied the effects of compression on the gray and the white matter, since this is important for predicting and understanding the pathological changes that occur in the spinal cord.
The pathological changes reported in chronically compressed spinal cords in conditions such as ligament ossification and cervical spondylotic myelopathy include flattening and neuronal loss of the anterior horn (gray matter), whereas the white matter appears more resistant to such changes (Al-Mefty et al., 1993; Kameyama et al., 1995). Ono et al. (1977) reported that severe spinal cord compression was associated with extensive tissue collapse and cavity formation in the gray matter. Moreover, Ito et al. (1996) reported that severe compression causes necrosis and defluvium of the gray matter and of the ventrolateral side of the posterior funiculus. The histology of the spinal cord in patients with compressive myelopathy therefore shows more residual tissues of the anterior and lateral funiculi compared to the gray matter, suggesting the latter is more prone to collapse and necrosis than white matter.
At the cellular level, the white matter of the spinal cord contains neural fibers, neuroglia and blood vessels, with the neural fibers coursing longitudinally in the cord. The gray matter is a relatively loose and disarranged tissue composed of neurons, axon terminals, dendrites and neuroglial cells. This differential cellular composition of the gray and white matter is likely to contribute to the observed differences in mechanical properties of these tissues.
Regarding the tissue response to compression, Baba et al. (1996, 1997) reported the cell population in the anterior horn starts to decrease when the cross-sectional area of the cord decreases by 30% due to compression, reaching a plateau when the area decreases by 50%. The flexibility of the spinal cord following decompression is associated with reversal of spinal cord dysfunction and improvement in neurological symptoms. Indeed, improved clinical symptoms associated with morphological restoration of the spinal cord area have been observed in patients following decompression (Matsuyama et al., 1995). For effective clinical follow-up it is therefore important to determine the degree of compression causing collapse of the gray and white matter.
Our results show that a significant increase in the collapse rate occurs in both the white and gray matter at a compression of more than 30–50%, consistent with results reported by Baba et al. Moreover, the gray matter showed a higher collapse rate than white matter. These findings indicate that gray matter is mechanically weaker than white matter, which is also consistent with previous reports.
One of the limitations of our study was the short compression times. In clinical cases, compression is applied to the spinal cord over several years and the severity of compression can change over time. We observed no significant difference between gray and white matter according to the compression time. Another limitation is that the degree and duration of compression leading to irreversible change or functional impairment of gray and white matter is unknown. Other limitations are that study samples were dead bovine rather human origin, the sample size was relatively small, vascular insufficiency was not considered, and that no assessment was made of histological damage following compression. Moreover, tissue samples were collected from the anterior horn and lateral funiculus in order to avoid having a mixture of tissues, but it is not known whether the anterior/posterior funiculus and posterior horn have the same strength. Previous reports on ligament ossification showed that spinal cords deformed by compression still maintain their function (Mizuno et al., 1992; Kameyama et al., 1995). Therefore it is not possible to fully explain the relationship between compression and spinal cord function by focusing only on compression.
In summary, the two major findings of this study are that gray matter tends to show less plasticity than white matter, and that increased compression was associated with a greater impact on both white and gray matter. These observations can be used to inform future mechanistic studies, as well as suggesting the need to determine the extent of compression of white and gray matter in clinical practice. These data should also contribute to simulation analyses.
Correct interpretation of medical imaging results and awareness of the mechanical differences between gray and white matter in response to compression is important for understanding the clinical course of patients with spinal conditions.
Acknowledgments:
The authors express their thanks to the cooperation provided by the members of the Medical and Mechanical Engineering Laboratory of the same college, and graduate students from this laboratory.
Footnotes
Conflicts of interest: The authors declare that there are no conflicts of interest.
Financial support: This work was supported by JSPS KAKENHI (No. JP 15K20002), Yamaguchi University School of Medicine Affiliated Hospital: Translational Promotion Grant and President of Yamaguchi University Strategic Expenses: Young Researcher Support Project (all to NN).
Institutional review board statement: The Institutional Animal Care and Use Committee of Yamaguchi University waived requirement for ethical approval.
Copyright license agreement: The Copyright License Agreement has been signed by all authors before publication.
Data sharing statement: Datasets analyzed during the current study are available from the corresponding author on reasonable request.
Plagiarism check: Checked twice by iThenticate.
Peer review: Externally peer reviewed.
Open peer reviewers: Masaaki Hori, Juntendo University School of Medicine, Japan.
Funding: This work was supported by JSPS KAKENHI (No. JP 15K20002), Yamaguchi University School of Medicine Affiliated Hospital: Translational Promotion Grant and President of Yamaguchi University Strategic Expenses: Young Researcher Support Project (all to NN).
Chinese Library Classification No. R44; R318; R604
P-Reviewer: Hori M; C-Editor: Zhao M; S-Editor: Li CH; L-Editor: Song LP; T-Editor: Jia Y
References
- 1.Al-Mefty O, Harkey HL, Marawi I, Haines DE, Peeler DF, Wilner HI, Smith RR, Holaday HR, Haining JL, Russell WF, Brent H, Try HM. Experimental chronic compressive cervical myelopathy. J Neurosurg. 1993;79:550–561. doi: 10.3171/jns.1993.79.4.0550. [DOI] [PubMed] [Google Scholar]
- 2.Baba H, Maezawa Y, Uchida K, Imura S, Kawahara N, Tomita K, Kudo M. Three-dimensional topographic analysis of spinal accessory motoneurons under chronic mechanical compression: an experimental study in the mouse. J Neurol. 1997;244:222–229. doi: 10.1007/s004150050076. [DOI] [PubMed] [Google Scholar]
- 3.Baba H, Maezawa Y, Imura S, Kawahara N, Nakahashi K, Tomita K. Quantitative analysis of the spinal cord motoneuron under chronic compression: an experimental observation in the mouse. J Neurol. 1996;243:109–116. doi: 10.1007/BF02443999. [DOI] [PubMed] [Google Scholar]
- 4.Henderson FC, Geddes JF, Vaccaro AR, Woodard E, Berry KJ, Benzel EC. Stretch-associated injury in cervical spondylotic myelopathy: new concept and review. Neurosurgery. 2005;56:1101–1113. [PubMed] [Google Scholar]
- 5.Ichihara K, Taguchi T, Yoshinori S, Ituo S, Shunichi K, Shinya K. Gray matter of the bovine cervical spinal cord is mechanically more rigid and fragile than the white matter. J Neurotrauma. 2001;18:361–367. doi: 10.1089/08977150151071053. [DOI] [PubMed] [Google Scholar]
- 6.Ito T, Oyanagi K, Takahashi H, Takahashi HE, Ikuta F. Cervical spondylotic myelopathy. Clinicopathologic study on the progression pattern and thin myelinated fibers of the lesions of seven patients examined during complete autopsy. Spine. 1996;21:827–833. doi: 10.1097/00007632-199604010-00010. [DOI] [PubMed] [Google Scholar]
- 7.Kameyama T, Hashizume Y, Ando T, Takahashi A, Yanagi T, Mizuno J. Spinal cord morphology and pathology in ossification of the posterior longitudinal ligament. Brain. 1995;118:263–278. doi: 10.1093/brain/118.1.263. [DOI] [PubMed] [Google Scholar]
- 8.Matsuyama Y, Kawakami N, Mimatsu K. Spinal cord expansion after decompression in cervical myelopathy. Investigation by computed tomography myelography and ultrasonography. Spine. 1995;20:1657–1663. doi: 10.1097/00007632-199508000-00002. [DOI] [PubMed] [Google Scholar]
- 9.Mizuno J, Nakagawa H, Iwata K, Hashizume Y. Pathology of spinal cord lesions caused by ossification of the posterior longitudinal ligament, with special reference to reversibility of the spinal cord lesion. Neurol Res. 1992;14:312–314. doi: 10.1080/01616412.1992.11740075. [DOI] [PubMed] [Google Scholar]
- 10.Nagata K, Kiyonaga K, Ohashi T, Sagara M, Miyazaki S, Inoue A. Clinical value of magnetic resonance imaging for cervical myelopathy. Spine. 1990;15:1088–1096. doi: 10.1097/00007632-199011010-00002. [DOI] [PubMed] [Google Scholar]
- 11.Nishida N, Kato Y, Imajo Y, Kawano S, Taguchi T. Biomechanical study of the spinal cord in thoracic ossification of the posterior longitudinal ligament. J Spinal Cord Med. 2011;34:518–522. doi: 10.1179/2045772311Y.0000000029. [DOI] [PMC free article] [PubMed] [Google Scholar]
- 12.Nishida N, Kato Y, Imajo Y, Kawano S, Taguchi T. Biomechanical analysis of cervical spondylotic myelopathy: The influence of dynamic factors and morphometry of the spinal cord. J Spinal Cord Med. 2012;35:256–261. doi: 10.1179/2045772312Y.0000000024. [DOI] [PMC free article] [PubMed] [Google Scholar]
- 13.Nishida N, Kanchiku T, Kato Y, Imajo Y, Kawano S, Taguchi T. Biomechanical analysis of the spinal cord in Brown–Séquard syndrome. Exp Ther Med. 2013;6:1184–1188. [Google Scholar]
- 14.Nishida N, Kanchiku T, Ohgi J, Ichihara K, Chen X, Taguchi T. Mechanical properties of nerve roots and rami radiculares isolated from fresh pig spinal cords. Neural Regen Res. 2015;10:1869–1873. doi: 10.4103/1673-5374.170319. [DOI] [PMC free article] [PubMed] [Google Scholar]
- 15.Okazaki T, Kanchiku T, Nishida N, Ichihara K, Sakuramoto I, Ohgi J, Funaba M, Imajo Y, Suzuki H, Chen X, Taguchi T. Age-related changes of the spinal cord: A biomechanical study. Exp Ther Med. 2018;15:2824–2829. doi: 10.3892/etm.2018.5796. [DOI] [PMC free article] [PubMed] [Google Scholar]
- 16.Ono K, Ota H, Tada K, Yamamoto T. Cervical myelopathy secondary to multiple spondylotic protrusions. A clinicopathologic study. Spine. 1977;2:109–125. [Google Scholar]
- 17.Ono K, Yonenobu K, Miyamoto S, Okada K. Pathology of ossification of the posterior longitudinal ligament and ligamentum flavum. Clin Orthop Relat Res. 1999;359:18–26. doi: 10.1097/00003086-199902000-00003. [DOI] [PubMed] [Google Scholar]
- 18.Penning L. Some aspects of plain radiography of the cervical spine in chronic myelopathy. Neurology. 1962;12:513–519. doi: 10.1212/wnl.12.8.518. [DOI] [PubMed] [Google Scholar]
- 19.Shimomura Y, Hukuda S, Mizuno S. Experimental study of ischemic damage to the cervical spinal cord. J Neurosurg. 1968;28:565–581. doi: 10.3171/jns.1968.28.6.0565. [DOI] [PubMed] [Google Scholar]
- 20.Taylor AR. Mechanism and treatment of spinal-cord disorders associated with cervical spondylosis. Lancet. 1953;6763:717–720. doi: 10.1016/s0140-6736(53)91847-9. [DOI] [PubMed] [Google Scholar]


