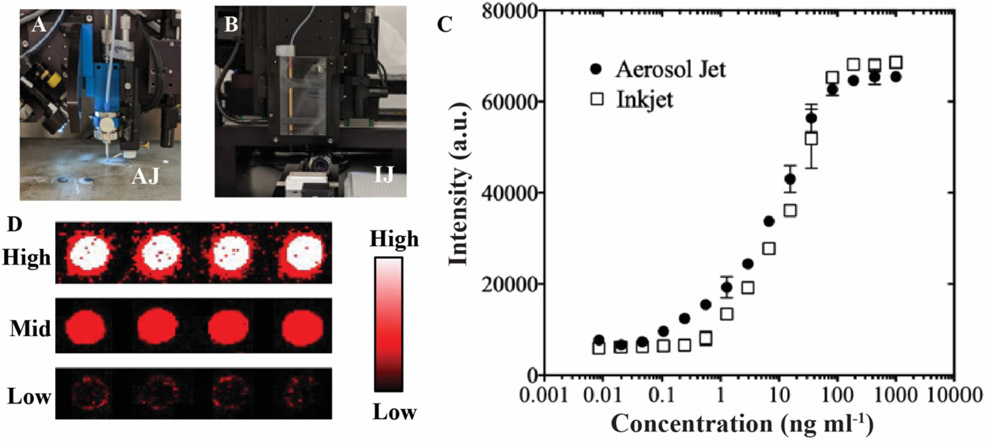
Figure 4.
Printed anti-CEA immunoassay comparing u-AJP to IJP. Photographs of (A) Optomec aerosol jet printer head and (B) Scienion inkjet printer head. C) Dose-response curves from u-AJ and IJ printed anti-CEA assays with a spot size of ~130 μm. Data represent average ± SD of 3 separately run assays. D) Characteristic fluorescence response of printed anti-CEA capture antibody against spiked CEA antigen concentration at high (top), middle (mid), and low (bottom) CEA concentrations.

