

Abstract
Gastrointestinal (GI) disturbances are one of the earliest symptoms affecting most patients with Parkinson’s disease (PD). In many cases, these symptoms are observed years before motor impairments become apparent. Hence, the molecular and cellular underpinnings that contribute to this early GI dysfunction in PD using a relevant animal model has actively been explored. The MitoPark model is a chronic, progressive mouse model recapitulating several key pathophysiological aspects of PD. However, GI dysfunction and gut microbiome changes have not been categorized in this model. Herein, we show that decreased GI motility was one of the first non-motor symptoms to develop, evident as early as 8 weeks with significantly different transit times from 12 weeks onwards. These symptoms were observed well before motor symptoms developed, thereby paralleling PD progression in humans. At age 24 weeks, we observed increased colon transit time and reduced fecal water content, indicative of constipation. Intestinal inflammation was evidenced with increased expression of iNOS and TNFα in the small and large intestine. Specifically, iNOS was observed mainly in the enteric plexi, indicating enteric glial cell activation. A pronounced loss of tyrosine hydroxylase-positive neurons occurred at 24 weeks both in the mid-brain region as well as the gut, leading to a corresponding decrease in dopamine (DA) production. We also observed decreased DARPP-32 expression in the colon, validating the loss of DAergic neurons in the gut. However, the total number of enteric neurons did not significantly differ between the two groups. Metabolomic gas chromatography-mass spectrometry analysis of fecal samples showed increased sterol, glycerol, and tocopherol production in MitoPark mice compared to age-matched littermate controls at 20 weeks of age while 16s microbiome sequencing showed a transient temporal increase in the genus Prevotella. Together, the data shed more light on the role of the gut dopaminergic system in maintaining intestinal health. Importantly, this model recapitulates the chronology and development of GI dysfunction along with other non-motor symptoms and can become an attractive translational animal model for pre-clinical assessment of the efficacy of new anti-Parkinsonian drugs that can alleviate GI dysfunction in PD.
Keywords: Parkinson’s disease, gastrointestinal motility, microbiome, non-motor symptoms, translational research, intestinal inflammation
Introduction
Parkinson’s disease (PD) is a chronic and progressive neurological disorder mainly caused by the loss of DAergic neurons present in the substantia nigra region of the brain. This disorder displays an array of symptoms, the most prominent of which is a sustained loss of motor control leading to bradykinesia, resting tremor, muscle rigidity, postural instability, and poor coordination. Since the publication of the medical essay “The Shaking Palsy” by Dr. James Parkinson, PD has been recognized as a multicentric disease affecting even the autonomic and enteric nervous systems (ENS). Both retrospective studies and clinical observations of PD patients have shown the presence of many non-motor symptoms that may precede motor symptoms often decades before diagnosis (Magerkurth et al., 2005; Tibar et al., 2018). The common non-motor symptoms include depression and anxiety, constipation, hyposmia, and sleep disturbances (Chen et al., 2013). An increasing number of studies have reported gastrointestinal (GI) problems, especially constipation, in 25-80% of PD patients. Aside from constipation, PD patients experience several other GI symptoms as well, including dysphagia, excessive drooling, nausea, and dyspepsia (Cersosimo and Benarroch, 2012; Pfeiffer, 2003).
GI motility is controlled by neural and hormonal signals arising from the central and peripheral nervous systems. Notably, the ENS plays an important role in maintaining a healthy GI physiology by influencing smooth muscle contraction and relaxation, the absorption of nutrients, and cross-talk with the immune cells patrolling the GI tract (Hansen, 2003). Of the many neurotransmitters that are produced in the GI tract, DA and serotonin are two important neurotransmitters involved in GI motility. Depending on the receptor subtype and location, both neurotransmitters modulate excitatory and inhibitory signals leading to location-specific contraction or relaxation of the GI tract. This complex signaling process results in coordinated peristalsis of the gut, thus enabling nutrient absorption and proper waste removal. In the case of PD, an imbalance in DA secretion and/or reuptake is speculated to induce irregular peristalsis (Anderson et al., 2007; Greene et al., 2009), which can lead to overgrowth of bacteria in the small bowel, sub-optimal nutrient absorption, and inadequate defecation. Furthermore, this irregularity in intestinal transit, and hence absorption, may also be an important reason why l-DOPA administered orally- despite being the therapeutic agent of choice given to PD patients - still shows inconsistent success in alleviating motor dysfunctions. In fact, prolonged medication with antiparkinsonian drugs can lead to constipation. To date, several ex vivo studies on intestinal smooth muscle have been carried out; however, the results differ among these studies due to varying sample preparation as well as the use of non-selective agonists or antagonists (Walker et al., 2000). Similarly, toxin-based rodent models of PD also show inconsistent results with regards to the small and large intestinal motility deficits seen in human PD patients (Anderson et al., 2007; Greene et al., 2009; Pellegrini et al., 2016). Hence, an in vivo model of PD that faithfully reproduces most of the GI symptoms seen in PD would prove invaluable.
The MitoPark (MP) mouse model is generated by the cre/lox system wherein the mitochondrial transcription factor A (TFAM) is selectively removed from DAergic (DAT-positive) neurons (Ekstrand et al., 2007). This results in the progressive development of motor symptoms, notably loss of coordination and muscle rigidity. Previously, we demonstrated that the MitoPark model could be used for testing neuroprotective compounds (Ay et al., 2017; Langley et al., 2017). Other groups have shown the development of non-motor symptoms such as changes in circadian rhythm as well as anxiety or depression in the MP mouse model (Ekstrand et al., 2007; Galter et al., 2010). However, despite being an important non-motor symptom, GI disturbances in this model have not been described. Hence, the aim of this study was to comprehensively characterize GI motility, gut-microbiome dysbiosis, intestinal inflammation and metabolic profile using neurochemical, genomic and metabolomic approaches.
Materials and Methods
Chemicals
Mouse monoclonal β-actin antibody was purchased from Sigma-Aldrich (St. Louis, MO). Antibodies for PGP9.5 (rabbit, polyclonal, Cat # AB1761-I), GFAP (mouse, monoclonal, Cat # MAB3402) and tyrosine hydroxylase (TH, Cat. # MAB318) were purchased from Millipore (Billerica, MA), while iNOS (rabbit, polyclonal, Cat # sc-651) and Bax (rabbit, polyclonal, Cat # sc-493) antibodies were purchased from Santa Cruz Biotechnology (Dallas, TX). Hoechst 33342 nuclear stain was purchased from Invitrogen (Thermo Fisher, Carlsbad, CA) and Carmine red was obtained from Sigma-Aldrich (Cat # C1022).
Experimental design
MP mice were kindly provided by Dr. Nils-Goran Larson at the Karolinska Institute, Stockholm (Ekstrand et al., 2007). MP mice (DAT+/Cre:TFAMLoxP/LoxP, C57BL/6 background) and their littermate controls (LCs) (DAT+/+:TFAM+/LoxP, C57BL/6 background) were fed ad libitum (ENVIGO, Teklad S-2335 mouse breeder diet). They were individually housed in Innovive cages (M-BTM-C8E-1) with unrestricted access to an Innovive water bottle (M-WB-300A) and maintained at 22°C under a 12-h light/dark cycle under standard conditions approved and supervised by the Institutional Animal Care and Use Committee (IACUC) at Iowa State University. Mice were randomized into two groups based on weight (n = 8-10 per group; 4 males and 4 females in LC group; 5 males and 5 females in MP group). Animals were weighed weekly and subjected to behavioral tests every four weeks. Prior to the study, mice were acclimated to handling to reduce stress and the same person performed all behavior tasks to reduce inter-person variability. At age 24 weeks, mice were euthanized via CO2 followed by cervical dislocation. GI tissues (colon, ileum, and duodenum), as well as various microdissected brain tissues, were collected and stored at −80°C until further neurochemical, biochemical, and histological studies could be performed.
In vivo GI motility assessment
Gastric emptying
Gastric emptying was performed on 24-week-old MP and LCs. Prior to the experiment; mice were fasted for 12 h with free access to water. At the time of the experiment, mice were placed in separate clean cages and had access to pre-weighed food pellets for 1 h. The amount of food consumed was calculated based on food weight prior to and after access. Two hours after food was removed, animals were sacrificed and their stomachs removed. Gastric emptying was calculated according to the following formula: gastric emptying (%) = [1 - (weight of food in stomach/weight of food intake)] x 100 (Tasselli et al., 2013).
Whole-gut transit time (WGTT)
Carmine red is a red dye that is not absorbed by the gut during digestion but excreted with other waste products. Hence, a solution of this dye was used to determine total GI transit time in MP and LC mice from ages 8 to 24 weeks. A solution of carmine red (60 mg/mL) in 0.5% (vol/vol) carboxymethyl cellulose was administered by oral gavage using a 24-ga round-tip feeding needle (Tasselli et al., 2013). The volume of carmine red solution used for each animal was calculated based on animal weight (0.3 mg/g body weight). Based on pilot studies, we found that following carmine red administration via oral gavage, animals did not expel red fecal pellets for one hour. Hence, starting one hour after oral gavage, animals were monitored at 15-min intervals for the presence of carmine red. Again, prior pilot studies indicated that most mice showed red fecal pellets by 7 h post-gavage and hence the experiment was terminated after 8 h. Total GI transit time represented the time interval between the initiation of gavage and the first observance of carmine red in the stool. Animals whose stool had no dye even after a maximum observation time of 8 h were recorded as >8 h.
Bead latency
Distal colonic motility was measured by the bead latency test. Mice were anesthetized with isoflurane, and a lubricated, 2-mm diameter glass bead was inserted into the distal colon to a total depth of 2 cm from the anal margin using a fire-polished glass rod. After insertion of the bead, mice were isolated in clear plastic cages without food and water. The time required for expulsion of the glass bead was recorded, which was typically less than 15 min.
One-hour stool collection
Each mouse was placed in a separate clean cage without food and water for one-hour stool collection. Fresh fecal pellets were collected immediately after expulsion, and to avoid drying, placed in tared 1.5-mL micro-centrifuge tubes and weighed to obtain total wet weight of the stool. Following overnight drying at 65°C, the tubes were reweighed to obtain the dry weight. Total dry and wet stool weights as well as stool water content [(Wet weight – dry weight)/wet weight] x100 were calculated. Additional metrics included total number of fecal pellets and stool frequency.
Western blot
Colon tissues from MP and LC groups were homogenized in a bullet blender (Next Advance, Troy, NY) using 2-mm diameter stainless steel beads. Tissue lysates were prepared using modified radioimmunoprecipitation assay (RIPA) buffer containing 20 mM Tris-HCl, pH 8.0, 2 mM EDTA, 10 mM EGTA, 2 mM dithiothreitol (DTT), 1 mM phenylmethylsulfonyl fluoride (PMSF), 20 mM sodium orthovanadate, 1 mM sodium fluoride and protease and phosphatase inhibitor cocktail (Thermo Scientific, Waltham, MA), as described previously [30, 31]. The supernatants were obtained after centrifuging the homogenates at 13,500 x g for 60 min. Protein concentration was measured using a Bradford dye (Bio-Rad, Hercules, CA). Lysates containing equal amounts of protein were separated on a 12 or 15% SDS-polyacrylamide gel. After separation, proteins were electroblotted onto a nitrocellulose membrane, and nonspecific-binding sites were blocked with LI-COR (Lincoln, NE) blocking buffer. TNFα (1:1000), iNOS (1:500) and β-actin (1:10000) primary antibodies were used to blot the membranes for 16 h at 4°C. Thereafter, blots were washed for 1 hour in phosphate-buffered saline (PBS) containing 0.01% Tween-20, and then incubated in respective secondary antibodies (Alexa goat anti-mouse 680 or Alexa goat anti-rabbit 790). Fluorescent bands corresponding to the protein of interest were observed by scanning membranes on a LI-COR scanner. Full Western blots for all experiments are shown in Supplementary Figure 2.
Quantitative real-time PCR (qRT-PCR)
Colon tissues from MP and littermate mice designated for qRT-PCR (n=6) were homogenized in a bullet blender using DNase- and RNase-free stainless steel beads, and RNA was extracted using an RNeasy Plus Mini kit (Qiagen, Germantown, MD). Total RNA (1 μg) was converted to cDNA using the High-Capacity cDNA Reverse Transcription kit (Applied Biosystems, Waltham, MA) following manufacturer’s instructions. Real-time PCR was performed in an Mx3000P QPCR system (Stratagene, La Jolla, CA) using the Brilliant SYBR Green QPCR Master Mix kit (Stratagene), with cDNAs corresponding to 1 μg of total RNA, 10 μl of 2 × master mix and 0.2 μM of each primer in a 20-μl final reaction volume. All reactions were performed in triplicate. Mouse 18S rRNA was used as an internal standard for normalization. Primers specific for NpY (accession No: NM_023456) were synthesized at the Iowa State University DNA Facility, while 18S rRNA primers were obtained from Qiagen (Cat# QT02448075). The PCR cycling conditions contained an initial denaturation at 95°C for 10 min, followed by 40 cycles of denaturation at 95°C for 30 sec, annealing at 60°C for 30 sec, and extension at 72°C for 30 sec. Fluorescence was detected during the annealing step of each cycle. Dissociation curves were run to verify the singularity of the PCR product. Data were analyzed using the comparative threshold cycle (Ct) method.
Immunohistochemistry
At the end of treatment, animals were perfused first with PBS followed by 4% paraformaldehyde. Guts were removed and post-fixed in 10% formalin for an additional 24 h. Tissues were embedded in paraffin and sectioned at 7 μm at Iowa State University’s Veterinary Pathology Lab. Paraffin-embedded sections of mouse tissues were deparaffinized in a series of decreasing alcohol concentrations. Heat-mediated antigen retrieval was performed using 10 mM citrate buffer (pH 6.0) for 30 min. Sections were then incubated with blocking reagent (5% normal goat serum, 2% bovine serum albumin and 0.5% Triton X-100 in PBS) for 60 min before being incubated with TUJ (1:500), iNOS (1:500), or GFAP (1:300) primary antibodies for 16 h at 4°C. Sections were then washed many times in PBS and incubated in the dark for 90 min with Alexa-488 and -555 dye-conjugated secondary antibodies (1:1500). Nuclei were stained with Hoechst dye. Slides were viewed with 63× and 43× oil objectives using a Leica DMIRE2 confocal microscope (Leica Biosystems, Lincolnshire, IL).
Monoamine assessment via high-performance liquid chromatography (HPLC)
Dissected colon and ileal segments were placed in a buffer comprising 0.2 M perchloric acid, 0.05% Na2EDTA, 0.1% Na2S2O5, and isoproterenol (internal standard) and stored at −80°C until lysate preparation. To extract monoamine neurotransmitters, the samples were homogenized using a bullet blender and 0.2-mm diameter stainless steel beads. Lysates were centrifuged and 300 μL of lysate was added to 30 mg alumina. Lysate pH was quickly increased to 8.6 using 1 M Tris buffer. Lysates were mixed in a rotating shaker at 4°C for 15 min and then centrifuged at 10,000 x g. Supernatants were aspirated and the monoamine neurotransmitters were eluted from the alumina with 0.2 M perchloric acid. Monoamine lysates were placed in a refrigerated automatic sampler (model WPS-3000TSL) until being separated isocratically by a reversed-phase C18 column with a flow rate of 0.6 mL/min using a Dionex Ultimate 3000 HPLC system (pump ISO-3100SD, Thermo Scientific, Chelmsford, MA). Electrochemical detection was achieved using an ESA CoulArray model 5600A (Thermo Fisher) coupled with an analytical cell (microdialysis cell 5014B) and a guard cell (model 5020) with cell potentials set at −350, 0, 150, and 220 mV. Data acquisition and analysis were performed using Chromeleon 7 and ESA CoulArray 3.10 HPLC software and quantified data were normalized to wet tissue weight.
Non-targeted metabolite profile analysis by GC-MS
Metabolite extracts were prepared from MP and LC stool collected at ages 8, 12, 16, 20 and 24 weeks. The samples were initially dried for 4 h at 55°C to remove water. To extract the metabolites for the GC-MS analysis, we followed methods described by the Metabolomics Standards Initiative (Members et al., 2007) with slight modifications. The samples were spiked with two internal standards: 10 μg of ribitol and 25 μg nonadecanoic acid for polar and non-polar fractions, respectively. We added 0.35 mL of hot (60°C) methanol to ~30 mg of dried stool from each MP and LC sample. Samples were incubated at the same temperature for 10 min, followed by sonication for 10 min at full power. To this slurry, 0.35 mL of chloroform and 0.3 mL of water were added and the mixture was vortexed for 1–3 min. After centrifugation for 5 min at 13,000 x g, 200 μL of the upper phase (polar fraction) and 200 μL of the lower phase (non-polar fraction) were separately removed into 2-mL GC-MS vials and dried in a Speed-Vac concentrator (model SVC 100H, Savant, NY). The samples were then methoximated and silylated. For methoximation, 50 μL of 20 mg/mL methoxyamine hydrochloride dissolved in dry pyridine was added. The reaction mixture was shaken at 30°C for 1.5 h. Silylation was performed by adding 70 μL of N, O-Bis (trimethylsilyl) trifluoroacetamide (BSTFA) with 1% trimethylchlorosilane (TMCS) and incubating at 65°C for 30 min. One microliter of the derivatized samples was injected into the GC-MS in splitless mode. GC-MS analysis was performed using an Agilent (Santa Clara, CA) 6890 GC interfaced to an Agilent 5973 quadrupole MS with an HP-5ms (5%-Phenyl)-methylpolysiloxane column (LxBxH, 30 m × 0.25 mm × 0.25 μm, Agilent). The inlet temperature was maintained at 230°C. The initial temperature was set to 70°C followed by a 5°C/min ramp to 320°C with a constant helium flow rate at 1.0 mL/min. The interface temperature was maintained at 280°C. Agilent ChemStation software controlled the GCMS. Metabolite identification was performed by comparing the mass spectra to the NIST14 library and an in-house library using retention indices. To perform a semi-quantitative assessment, the peak intensity of each quantified ion was calculated and normalized to the peak intensity of one of the internal standards, either ribitol (for polar compounds) or nonadecanoic acid (for non-polar compounds). In addition, missing intensities were imputed by the half-of-the-minimum rule before normalization to tissue weight to evaluate the amount of each metabolite per gram of fecal content.
16S sequencing of stool samples
Samples were submitted to the Iowa State University DNA Facility for metagenomic analysis using amplification of the V3-V4 hypervariable region of the bacterial 16S rRNA gene. All samples were processed according to the routine methodology of the core laboratory. Briefly, amplicons were synthesized using a universal 16S forward primer (515F) and 100 unique Golay barcoded reverse primers (806R) as described by Caporaso et al. (Caporaso et al., 2011). Appropriate positive and negative controls were included by the sequencing facility. Sample library DNA concentrations were quantified and samples were pooled with equal amounts of DNA. The pooled libraries were cleaned up with the MO-BIO UltraClean PCR Clean-Up Kit and the concentration was then diluted to 2 nM. A single flow cell lane of 300-bp paired-end sequences was run on the Illumina MiSeq. Forward and reverse reads from the paired-end sequencing were first merged using the fastq.join script. Qiime 1.9 was then used for additional data analysis. De-multiplexing and quality filtering were then performed using the split_libraries_fastq.py script. The pick_ reference_otus_through_otu_table.py script was used for operational taxonomic unit (OTU) calling and taxonomic assignment based on the Greengenes database was performed. Raw 16S sequencing reads have been deposited at the National Center for Biotechnology Information (NCBI) with BioProject accession PRJNA559904. The 52 samples have accession numbers SAMN12562802 through SAMN12562853.
Statistical evaluation
Data are expressed as the mean ± SEM. Unpaired t-test or two-way ANOVA followed by post hoc analysis using the Sidak method were performed using GraphPad Prism 6 (GraphPad Software Company). Results were considered statistically significant at p≤0.05. The metabolites log-concentrations were analyzed using mixed-effects models that included the fixed main effects due to group (two levels: MP and Littermate), fixed main effects due to the time points (five levels: 8, 12, 16, 20, 24) interaction between the two factors and mouse-specific random effects. Metabolites that had more than 20% missing rate originally were dropped from the analysis. A false discovery rate (FDR) adjustment was used to account for multiplicity of the overall F-tests for each of the metabolites. The mixed-effects models were fitted and analyzed by R statistical software using lmerTest and emmeans packages.
Results
MitoPark mice exhibit age-dependent weight loss
For this study, 8-week-old mice were weighed once monthly for 4 months to assess changes in body weight (Figure 1A). Compared to age-matched LCs, MP mice began displaying significantly lower body weights from age 20 weeks (Figure 1B) onward. These mice continued to steadily lose weight, and by study’s end at age 24 weeks, the MP group averaged only 24 g compared to the LC average of 37 g. To assess whether weight loss stemmed in part from intestinal dysmotility, we also measured food intake of both groups prior to concluding the study. When food was presented to fasted mice for 1 h during the gastric emptying test, we found no difference in food intake between MPs and LCs even at age 24 weeks when the MP mice showed extensive weight loss (Figure 1C). Knowing that the gut-brain axis modulates appetite and hence feeding behavior, we probed the hypothalamus of 24-week-old MP and LC mice for the known appetite modulator neuropeptide Y (NpY). In the hypothalamus, NpY increases following fasting/food deprivation with the levels falling following food consumption (Hanson and Dallman, 1995; Schwartz et al., 1998). Here, we observed increased mRNA expression of NpY in the hypothalamus of 24-week-old MP mice when compared to LCs (Figure 1D). Of particular note, these mice had not been fasted for our gut motility studies and always had free access to standard laboratory food pellets. This increased NpY is possibly in response to poor nutrient absorption and subsequent weight loss in these mice.
Figure 1: Age-dependent weight loss in MitoPark mice.
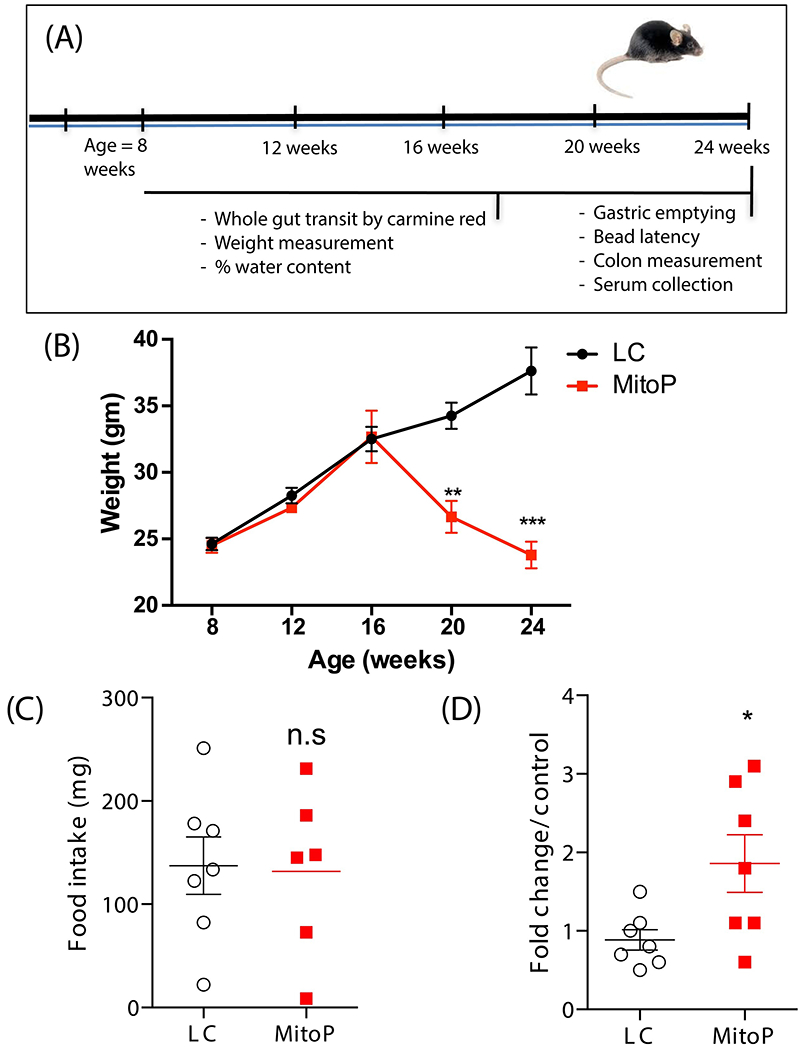
(A) Treatment paradigm. (B) Body weights measured over the duration of the study showing progressive weight loss in MP mice. (C) Food intake of both groups at age 24 weeks. Food intake was measured by weighing food pellets before and after a 1-hour feeding time. No difference in pellet weight (mg), representing food consumed in 1 hour, was observed between groups. (D) qRT-PCR analysis of NpY mRNA transcript, normalized to 18S rRNA expression. Data represented as the group mean ± SEM from n=6-7. For (A), data were analyzed by two-way ANOVA followed by Sidak’s post hoc test. For (B) and (C), data were analyzed by two-tailed t-test. Asterisks (*p<0.05, **p<0.01 and ***p<0.001) indicate significant differences between MP and LCs; n.s = no statistical significance; MitoP, MitoPark; LC, littermate control.
Spatial differences in gastrointestinal motility between MitoPark and age-matched control mice
MP mice gradually lose DAergic neurons and show an age-dependent progression of motor and non-motor symptoms when compared to age-matched healthy mice (Galter et al., 2010; Langley et al., 2018; Li et al., 2013). However, the GI dysfunction that is seen in almost 80% of PD patients is not well characterized in this model. To address this, we first assessed whole gut transit time (WGTT) in MP mice, which measures GI motility from the time food enters the stomach until it is removed from the body as waste. Curiously, from age 8 weeks onward, MP mice exhibited a lower WGTT compared to LCs and the effect progressed over time, indicating an enhanced GI motility in MP mice (Figure 2A). Next, because different regions of the GI tract are uniquely involved in the processes of digestion, absorption, and waste removal, it is necessary to understand precisely which part of the MitoPark gut is affected. Hence, we evaluated regional motility by measuring gastric emptying and colon transit time. As gastric emptying involves euthanizing the mice and collecting and weighing stomach contents, this study was carried out only once at the culmination of the study. At 24 weeks of age, MP and LC mice showed no difference in gastric emptying (Figure 2B). However, the MP mice had increased colon transit time (CTT) compared to age-matched LCs (Figure 2C), requiring about 20 min to expel the glass bead inserted in the distal colon compared to 4 min for LC mice. The rate of bead expulsion (an indirect measure of the colon’s propulsive action) was determined by dividing colon length (the 2-cm bead insertion distance) by the time required for bead expulsion. The rate of bead movement in the distal colon was significantly decreased in the MP group compared to the LC group (Figure 2D). Similarly, MP mice showed reduced fecal pellet output at age 24 weeks, further suggesting impaired colonic motility in these mice (Figure 2E). Moreover, a trend of lower fecal water content was observed starting from 16 weeks in MP mice (Figure 2F), and by age 24 weeks, these mice displayed significantly lower fecal water content compared to age-matched LCs. Lastly, we measured colon lengths in MP mice. Surprisingly, colon lengths in these mice became gradually shorter when compared to that of the LCs (Figure 2G). Taken together, the results of WGTT, gastric emptying, and CTT suggest that while the time taken for the food to enter the small intestine is the same in both groups, over time in MP mice, peristalsis in the small intestine is increased but subsequently decreased in the large intestine. Importantly, this change in gut motility is observed before MP mice lose body weight, and hence changes in gut motility are not solely dependent upon weight loss.
Figure 2: Region-specific gastrointestinal motility in MitoPark mice.
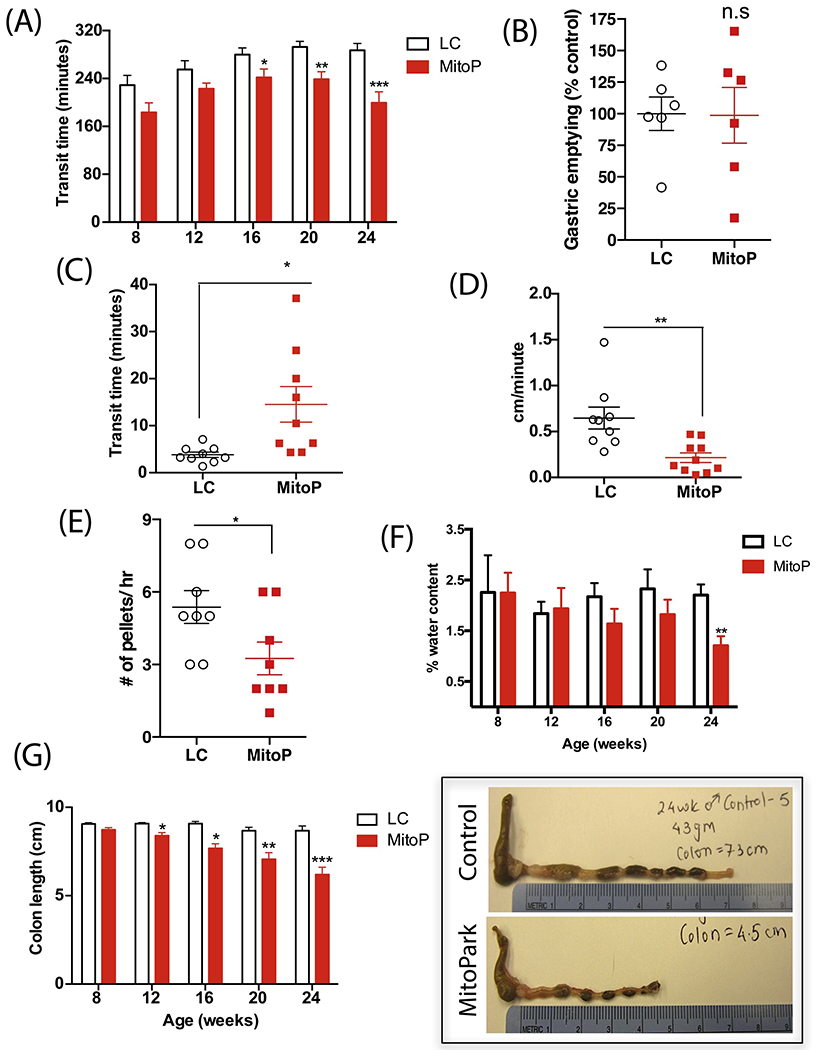
(A) Whole gut transit time. From age 16 weeks onward, MP mice required significantly less time to expel carmine red that had been administered via intragastric gavage. (B) Gastric emptying. At age 24 weeks, MP and LC mice took similar times for ingested food to leave the stomach into the small intestine. (C) Colon transit time and (D) colonic motility rate. At age 24 weeks, MP mice took significantly more time to expel the glass bead inserted 2 cm into the distal colon than did age-matched LCs, thus displaying a constipated behavior. (E) Stool frequency. At age 24 weeks, MP mice expelled significantly fewer fecal pellets than LCs. (F) Fecal water content. MP mice progressively show lower water content in their fecal pellets, indicating constipation. (G) Colon length in centimeters. Representative photographs exhibiting smaller colon length in 24-week-old MP mice compared to LCs. Data represented as the group mean ± SEM from n=6-10. For (A), (F), and (G), data were analyzed by two-way ANOVA followed by Sidak’s post hoc test. For (B-E), data were analyzed by two-tailed t-test. Asterisks (*p<0.05, **p<0.01, and ***p<0.001) indicate significant differences between MP and LC. MitoP, MitoPark; LC, littermate control.
Altered gastrointestinal monoamine neurotransmitter levels but no changes in dopamine receptor expression in MitoPark mice
Previously, MP mice were reported to begin showing reductions in striatal DA with significantly increased DA turnover from age 12 weeks onward (Galter et al., 2010). Since DA also plays an important role in modulating GI motility, we assessed intestinal DA content via HPLC. Tissue concentrations of both DA and its metabolite DOPAC decreased in the colon of 24-week-old MP mice compared to age-matched LCs (Figure 3A). However, the levels of another DA metabolite, homovanillic acid (HVA), and that of serotonin (5-HT) and its main metabolite, 5-hydroxyindoleacetic acid (5-HIAA), remained unchanged in these mice relative to LCs (Figure 3A). These findings indicate an enteric DA deficit in 24-week-old MP mice. We also measured the mRNA levels of prominent DA receptors present in the colon. We found no significant differences in D1R and D2R transcript levels between groups (Figure 3B).
Figure 3: Reduced dopamine levels in the colon of 24-week-old MitoPark mice.
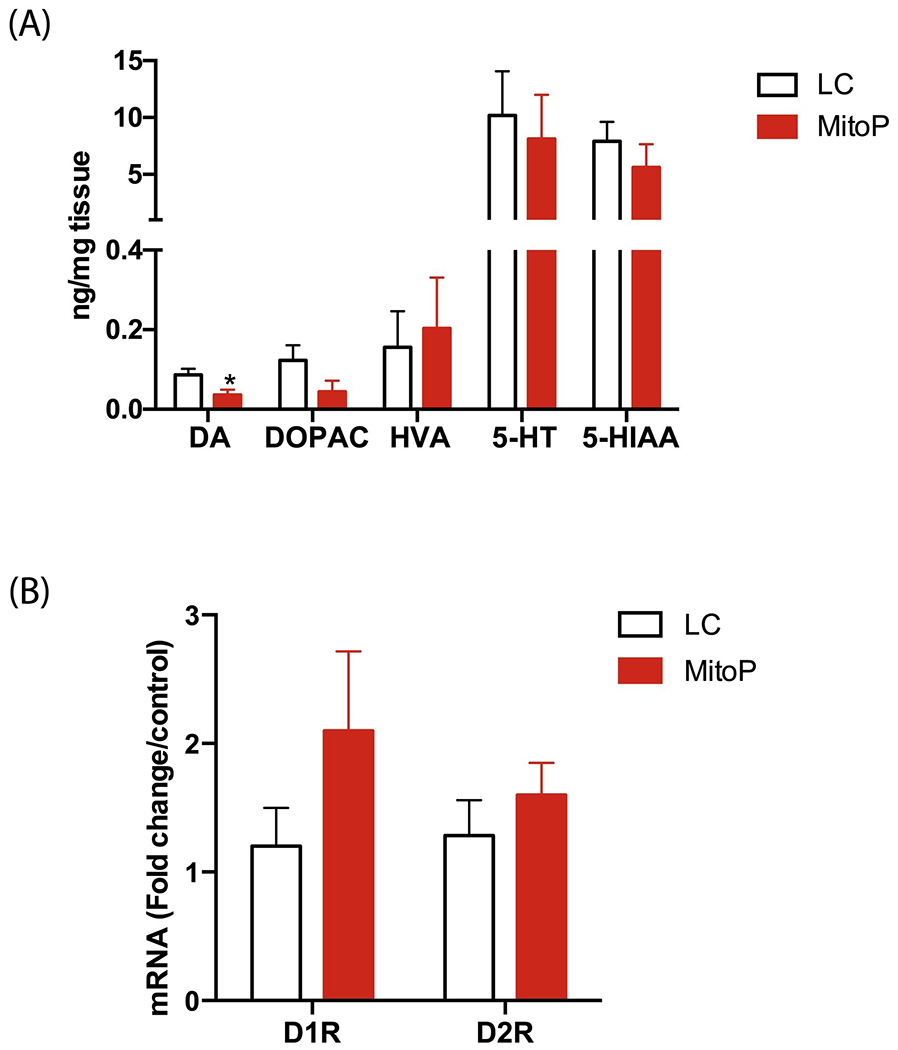
(A) HPLC analysis of monoamine neurotransmitter levels (ng/mg tissue) in the colon. Colonic tissue levels of DA were lower in 24-week-old MP mice than in LCs. (B) DA receptor mRNA transcript levels. No significant group differences in D1R and D2R levels in the colon. Data represented as the group mean ± SEM from n=10 or n=6 and analyzed by two-tailed t-test. Asterisks (*p<0.05) indicate significant differences between MP and LC. MitoP, MitoPark; LC, littermate control.
MitoPark mice develop low-grade intestinal inflammation
Intestinal or systemic inflammation can cause alterations in GI motility. Given the perplexing spatial differences in GI motility in this transgenic model, we characterized the extent of inflammation in the GI tract. In the ileum, which in our study showed higher peristalsis in 24-week-old MP mice, there was no significant difference between inducible nitric oxide (iNOS) protein levels between the groups. However, the expression of tumor necrosis factor-alpha (TNFα) and as well as glial fibrillary acidic protein (GFAP) – a marker of enteric glial cells (EGCs) – trended upward in 24-week-old MP mice compared to age-matched LCs (Figure 4A). EGCs are present not only in association with the neurons in the longitudinal muscle/myenteric (LMMP) and submucosal plexus (SMP), but are also present in the muscle layers and extend into the mucosal villi (Kabouridis et al., 2015). Immunohistochemical (IHC) analysis of GFAP expression showed fewer EGCs in the villi of MP mice (Figure 4B). In the colon (large intestine) of MP mice, we observed significantly higher expression of TNFα and GFAP and a trend of increased iNOS (Figure 5A). Specifically, IHC analysis revealed greater iNOS expression in the LMMP and SMP in the MP colon than in the LC colon (Figure 5B). Interestingly, 24-week-old MP colons also showed significantly lower expression of DARPP-32 (DA- and cAMP-regulated phosphoprotein-32) (Figure 5A). DARPP-32 reportedly serves as a molecular switch modulating pathways involving glutamate and DA via dopaminoceptive neurons, often showing contrasting effects through its interaction with D1 or D2 receptors (Fernandez et al., 2006; Nishi and Shuto, 2017) and is mainly present in DAergic neurons. Together, these results suggest that by age 24 weeks, MitoPark mice are exhibiting low-grade intestinal inflammation. When we also examined whether aggregated α-synuclein or other aggregated protein was altered in the gut, 24-week-old MP colon samples did not differ significantly from LCs in the expression of oligomeric proteins (Figure 5C) or aggregated α-synuclein levels (Figure 5D), indicating that intestinal inflammation is independent of any aggregated protein in the gut.
Figure 4: Mild ileitis in older MitoPark mice.
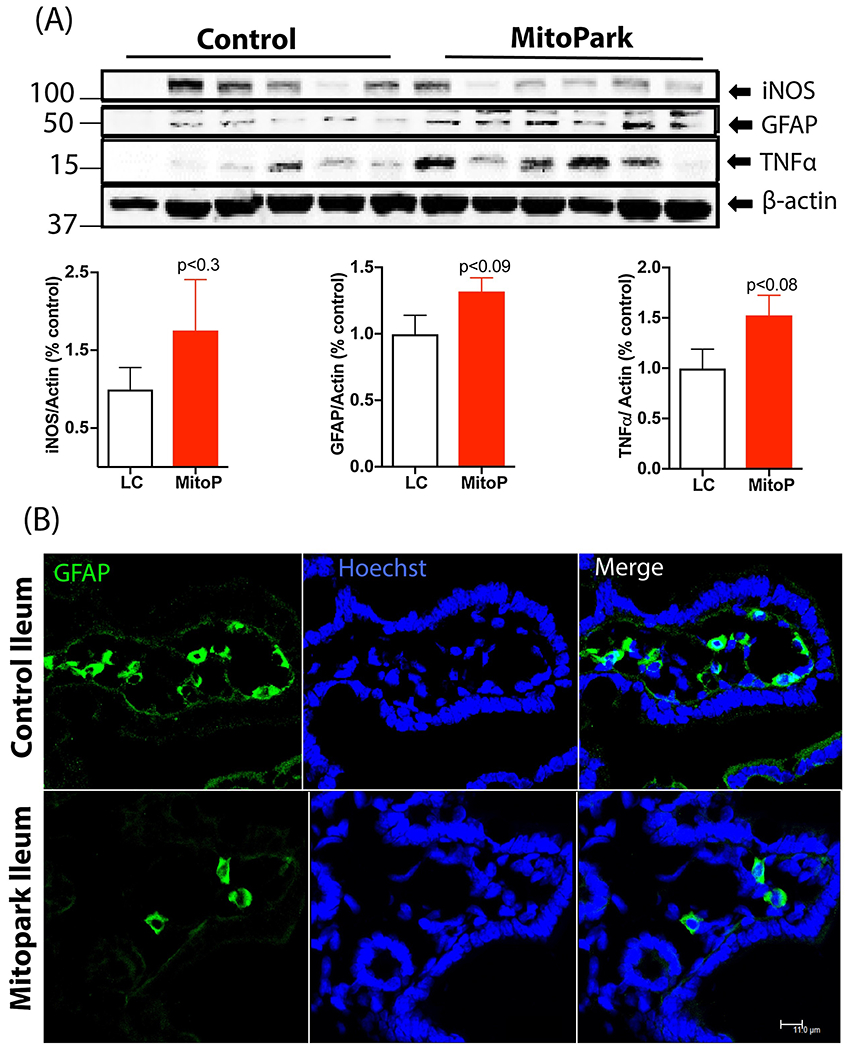
(A) Western blot of ileum samples showing a trend of higher iNOS and TNFα expression in MP mice compared to LCs. Blot intensities were normalized to β-actin and expressed as arbitrary units. (B) Representative 60× images of ileum sections stained with GFAP showing decreased enteric glial numbers in the villi. Scale bar = 11 μm. Data represented as the group mean ± SEM from n=10 or n=6 and analyzed by two-tailed t-test. MitoP, MitoPark; LC, littermate control.
Figure 5: Colonic inflammation in 24-week-old MitoPark mice.
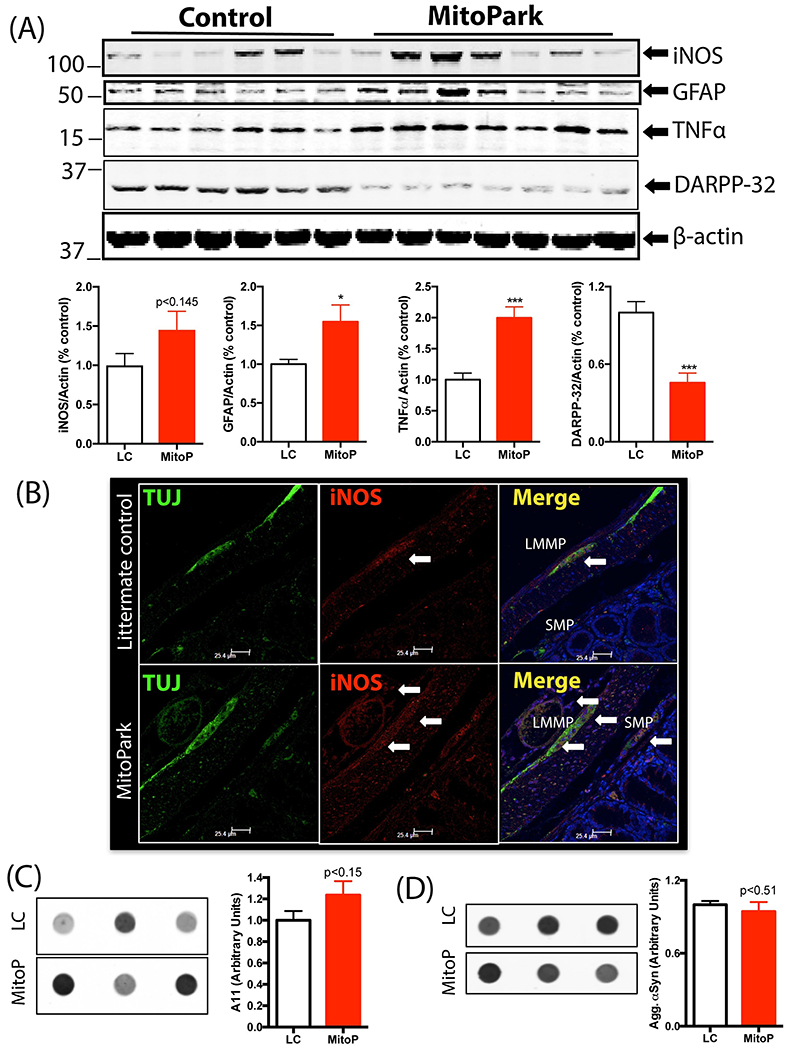
(A) Western blot of colon samples showing increased GFAP and TNFα and decreased DARPP-32 expression in 24-week-old MP mice compared to LCs. Expression of iNOS did not differ significantly between groups. (B) Representative 60× image showing increased expression of iNOS in the myenteric (LMMP) and submucosal plexus (SMP) in 24-week-old MP mice compared to LC. (C) Oligomeric protein detection. Dot blot analysis of oligomeric protein content in the colon of 24-week-old MPs and LCs showed no significant differences between groups. (D) Dot blot analysis of aggregated α-synuclein expression in the colon showed no significant difference between groups. Data represented as the group mean ± SEM from n=6 or 7 and analyzed by two-tailed t-test. Asterisks (*p<0.05 and ***p<0.001) indicate significant differences between MP and LC. MitoP, MitoPark; LC, littermate control.
Dopaminergic neurons in the GI tract are more susceptible to loss than other enteric neurons
The MP mouse model was developed by utilizing the cre/lox system to specifically induce DAergic neuronal loss in these transgenic mice. Consistent with previous findings (Ekstrand et al., 2007; Langley et al., 2018), MP mice experienced a significant loss of TH-positive DAergic neurons and DAergic axon terminals relative to LCs in the substantia nigra and striatum, respectively (S. Figure 1). In the colon, whole-mounts of the LMMP show fewer TH-positive DAergic neurons in MP mice than in age-matched LCs (Figure 6A). As expected in this mouse model, the mRNA levels of TH were reduced in 24-week-old MP colons compared to age-matched LCs (Figure 6B). However, colon sections stained for the pan enteric neuronal marker protein gene product 9.5 (PGP9.5) showed no significant differences between 24-week-old MP mice and LCs (Figure 6C).
Figure 6: Decreased neuronal expression of tyrosine hydroxylase without neuron loss in MitoPark mice.
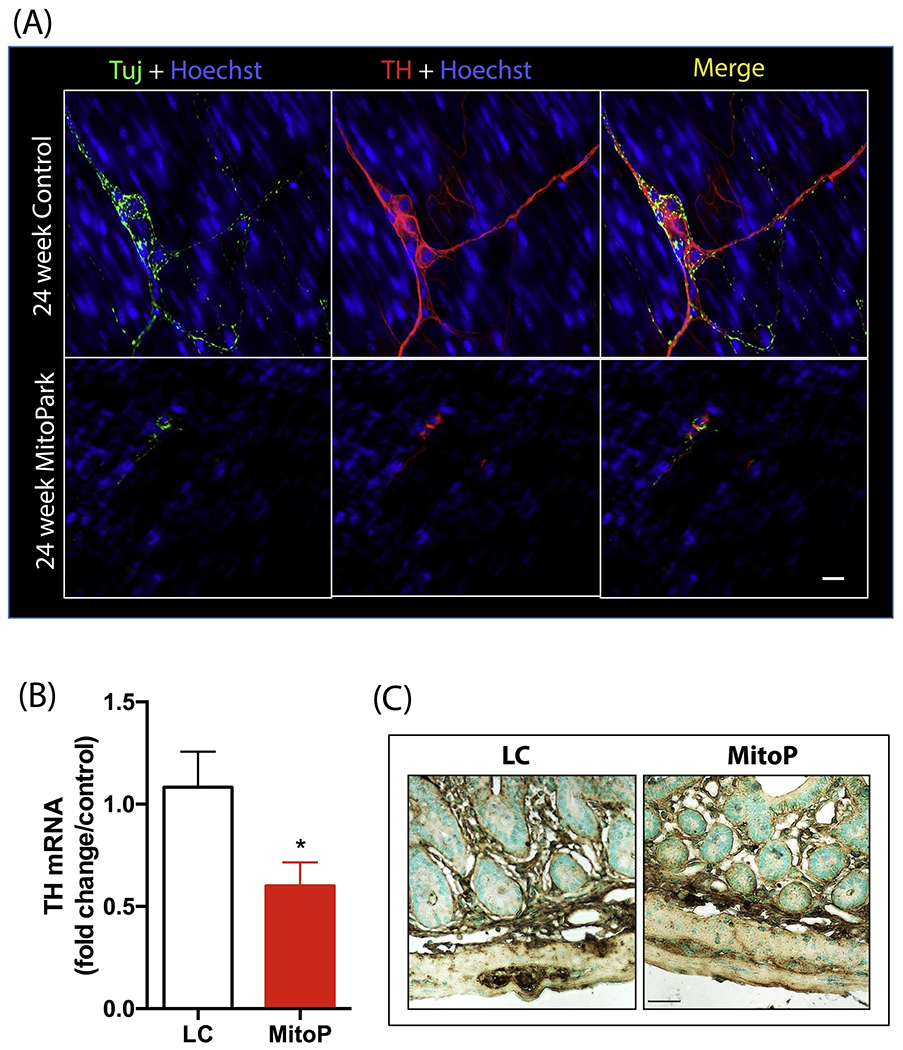
(A) Representative 60× image showing fewer tyrosine hydroxylase (TH)-positive neurons in the myenteric plexus of the colon in MP mice. Scale bar = 7 μm. (B) qRT-PCR analysis of TH mRNA transcript, normalized to 18S rRNA expression (n=6). (C) Representative 40× images of PGP9.5-positive enteric neurons in the colon of LC and MP mice. No significant differences were observed between groups. Scale bar = 35 μm. Data represented as the group mean ± SEM from n=6 or 7 and analyzed by two-tailed t-test. Asterisks (*p<0.05) indicate significant differences between MP and LC. MitoP, MitoPark; LC, littermate control.
Transient changes in the MitoPark fecal metabolome
We evaluated the effect of disease progression on the metabolic profile of the gut microbiome using GC-MS. GC-MS analyses of metabolites extracted from LC and MP fecal samples at ages 8, 12, 16, 20 and 24 weeks detected 418 polar and non-polar analytes of which 207 were chemically identified. These included alcohols, amino acids, fatty acids, and sterols as well as sugars and polyols. From 8 to 24 weeks, certain metabolites including stigmastanol, lignoceric acid, and cholesterol and various fatty acids (FAs), including palmitic and arachidonic acids, showed clear temporal variations (Figure 7A–B) despite no differences between groups. The abundance of most metabolites did not differ significantly between groups for most time points measured. However, at age 20 weeks, 24 metabolites (16 known and 8 unknown compounds) were distinguishable between groups in the heat map (Figure 7C–D). Notably, when compared to an age-matched LC fecal metabolome, fecal samples from 20-week-old MP mice showed elevated levels of FAs such as butenoic and octanoic acids; sterols such as lanosterol, campesterol and sitosterol; fatty acid glycerides such as glycerol monostearate (C18 FA glycerol ester), 2-palmitoylglycerol (C16 FA glycerol ester), deoxycholic acid; and the tocopherols α, β, and γ-tocopherol. It is interesting to note that metabolite differences between LC and MP occurred at the same age when body weight differences became apparent. However, it is not clear why these metabolites showed a transient increase at age 20 weeks before falling to near control levels at age 24 weeks.
Figure 7: Temporal changes in fecal metabolome track disease progression in MitoPark mice.
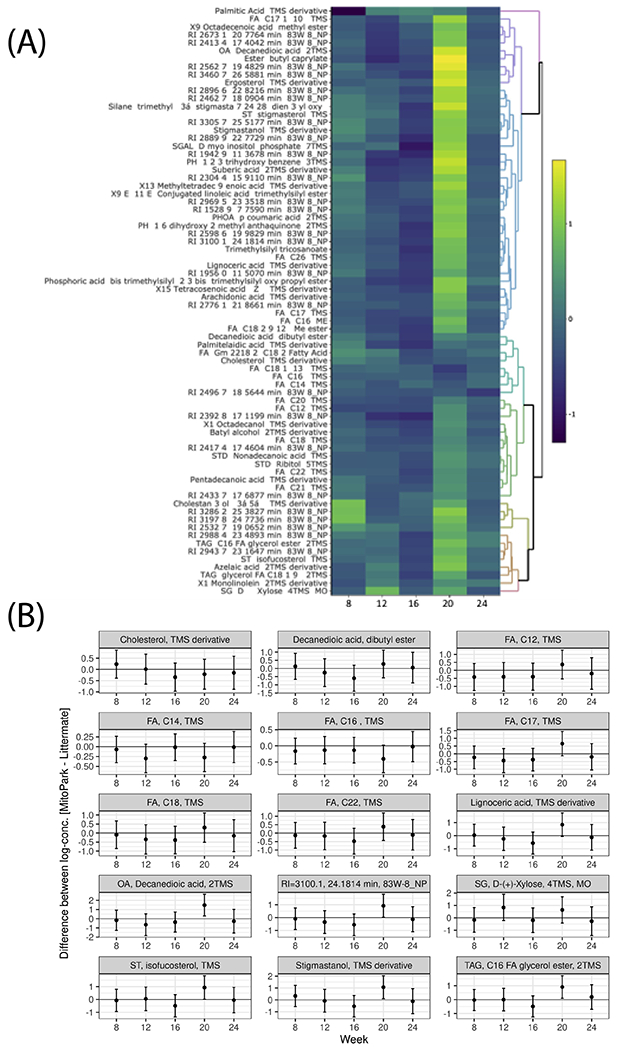
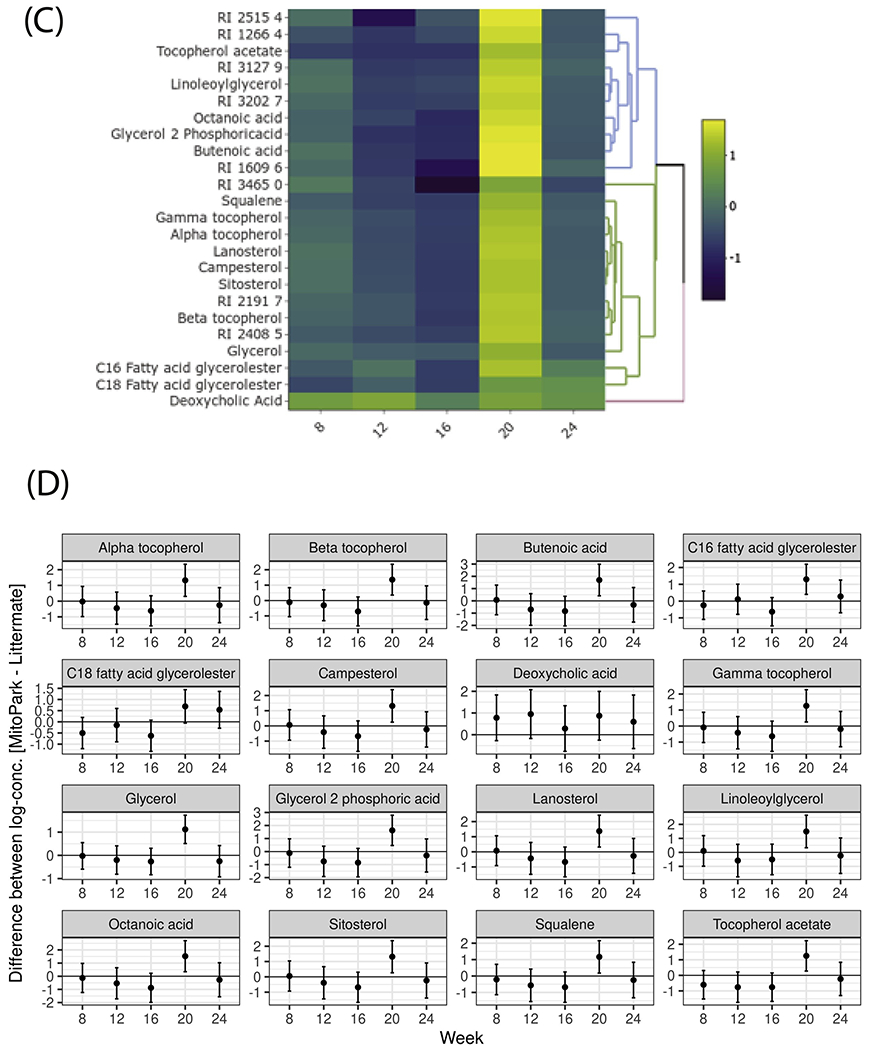
(A) Heat map and (B) paneled plots of metabolites that have a significant temporal variation. (C) Heat-map and (D) paneled plots of metabolites that differ significantly between 20-week-old MP and LC groups (LC n=6; MP n= 3-6).
Phylogenomics analysis of MitoPark mice
To further determine if the disease itself or its progression over time results in changes in the gut microbiome diversity, fecal samples from LC and MP mice were collected at ages 8, 12, 16, 20, and 24 weeks. Then, 16s rRNA sequencing was performed from the DNA extracted from the fecal pellets. Microbial phylogenetic richness as assessed by asymptotic α-diversity (Chaol diversity index, based on abundance of rare OTUs) did not differ between groups over time (Figures 8A). Where α-diversity enumerates the identifiable OTU assignments in LC and MP age-grouped fecal samples, β-diversity is a summation across all groups of the number of unique OTUs found in only one MP or LC age group. Thus, if the microbial community composition of MP mice becomes substantially altered over time, then the β-diversity across the MP and LC age groups will increase. To capture this potential rise in composite phylogenomic variation, we subjected the phylogenomic covariance matrix to principal component analysis (PCA), whose first 3 principal component axes accounted for 36% of total variation, thus indicating only nominal differences in species composition between the groups at all ages (Figure 8B). At the Phylum level, Bacteroidetes was the most abundant phylum in LC and MP samples at all ages and ranged from 56.6 – 81.6% of total reads followed by Firmicutes with reads ranging from 17 – 41% (Figure 8C). Other phyla detected include among others Cyanobacteria, Deferribacteres, and Proteobacteria. No significant differences in phyletic composition existed between MP and LC groups. At the genus level, Prevotella was more abundant in the MP samples than in age-matched LCs and this difference in abundance showed an upward trend with age progression (Figure 8D).
Figure 8: 16s metagenomics analysis of MP and LC fecal samples.
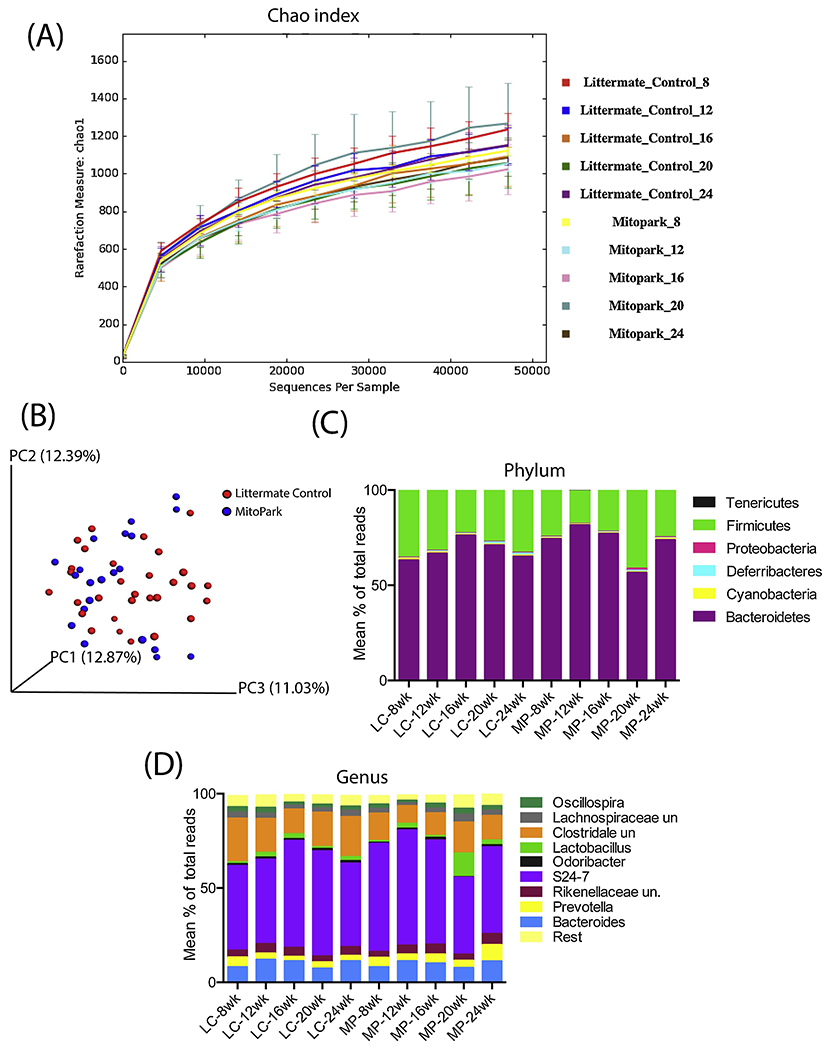
(A) α-diversity measured by Chaol. (B) β-diversity as shown by principal component analysis (PCA) plot showing no significant diversity in microbial communities between age-matched LC and MP groups. (C) Relative abundances of bacterial Phyla among groups over time. (D) Relative abundances of bacterial genera among groups over time. MP, MitoPark; LC, littermate control.
Discussion
GI disturbances have been known to develop in PD patient’s decades before clinical diagnosis of the disease (Mukherjee et al., 2016). More importantly, the continued presence of altered intestinal transit can hamper optimal absorption of anti-Parkinsonian medications thus decreasing the efficacy of these drugs (Bestetti et al., 2017; Mukherjee et al., 2016). The MP transgenic mouse model recapitulates many characteristic symptoms of PD, including a progressive loss of DAergic neurons as well as associated behavioral and motor deficits (Galter et al., 2010). In the present study, we show that GI dysfunction is one of the earliest non-motor symptoms observed in this model, a condition similarly seen in PD patients.
The GI tract includes the stomach, the duodenum, jejunum, and ileum of the small intestine, the large intestine or colon, the appendix/cecum, and rectum. Each part of the GI tract plays an important role in food breakdown, nutrient or electrolyte absorption, and finally, waste formation and removal. As a result, the motility pattern varies from one GI segment to another. The WGTT for MP mice shortened relative to age-matched LCs, but since WGTT measures the time required for carmine red dye to pass through the entire GI tract, it cannot confirm the exact region of dysfunction. Hence, a combination of tests was performed to solve this problem. Subsequently, it was revealed that the MP stomach exhibited a normal gastric emptying rate, but the MP colon showed slower motility than LCs. Together, these results point toward increased peristalsis (constriction and relaxation of intestinal smooth muscles) in the small intestine but reduced peristalsis in the colon. Increased colon transit time has also been demonstrated in GI studies on PD cohorts (Knudsen et al., 2017; Sakakibara et al., 2003). However, conflicting reports have been published on gastric emptying and small intestinal transit time. Some studies report increased gastric emptying and small intestinal transit, while others report no significant differences between younger PD (≤ 65 years) and healthy volunteers (Goetze et al., 2006; Hardoff et al., 2001; Heetun and Quigley, 2012). In most studies conducted, patients were already on 1-DOPA replacement therapies. Long-term 1-DOPA medication has been proven to increase intestinal transit time (Pfeiffer et al., 2012). Therefore, such a major confounding factor must be considered when reporting intestinal dysmotility in patients with PD.
DA receptors (D1R - D5R) present in the GI tract and CNS fall into two classes. D1 and D5 receptors belong to the D1R category comprising mainly post-synaptic receptors present on intestinal smooth muscle cells and blood vessels, whereas D2, D3, and D4 (D2R family of receptors) are present on enteric neurons (Li et al., 2006). DA plays a dual role in the GI tract based on the target receptors and cell type. For instance, DA acts on DA1 receptors on smooth muscles to cause relaxation, while it acts on DA2 receptors present on post-ganglionic sympathetic nerves to cause muscle contraction. In studies on both mice and rats, DA counteracts norepinephrine-induced muscle relaxation thus inducing contraction (Kirschstein et al., 2009; Zizzo et al., 2010). Since our data show spatial differences in GI motility, differential expression of these DA receptor subtypes might be the key to understanding this peculiar phenomenon. In the colon, we did not observe significant group differences in D2 and D1 receptor transcript levels, but we did observe lower levels of DA and significantly lower TH+ expression compared to LCs. Interestingly, Kirschstein et al. (2009) showed that DA exerts differential effects on intestinal smooth muscle contraction, increasing contractions in the proximal while causing gradual relaxation in the distal parts of the gut. This observation is consistent with our results in the MP mouse model. Peristalsis is a coordinated action sequence involving various cell types and neurotransmitters. Hence, sub-optimal dopamine levels in the gut could lead to a reorganization of neurotransmitter receptors (indicating neurochemical plasticity). Also, the loss of innervating dopaminergic neurons in the striatum in PD alters the complex DARPP-32 signaling cascade, resulting in abnormal firing patterns and subsequent motor dysfunction (Brown, 2003; Day et al., 2006). It is possible that the loss of dopaminergic neurons and DARPP-32 expression in the gut, together with the altered neurochemical profile, transformed the enteric circuitry leading to the varied transit times we observed in the MP mouse model.
Another cause of disrupted GI motility is the presence of intestinal inflammation. Increased pro-inflammatory factors can disrupt normal cellular signaling leading to altered intestinal transit times. Evidence of gut inflammation with increased intestinal permeability has been documented in PD patients, thus corroborating the link between intestinal inflammation and PD pathogenesis (Houser and Tansey, 2017; Perez-Pardo et al., 2019; Schwiertz et al., 2018). Our analysis of the MP gut also showed evidence of mild inflammation.
In the ongoing search for biomarkers of PD, various studies have utilized different biofluids from patients and healthy controls with the goal of finding metabolites that correlate disease incidence and severity. Several groups have demonstrated that changes in fatty acids and lipid metabolism correspond to PD progression and severity (LeWitt et al., 2017; Trupp et al., 2014; Zhang et al., 2017) and may contribute to the weight fluctuations seen in a subset of patients. This is similar to our results wherein changes in cholesterol precursors and medium-chain fatty acids were observed in MP mice. An increase in sterol absorption in 20-week-old MP mice compared to LCs supports the notion that this increased absorption may be a response to the rapid weight loss observed in MP mice after age 16 weeks. Surprisingly, we did not find many differences in microbial population numbers or diversity between the groups at any given age. This result differs from other studies involving rotenone gavage that did produce significant differences in microbial α- and β-diversity between control and rotenone-treated mice (Perez-Pardo et al., 2018; Yang et al., 2017). One probable reason for this is that rotenone induces high-grade colonic inflammation and subsequent protein aggregation, neither of which were observed in the MP mouse model nor in human PD patients (Morais et al., 2018). We did observe a trend of higher Prevotella counts at ages 20 and 24 weeks in MP mice than in age-matched LC samples. This genus is known to produce SCFAs but is also implicated in activating immune cells to release pro-inflammatory factors (Levy et al., 2015; Scher et al., 2013).
To conclude, we have characterized GI dysfunction and gut microbiome changes in the MP mouse model of PD. Specifically, we show a progressive loss of normal GI motility with increased transit time in the colon and reduced transit time in the small intestine. At age 24 weeks, MP mice also developed mild intestinal inflammation and a significant decrease in motility presumably due to loss of DA and deregulation in EGC populations. Thus, we demonstrate that the MP mouse model recapitulates early GI dysfunction and constipation similar to PD patients and is an ideal pre-clinical animal model to determine the efficacy and action of new anti-Parkinsonian drugs targeting GI dysfunction.
Supplementary Material
Highlights.
MitoPark mice develop gut motility dysfunction weeks before motor deficits occur.
The MitoPark gut develops persistent, low-grade inflammation.
Metabolomic profile changes in fecal matter before weight-loss.
Temporal changes occur in the composition of the MitoPark gut microbiome.
MitoPark mouse model recapitulates key symptoms of Parkinsonian gut dysfunction.
Acknowledgments
This study was supported by the National Institutes of Health grants NS088206, ES027245, NS100090, and ES026892. The Lloyd and Armbrust endowments to AGK and the Salisbury endowment to AK are also acknowledged. Additional support from Iowa State University’s Presidential Interdisciplinary Research Initiative was also used for the study. We would like to thank Gary Zenitsky for his help in preparing the manuscript.
Footnotes
Publisher's Disclaimer: This is a PDF file of an unedited manuscript that has been accepted for publication. As a service to our customers we are providing this early version of the manuscript. The manuscript will undergo copyediting, typesetting, and review of the resulting proof before it is published in its final form. Please note that during the production process errors may be discovered which could affect the content, and all legal disclaimers that apply to the journal pertain.
Potential Conflicts of Interest
AGK and VA have an equity interest in PK Biosciences Corporation located in Ames, IA. The terms of this arrangement have been reviewed and approved by Iowa State University in accordance with its conflict of interest policies. All other authors declare no potential conflicts of interest.
References
- Anderson G, Noorian AR, Taylor G, Anitha M, Bernhard D, Srinivasan S, Greene JG, 2007. Loss of enteric dopaminergic neurons and associated changes in colon motility in an MPTP mouse model of Parkinson’s disease. Exp Neurol 207(1), 4–12. [DOI] [PMC free article] [PubMed] [Google Scholar]
- Ay M, Luo J, Langley M, Jin H, Anantharam V, Kanthasamy A, Kanthasamy AG, 2017. Molecular mechanisms underlying protective effects of quercetin against mitochondrial dysfunction and progressive dopaminergic neurodegeneration in cell culture and MitoPark transgenic mouse models of Parkinson’s Disease. J Neurochem 141(5), 766–782. [DOI] [PMC free article] [PubMed] [Google Scholar]
- Bestetti A, Capozza A, Lacerenza M, Manfredi L, Mancini F, 2017. Delayed Gastric Emptying in Advanced Parkinson Disease: Correlation With Therapeutic Doses. Clin Nucl Med 42(2), 83–87. [DOI] [PubMed] [Google Scholar]
- Brown P, 2003. Oscillatory nature of human basal ganglia activity: relationship to the pathophysiology of Parkinson’s disease. Mov Disord 18(4), 357–363. [DOI] [PubMed] [Google Scholar]
- Caporaso JG, Lauber CL, Walters WA, Berg-Lyons D, Lozupone CA, Turnbaugh PJ, Fierer N, Knight R, 2011. Global patterns of 16S rRNA diversity at a depth of millions of sequences per sample. Proc Natl Acad Sci U S A 108 Suppl 1, 4516–4522. [DOI] [PMC free article] [PubMed] [Google Scholar]
- Cersosimo MG, Benarroch EE, 2012. Autonomic involvement in Parkinson’s disease: pathology, pathophysiology, clinical features and possible peripheral biomarkers. J Neurol Sci 313(1-2), 57–63. [DOI] [PubMed] [Google Scholar]
- Chen H, Burton EA, Ross GW, Huang X, Savica R, Abbott RD, Ascherio A, Caviness JN, Gao X, Gray KA, Hong JS, Kamel F, Jennings D, Kirshner A, Lawler C, Liu R, Miller GW, Nussbaum R, Peddada SD, Rick AC, Ritz B, Siderowf AD, Tanner CM, Troster AI, Zhang J, 2013. Research on the premotor symptoms of Parkinson’s disease: clinical and etiological implications. Environ Health Perspect 121(11-12), 1245–1252. [DOI] [PMC free article] [PubMed] [Google Scholar]
- Day M, Wang Z, Ding J, An X, Ingham CA, Shering AF, Wokosin D, Ilijic E, Sun Z, Sampson AR, Mugnaini E, Deutch AY, Sesack SR, Arbuthnott GW, Surmeier DJ, 2006. Selective elimination of glutamatergic synapses on striatopallidal neurons in Parkinson disease models. Nat Neurosci 9(2), 251–259. [DOI] [PubMed] [Google Scholar]
- Ekstrand MI, Terzioglu M, Galter D, Zhu S, Hofstetter C, Lindqvist E, Thams S, Bergstrand A, Hansson FS, Trifunovic A, Hoffer B, Cullheim S, Mohammed AH, Olson L, Larsson NG, 2007. Progressive parkinsonism in mice with respiratory-chain-deficient dopamine neurons. Proceedings of the National Academy of Sciences of the United States of America 104(4), 1325–1330. [DOI] [PMC free article] [PubMed] [Google Scholar]
- Fernandez E, Schiappa R, Girault JA, Le Novere N, 2006. DARPP-32 is a robust integrator of dopamine and glutamate signals. PLoS Comput Biol 2(12), e176. [DOI] [PMC free article] [PubMed] [Google Scholar]
- Galter D, Pernold K, Yoshitake T, Lindqvist E, Hoffer B, Kehr J, Larsson NG, Olson L, 2010. MitoPark mice mirror the slow progression of key symptoms and L-DOPA response in Parkinson’s disease. Genes Brain Behav 9(2), 173–181. [DOI] [PMC free article] [PubMed] [Google Scholar]
- Goetze O, Nikodem AB, Wiezcorek J, Banasch M, Przuntek H, Mueller T, Schmidt WE, Woitalla D, 2006. Predictors of gastric emptying in Parkinson’s disease. Neurogastroenterol Motil 18(5), 369–375. [DOI] [PubMed] [Google Scholar]
- Greene JG, Noorian AR, Srinivasan S, 2009. Delayed gastric emptying and enteric nervous system dysfunction in the rotenone model of Parkinson’s disease. Exp Neurol 218(1), 154–161. [DOI] [PMC free article] [PubMed] [Google Scholar]
- Hansen MB, 2003. The enteric nervous system II: gastrointestinal functions. Pharmacol Toxicol 92(6), 249–257. [DOI] [PubMed] [Google Scholar]
- Hanson ES, Dallman MF, 1995. Neuropeptide Y (NPY) may integrate responses of hypothalamic feeding systems and the hypothalamo-pituitary-adrenal axis. J Neuroendocrinol 7(4), 273–279. [DOI] [PubMed] [Google Scholar]
- Hardoff R, Sula M, Tamir A, Soil A, Front A, Badama S, Honigman S, Giladi N, 2001. Gastric emptying time and gastric motility in patients with Parkinson’s disease. Mov Disord 16(6), 1041–1047. [DOI] [PubMed] [Google Scholar]
- Heetun ZS, Quigley EM, 2012. Gastroparesis and Parkinson’s disease: a systematic review. Parkinsonism Relat Disord 18(5), 433–440. [DOI] [PubMed] [Google Scholar]
- Houser MC, Tansey MG, 2017. The gut-brain axis: is intestinal inflammation a silent driver of Parkinson’s disease pathogenesis? npj Parkinson’s Disease 3(1), 3. [DOI] [PMC free article] [PubMed] [Google Scholar]
- Kabouridis PS, Lasrado R, McCallum S, Chng SH, Snippert HJ, Clevers H, Pettersson S, Pachnis V, 2015. The gut microbiota keeps enteric glial cells on the move; prospective roles of the gut epithelium and immune system. Gut Microbes 6(6), 398–403. [DOI] [PMC free article] [PubMed] [Google Scholar]
- Kirschstein T, Dammann F, Klostermann J, Rehberg M, Tokay T, Schubert R, Kohling R, 2009. Dopamine induces contraction in the proximal, but relaxation in the distal rat isolated small intestine. Neurosci Lett 465(1), 21–26. [DOI] [PubMed] [Google Scholar]
- Knudsen K, Fedorova TD, Bekker AC, Iversen P, Ostergaard K, Krogh K, Borghammer P, 2017. Objective Colonic Dysfunction is Far more Prevalent than Subjective Constipation in Parkinson’s Disease: A Colon Transit and Volume Study. J Parkinsons Dis 7(2), 359–367. [DOI] [PubMed] [Google Scholar]
- Langley M, Ghosh A, Charli A, Sarkar S, Ay M, Luo J, Zielonka J, Brenza T, Bennett B, Jin H, Ghaisas S, Schlichtmann B, Kim D, Anantharam V, Kanthasamy A, Narasimhan B, Kalyanaraman B, Kanthasamy AG, 2017. Mito-Apocynin Prevents Mitochondrial Dysfunction, Microglial Activation, Oxidative Damage, and Progressive Neurodegeneration in MitoPark Transgenic Mice. Antioxid Redox Signal 27(14), 1048–1066. [DOI] [PMC free article] [PubMed] [Google Scholar]
- Langley MR, Ghaisas S, Ay M, Luo J, Palanisamy BN, Jin H, Anantharam V, Kanthasamy A, Kanthasamy AG, 2018. Manganese exposure exacerbates progressive motor deficits and neurodegeneration in the MitoPark mouse model of Parkinson’s disease: Relevance to gene and environment interactions in metal neurotoxicity. Neurotoxicology 64, 240–255. [DOI] [PMC free article] [PubMed] [Google Scholar]
- Levy M, Thaiss CA, Zeevi D, Dohnalova L, Zilberman-Schapira G, Mahdi JA, David E, Savidor A, Korem T, Herzig Y, Pevsner-Fischer M, Shapiro H, Christ A, Harmelin A, Halpem Z, Latz E, Flavell RA, Amit I, Segal E, Elinav E, 2015. Microbiota-Modulated Metabolites Shape the Intestinal Microenvironment by Regulating NLRP6 Inflammasome Signaling. Cell 163(6), 1428–1443. [DOI] [PMC free article] [PubMed] [Google Scholar]
- LeWitt PA, Li J, Lu M, Guo L, Auinger P, Parkinson Study Group, D.I., 2017. Metabolomic biomarkers as strong correlates of Parkinson disease progression. Neurology 88(9), 862–869. [DOI] [PMC free article] [PubMed] [Google Scholar]
- Li X, Redus L, Chen C, Martinez PA, Strong R, Li S, O’Connor JC, 2013. Cognitive dysfunction precedes the onset of motor symptoms in the MitoPark mouse model of Parkinson’s disease. PloS one 8(8), e71341. [DOI] [PMC free article] [PubMed] [Google Scholar]
- Li ZS, Schmauss C, Cuenca A, Ratcliffe E, Gershon MD, 2006. Physiological modulation of intestinal motility by enteric dopaminergic neurons and the D2 receptor: analysis of dopamine receptor expression, location, development, and function in wild-type and knock-out mice. J Neurosci 26(10), 2798–2807. [DOI] [PMC free article] [PubMed] [Google Scholar]
- Magerkurth C, Schnitzer R, Braune S, 2005. Symptoms of autonomic failure in Parkinson’s disease: prevalence and impact on daily life. Clin Auton Res 15(2), 76–82. [DOI] [PubMed] [Google Scholar]
- Members MSIB, Sansone SA, Fan T, Goodacre R, Griffin JL, Hardy NW, Kaddurah-Daouk R, Kristal BS, Lindon J, Mendes P, Morrison N, Nikolau B, Robertson D, Sumner LW, Taylor C, van der Werf M, van Ommen B, Fiehn O, 2007. The metabolomics standards initiative. Nat Biotechnol 25(8), 846–848. [DOI] [PubMed] [Google Scholar]
- Morais LH, Hara DB, Bicca MA, Poli A, Takahashi RN, 2018. Early signs of colonic inflammation, intestinal dysfunction, and olfactory impairments in the rotenone-induced mouse model of Parkinson’s disease. Behav Pharmacol 29(2 and 3-Spec Issue), 199–210. [DOI] [PubMed] [Google Scholar]
- Mukherjee A, Biswas A, Das SK, 2016. Gut dysfunction in Parkinson’s disease. World J Gastroenterol 22(25), 5742–5752. [DOI] [PMC free article] [PubMed] [Google Scholar]
- Nishi A, Shuto T, 2017. Potential for targeting dopamine/DARPP-32 signaling in neuropsychiatric and neurodegenerative disorders. Expert Opin Ther Targets 21(3), 259–272. [DOI] [PubMed] [Google Scholar]
- Pellegrini C, Fornai M, Colucci R, Tirotta E, Blandini F, Levandis G, Cerri S, Segnani C, Ippolito C, Bernardini N, Cseri K, Blandizzi C, Hasko G, Antonioli L, 2016. Alteration of colonic excitatory tachykininergic motility and enteric inflammation following dopaminergic nigrostriatal neurodegeneration. J Neuroinflammation 13(1), 146. [DOI] [PMC free article] [PubMed] [Google Scholar]
- Perez-Pardo P, Dodiya HB, Engen PA, Forsyth CB, Huschens AM, Shaikh M, Voigt RM, Naqib A, Green SJ, Kordower JH, Shannon KM, Garssen J, Kraneveld AD, Keshavarzian A, 2019. Role of TLR4 in the gut-brain axis in Parkinson’s disease: a translational study from men to mice. Gut 68(5), 829–843. [DOI] [PubMed] [Google Scholar]
- Perez-Pardo P, Dodiya HB, Engen PA, Naqib A, Forsyth CB, Green SJ, Garssen J, Keshavarzian A, Kraneveld AD, 2018. Gut bacterial composition in a mouse model of Parkinson’s disease. Benef Microbes 9(5), 799–814. [DOI] [PubMed] [Google Scholar]
- Pfeiffer RF, 2003. Gastrointestinal dysfunction in Parkinson’s disease. Lancet Neurol 2(2), 107–116. [DOI] [PubMed] [Google Scholar]
- Pfeiffer RF, Wszolek ZK, Ebadi M, 2012. Parkinson’s Disease, Second Edition CRC Press, Taylor & Francis Group, 1308. [Google Scholar]
- Sakakibara R, Odaka T, Uchiyama T, Asahina M, Yamaguchi K, Yamaguchi T, Yamanishi T, Hattori T, 2003. Colonic transit time and rectoanal videomanometry in Parkinson’s disease. J Neurol Neurosurg Psychiatry 74(2), 268–272. [DOI] [PMC free article] [PubMed] [Google Scholar]
- Scher JU, Sczesnak A, Longman RS, Segata N, Ubeda C, Bielski C, Rostron T, Cerundolo V, Pamer EG, Abramson SB, Huttenhower C, Littman DR, 2013. Expansion of intestinal Prevotella copri correlates with enhanced susceptibility to arthritis. Elife 2, e01202. [DOI] [PMC free article] [PubMed] [Google Scholar]
- Schwartz MW, Erickson JC, Baskin DG, Palmiter RD, 1998. Effect of fasting and leptin deficiency on hypothalamic neuropeptide Y gene transcription in vivo revealed by expression of a lacZ reporter gene. Endocrinology 139(5), 2629–2635. [DOI] [PubMed] [Google Scholar]
- Schwiertz A, Spiegel J, Dillmann U, Grundmann D, Burmann J, Fassbender K, Schafer KH, Unger MM, 2018. Fecal markers of intestinal inflammation and intestinal permeability are elevated in Parkinson’s disease. Parkinsonism Relat Disord 50, 104–107. [DOI] [PubMed] [Google Scholar]
- Tasselli M, Chaumette T, Paillusson S, Monnet Y, Lafoux A, Huchet-Cadiou C, Aubert P, Hunot S, Derkinderen P, Neunlist M, 2013. Effects of oral administration of rotenone on gastrointestinal functions in mice. Neurogastroenterol Motil 25(3), e183–193. [DOI] [PubMed] [Google Scholar]
- Tibar H, El Bayad K, Bouhouche A, Ait Ben Haddou EH, Benomar A, Yahyaoui M, Benazzouz A, Regragui W, 2018. Non-Motor Symptoms of Parkinson’s Disease and Their Impact on Quality of Life in a Cohort of Moroccan Patients. Front Neurol 9, 170. [DOI] [PMC free article] [PubMed] [Google Scholar]
- Trupp M, Jonsson P, Ohrfelt A, Zetterberg H, Obudulu O, Malm L, Wuolikainen A, Linder J, Moritz T, Blennow K, Antti H, Forsgren L, 2014. Metabolite and peptide levels in plasma and CSF differentiating healthy controls from patients with newly diagnosed Parkinson’s disease. J Parkinsons Dis 4(3), 549–560. [DOI] [PubMed] [Google Scholar]
- Walker JK, Gainetdinov RR, Mangel AW, Caron MG, Shetzline MA, 2000. Mice lacking the dopamine transporter display altered regulation of distal colonic motility. Am J Physiol Gastrointest Liver Physiol 279(2), G311–318. [DOI] [PubMed] [Google Scholar]
- Yang X, Qian Y, Xu S, Song Y, Xiao Q, 2017. Longitudinal Analysis of Fecal Microbiome and Pathologic Processes in a Rotenone Induced Mice Model of Parkinson’s Disease. Front Aging Neurosci 9, 441. [DOI] [PMC free article] [PubMed] [Google Scholar]
- Zhang L, Wang X, Wang M, Sterling NW, Du G, Lewis MM, Yao T, Mailman RB, Li R, Huang X, 2017. Circulating Cholesterol Levels May Link to the Factors Influencing Parkinson’s Risk. Front Neurol 8, 501. [DOI] [PMC free article] [PubMed] [Google Scholar]
- Zizzo MG, Mule F, Mastropaolo M, Serio R, 2010. D1 receptors play a major role in the dopamine modulation of mouse ileum contractility. Pharmacol Res 61(5), 371–378. [DOI] [PubMed] [Google Scholar]
Associated Data
This section collects any data citations, data availability statements, or supplementary materials included in this article.