MRIs of 30 patients with intracranial hypotension and 30 age-matched controls were evaluated by 2 neuroradiologists for classic findings of intracranial hypotension and the interpeduncular angle. Group analysis was performed with a Student t test, and receiver operating characteristic analysis was used to identify an ideal angle threshold to maximize sensitivity and specificity. The interpeduncular angle had excellent interobserver reliability (intraclass correlation coefficient value = 0.833) and was significantly lower in the intracranial hypotension group compared with the control group (25.3° versus 56.3°). There was significant correlation between the interpeduncular angle and the presence of brain stem slumping. With a threshold of 40.5°, sensitivity and specificity were 80% and 96.7%, respectively.
Abstract
BACKGROUND AND PURPOSE:
Classic findings of intracranial hypotension on MR imaging, such as brain stem slumping, can be variably present and, at times, subjective, potentially making the diagnosis difficult. We hypothesize that the angle between the cerebral peduncles correlates with the volume of interpeduncular cistern fluid and is decreased in cases of intracranial hypotension. We aimed to investigate its use as an objective assessment for intracranial hypotension.
MATERIALS AND METHODS:
Brain MRIs of 30 patients with intracranial hypotension and 30 age-matched controls were evaluated by 2 fellowship-trained neuroradiologists for classic findings of intracranial hypotension and the interpeduncular angle. Group analysis was performed with a Student t test, and receiver operating characteristic analysis was used to identify an ideal angle threshold to maximize sensitivity and specificity. Interobserver reliability was assessed for classic findings of intracranial hypotension using the Cohen κ value, and the interpeduncular angle, using the intraclass correlation.
RESULTS:
The interpeduncular angle had excellent interobserver reliability (intraclass correlation coefficient value = 0.833) and was significantly lower in the intracranial hypotension group compared with the control group (25.3° versus 56.3°; P < .001). There was significant correlation between the interpeduncular angle and the presence of brain stem slumping (P < .001) and in cases with ≥3 classic features of intracranial hypotension (P = .01). With a threshold of 40.5°, sensitivity and specificity were 80% and 96.7%, respectively.
CONCLUSIONS:
The interpeduncular angle is a sensitive and specific measure of intracranial hypotension and is a reliably reproducible parameter on routine clinical MR imaging.
Intracranial hypotension is a neurologic syndrome with various etiologies that share a common final pathway of decreased CSF volume and pressure. The classic clinical presentation is orthostatic headache with associated nonspecific symptoms such as nausea and vertigo.1 In severe cases, the disease can progress to cranial nerve palsies and even coma.2–4 The nonspecific nature of the clinical presentation can result in considerable delays in work-up, mimicking entities with drastically different treatments such as migraine, meningitis, or psychogenic disorders.5 The diagnosis is made clinically, based on the International Classification of Headache Disorders, 3rd edition, which requires a headache that develops in temporal relation with one of either low CSF pressure (< 60 mm of CSF) or imaging features demonstrating or suggestive of CSF leak.6 Currently, no criterion standard diagnostic test exists; the site of CSF leak in the spine is not always identified on imaging and a wide range of CSF opening pressures has been observed. For various clinical and practical considerations, contrast-enhanced MR imaging of the head is frequently the first-line investigation to confirm the diagnosis and rule out other mimics. However, even classically described imaging features are not always present and, at times, can be challenging to objectively report.7–12 For example, the most sensitive MR imaging finding for intracranial hypotension is pachymeningeal enhancement, but this can also be seen routinely in postoperative or post-lumbar puncture cases.7,8 Brain stem slumping has shown reasonable specificity for the syndrome, but the finding is only present in approximately 51% of cases and can be subjective.8–12 These issues have led to attempts to develop more objective criteria in determining low CSF volume.11–13 We propose a quantitative marker, the interpeduncular angle, to support the diagnosis of intracranial hypotension on MR imaging as a quick and reproducible measure. We aimed to investigate the relationship between this angle and the diagnosis of intracranial hypotension as well as its correlation to classically described imaging findings.
Materials and Methods
Approval from the Western University institutional ethics committee review board was obtained. A retrospective search of the PACS between January 2008 and December 2017 with the keywords “intracranial hypotension” was performed. Inclusion criteria were patients older than 17 years of age with a clinical diagnosis of intracranial hypotension and a brain MR imaging examination. Exclusion criteria included patients with tumor, hydrocephalus, leptomeningeal disease, subdural empyema, congenital Chiari malformation, and intracranial hypertension. Age-matched controls were selected from the same time period. Most of the controls were evaluated for headache, with a minority assessed for nonspecific symptoms, and none had a final clinical diagnosis of intracranial hypotension.
Two fellowship-trained neuroradiologists with combined 10 years of practice experience reviewed the MR imaging studies in a binary fashion for the following qualitative parameters of intracranial hypotension: pachymeningeal enhancement (or thickening in cases with no gadolinium), subdural collections, venous engorgement, and brain stem slumping (Fig 1). Venous engorgement was defined as a convex inferior border of the middle third of the dominant transverse sinus on a T1-weighted sagittal image, termed the “venous distension sign,” as described previously.13 Brain stem slumping was evaluated subjectively but was based on prior described findings such as a downward shift of the mamillary bodies with or without associated deformity of the tuber cinereum, a downward shift of the splenium of the corpus callosum, flattening of the anterior surface of the pons, and tonsillar herniation. In cases of discrepancy, a third fellowship-trained neuroradiologist with >30 years of experience reviewed the images and made a final decision.
Fig 1.
Classic MR imaging features of intracranial hypotension (arrows), including diffuse pachymeningeal enhancement (A), bilateral subdural collections (B), the venous distension sign (C), defined as a convex inferior margin of the dominant transverse sinus, and brain stem slumping (D), characterized by effacement of the interpeduncular cistern (asterisk), flattening of the anterior surface of the pons (short arrow), and tonsillar herniation (long arrow).
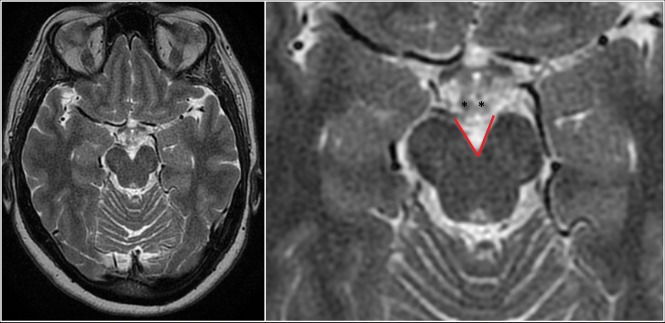
The radiologists also evaluated the MR images in both groups for the interpeduncular angle, defined as the angle formed by the posterior half of the cerebral peduncles obtained on an axial T2-weighted image at the level of the mammillary bodies or the slice immediately below it, whichever yields a lesser value (Fig 2). The angle was measured by both radiologists, and an average was taken as the true value.
Fig 2.
Full FOV (left) and magnified (right) axial T2WI depicting the interpeduncular angle (red lines) measured at the level of the mamillary bodies (asterisks) in a control patient.
Statistical Analysis
All statistical analysis was performed with SPSS statistical software, Version 25 (IBM, Armonk, New York). Intergroup analysis for continuous variables was performed with the Student t test. All data were analyzed using 2-tailed tests, with a P value < .05 considered significant. Receiver operating characteristic (ROC) curves were used to estimate a threshold angle for optimal sensitivity and specificity. Interobserver correlation was assessed using a weighted Cohen κ coefficient for categoric items and the intraclass correlation coefficient for continuous items. The strength of agreement based on coefficient values was defined as follows: 0, poor agreement; 0.01–0.20, slight agreement; 0.21–0.40, fair agreement; 0.41–0.60, moderate agreement; 0.61–0.80, good agreement; and 0.81–1.0, excellent agreement.
Results
Thirty patients with intracranial hypotension and 30 controls were evaluated (Table). The average age of the intracranial hypotension group was 50.3 years (range, 24–81 years), while that of the control group was 49.6 years (range, 17–78 years). Thirteen patients in the intracranial hypotension group were women, significantly less than in the control group, of whom 22 were female (P = .02). Headache was the most frequent indication for imaging, comprising 87% of the study group and 73% of the control group. Nineteen of the 30 patients with intracranial hypotension received treatment with an epidural blood patch, 14 of whom experienced improvement in symptoms.
Population demographics
| Intracranial Hypotension (n = 30) | Control (n = 30) | Significance (P < .05) | |
|---|---|---|---|
| Age (range) (mean) (yr) | 24–81, 50.3 | 17–78, 49.6 | .88 |
| Sex (female) (No.) (%) | 13 (43%) | 22 (73%) | .02a |
| Headache | 87% | 73% | .49 |
| Treatment (EBP) | 19/30 (14 responded) |
Note:—EBP indicates epidural blood patch.
Statistical significance reached.
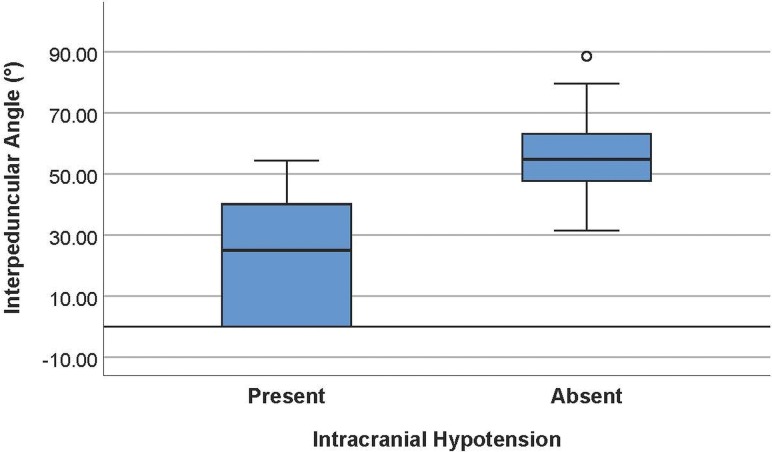
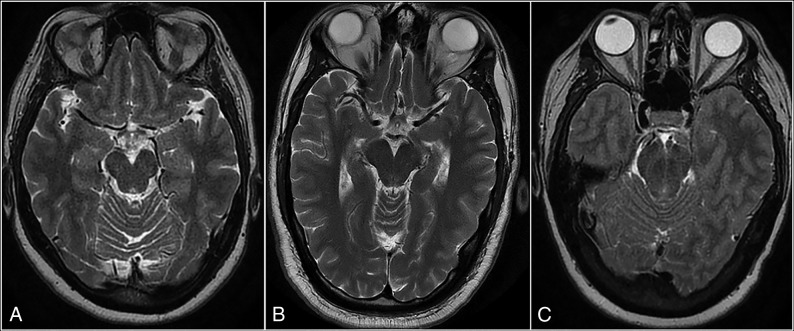
The average interpeduncular angle of the intracranial hypotension group was 25.3° ± 19.1° (95% CI, 18.2°–32.5°), while that of the control group was 56.3° ± 13.1° (95% CI, 51.4 °–61.2°) (Fig 3). This difference was statistically significantly (P < .001). Comparison of representative images of the interpeduncular angle between a control patient and patients with intracranial hypotension can be found in Fig 4. Subgroup analysis in the controls revealed an average interpeduncular angle of 53.4° ± 12.6° in females and 64.4° ± 11.3° in males, a significant difference (P = .04). The interpeduncular angle demonstrated excellent interobserver reliability (intraclass correlation coefficient = 0.833).
Fig 3.
Boxplots showing a significant difference in the interpeduncular angle in patients with intracranial hypotension (mean, 25.3° ± 19.1°) and controls (mean, 56.3° ± 13.1°).
Fig 4.
Axial T2-weighted MR images showing the difference in interpeduncular angles between a control subject (A) and 2 patients with intracranial hypotension (B and C). The angle in the control subject measures 52°. The first patient with intracranial hypotension (B) has mild narrowing in the angle (38°), while the second patient (C) has severe narrowing, with a completely closed angle (0°).
With respect to classic features in the intracranial hypotension group, 1 patient had no qualitative findings and an interpeduncular angle of 39.3°, three patients had 1 finding with an average angle of 26.8°, seven patients had 2 findings with an average angle of 37.5°, twelve had 3 findings with an average angle of 25.1°, and 7 patients had all 4 analyzed features with an average angle of 10.8°. Twenty-six of 30 patients (86.7%) had pachymeningeal thickening or enhancement, with excellent interobserver reliability (κ = 0.839). Twenty (66.7%) had subdural collections with good interobserver reliability. Twenty (66.7%) had brain stem slumping with excellent interobserver reliability. Fifteen patients (50.0%) had a positive venous distension sign with moderate interobserver reliability. The only feature with a significant correlation with the interpeduncular angle was brain stem slumping (P < .001). There was also a significant correlation between the interpeduncular angle and patients with ≥3 features of intracranial hypotension (P = .01).
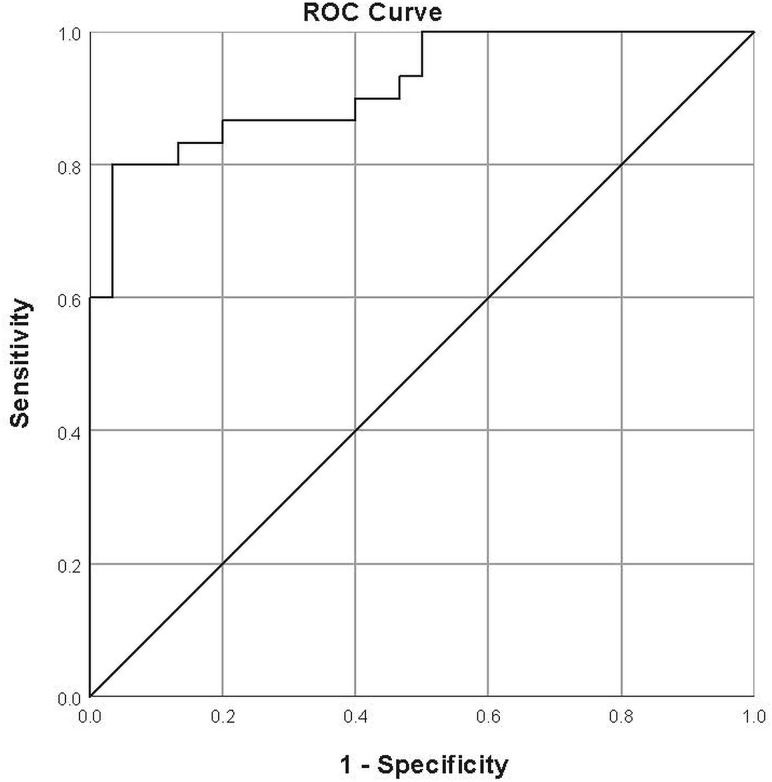
With ROC curves, an optimal threshold of 40.5° yielded a sensitivity of 80.0% and specificity of 96.7%. The area under the curve was 0.920 (Fig 5).
Fig 5.
ROC curve for the interpeduncular angle. The optimal threshold was found to be 40.5°, yielding a sensitivity of 80% and specificity of 96.7%. The area under the curve was 0.92.
Discussion
Intracranial hypotension, whether spontaneous or from a secondary cause, can lead to high morbidity with serious delays in diagnosis because both clinical and imaging features can be nonspecific. Classic findings on brain MR imaging, often the first-line investigation, have been previously reported to be variable and subjective.7–12 We found the interpeduncular angle to be an objective, reproducible diagnostic measure with high sensitivity and specificity for intracranial hypotension. Various other measurements have been previously investigated, including the mammillopontine distance, pontomesencephalic angle, distance from the diaphragmatic sella to the optic chiasm, and the height of the interpeduncular cistern at the plane of the cecum.11,12 A possible unifying mechanism explaining the changes in these measures is related to decreased basal cisternal volumes in intracranial hypotension, resulting in loss of buoyancy forces and subsequent central incisural herniation. These changes manifest as the classic brain stem slumping finding, with contributing pressure effects from supratentorial extra-axial collections. Supporting this theory, a smaller interpeduncular angle was found to be significantly correlated with the presence of brain stem slumping. Thus, a decrease in the interpeduncular angle likely represents an early manifestation of mass effect or even an objective proxy measurement for brain stem slumping, explaining both its increased sensitivity and specificity.
Although several alternative imaging measures also note good sensitivity and specificity, the greatest advantage of the interpeduncular angle is its practicality. While most reported measures rely on the sagittal plane, including traditional detection of brain stem slumping, the evaluation of the interpeduncular angle on a standard T2-weighted axial image means that it is easily incorporated into a routine search pattern. Once a mental data base of the normal range of the angle has been formed, the angle may not have to be explicitly measured. This would be highly valuable in cases in which intracranial hypotension may not be clinically suspected. Furthermore, unlike many of the proposed measures in the literature, the anatomic landmarks to make the measurement are well-known and the measurement does not require additional reference lines. Its simplicity likely contributes to its high reproducibility. In practice, we suggest measuring the interpeduncular angle with the posterior half of the cerebral peduncle because the anterior half often “flares out.” Additionally, some interpeduncular cisterns have a U-shaped apex, and we suggest measuring the linear portion of the cerebral peduncle. This may require an angle tool that can make 2 independent lines rather than a measurement that takes an apical point. In practice, the U-shaped cistern rarely affects the analysis because we have found that it is almost exclusively found in control subjects.
The other classic findings in intracranial hypotension are understood through the Monroe-Kellie doctrine, which describes a compensatory shift in volume of one intracranial compartment, most often the venous system, given its relatively increased compliance, in response to a change in the volume of another. We found pachymeningeal thickening/enhancement, essentially diffuse dilation of tiny dural-based venules, to be the most sensitive classic sign in intracranial hypotension, concordant with that reported in the literature (up to 80%).7,8 Unfortunately, the finding is not specific and is often present in patients postoperatively or after lumbar puncture. A more direct sign of venous engorgement in intracranial hypotension is prominence of the epidural venous plexus at the craniocervical junction and pituitary gland. Farb et al13 reported the venous distention sign, described as a convex, inferior margin in the midportion of the dominant transverse sinus seen on a T1-weighted sagittal image, to be highly sensitive and specific, measuring 93% for both. We used this as the defining feature for venous engorgement but found this sign to be positive in only 50% of patients with intracranial hypotension and with only moderate interobserver agreement. This may be because a T1-weighted image was not readily available in many cases due to different protocolling depending on the clinical indication. Shifts in the extra-axial compartment in intracranial hypotension may also manifest as subdural hygromas or hematomas. We found these to be present in two-thirds of patients with intracranial hypotension, slightly higher than previously described (31%–50%).12,14 We did not find the interpeduncular angle to correlate significantly with any of these classic findings, likely because they represent different mechanisms in intracranial hypotension (ie, narrowing of the interpeduncular angle represents sequelae of mass effect, while these findings represent compensatory expansion following CSF loss). In our series, further narrowing of the interpeduncular angle was significantly correlated with patients with ≥3 classic features of intracranial hypotension, supporting the specificity of this marker. The number of features in patients with 0, 1, or 2 findings not significantly correlating with the interpeduncular angle is of doubtful clinical significance because there is no current evidence to suggest the correlation between disease severity and the number of MR imaging findings.
This study is limited by its retrospective nature. The lack of a criterion standard diagnostic tool for intracranial hypotension makes the entity challenging to study; it is difficult to draw definitive conclusions regarding MR imaging features of intracranial hypotension between study and control groups, given that MR imaging itself is an integral component of the diagnostic algorithm. Additionally, we found wide variation between the number of classic findings and the perceived clinical severity of intracranial hypotension and the response to the epidural blood patch. Although the interpeduncular angle was narrowed in the most severe clinical cases of intracranial hypotension, its clinical utility in these cases is arguably less because the diagnosis has generally been elucidated. Development of a validated clinical grading scale could drastically improve the usefulness of objective imaging markers in populations in which the diagnosis is uncertain. A specific point to address in this study is the significantly higher number of females in the control group. This is likely due to the selection process and is consistent with the rate of use of MR imaging for neuroimaging in women in the literature.15 Reassuringly, we found that the average angle for female controls was significantly lower than that of male controls, which would have only decreased the average control angle overall. We also excluded pediatric patients, who may experience changes in anatomy during development. Establishing a normal reference range of the interpeduncular angle stratified by sex and age would be important for future research.
Conclusions
The interpeduncular angle is an objective, highly reproducible measure on brain MR imaging that is sensitive and specific for intracranial hypotension in adults. It is easily measured on axial T2-weighted sequences and can be practically incorporated into routine search patterns. This sign could serve as a useful adjunct marker in addition to classic findings and previously described measures in making the diagnosis.
Footnotes
Disclosures: Sachin K. Pandey—UNRELATED: Board Membership: London Health Sciences Center, Comments: Member of the Board of Directors of our local hospital center; Employment: London Health Sciences Center, London, Ontario, Canada, Comments: Academic neuroradiologist. Manas Sharma—UNRELATED: Employment: London Health Sciences Centre, London, Ontario, Canada, Comments: Academic neuroradiologist. Donald H. Lee—UNRELATED: Employment: London Health Sciences Center, London, Ontario, Canada, Comments: Academic neuroradiologist; Expert Testimony: medicolegal expert; Payment for Lectures Including Service on Speakers Bureaus: invited lecturer on multiple sclerosis for pharma companies.* *Money paid to individual.
REFERENCES
- 1. Schievink WI, Morreale VM, Atkinson JLD, et al. Surgical treatment of spontaneous spinal cerebrospinal fluid leaks. J Neurosurg 1998;88:243–46 10.3171/jns.1998.88.2.0243 [DOI] [PubMed] [Google Scholar]
- 2. Berlit P, Berg-Dammer E, Kuehne D. Abducens nerve palsy in spontaneous intracranial hypotension. Neurology 1994;44:1552 10.1212/wnl.44.8.1552 [DOI] [PubMed] [Google Scholar]
- 3. Russo A, Tessitore A, Cirillo M, et al. A transient third cranial nerve palsy as presenting sign of spontaneous intracranial hypotension. J Headache Pain 2011;12:493–96 10.1007/s10194-011-0345-1 [DOI] [PMC free article] [PubMed] [Google Scholar]
- 4. Schievink WI, Maya MM, Moser FG, et al. Coma: a serious complication of spontaneous intracranial hypotension. Neurology 2018;90:e1638–45 10.1212/WNL.0000000000005477 [DOI] [PubMed] [Google Scholar]
- 5. Schievink WI. Misdiagnosis of spontaneous intracranial hypotension. Arch Neurol 2003;60:1713–18 10.1001/archneur.60.12.1713 [DOI] [PubMed] [Google Scholar]
- 6. Headache Classification Committee of the International Headache Society (IHS): The International Classification of Headache Disorders, 3rd edition. Cephalalgia 2018;38:1–211 10.1177/0333102417738202 [DOI] [PubMed] [Google Scholar]
- 7. Pannullo SC, Reich JB, Krol G, et al. MRI changes in intracranial hypotension. Neurology 1993;43:919 10.1212/WNL.43.5.919 [DOI] [PubMed] [Google Scholar]
- 8. Mokri B, Piepgras DG, Miller GM. Syndrome of orthostatic headaches and diffuse pachymeningeal gadolinium enhancement. Mayo Clin Proc 1997;72:400–13 10.4065/72.5.400 [DOI] [PubMed] [Google Scholar]
- 9. Fishman RA, Dillon WP. Dural enhancement and cerebral displacement secondary to intracranial hypotension. Neurology 1993;43(3 Part 1):609–11 10.1212/wnl.43.3_part_1.609 [DOI] [PubMed] [Google Scholar]
- 10. Schievink WI, Maya MM, Louy C, et al. Diagnostic criteria for spontaneous spinal CSF leaks and intracranial hypotension. AJNR Am J Neuroradiol 2008;29:853–56 10.3174/ajnr.A0956 [DOI] [PMC free article] [PubMed] [Google Scholar]
- 11. Young SJ, Quisling RG, Bidari S, et al. An objective study of anatomic shifts in intracranial hypotension using four anatomic planes. Radiol Res Pract 2018;2018:6862739 10.1155/2018/6862739 [DOI] [PMC free article] [PubMed] [Google Scholar]
- 12. Shah LM, Mclean LA, Heilbrun ME, et al. Intracranial hypotension: improved MRI detection with diagnostic intracranial angles. AJR Am J Roentgenol 2013;200:400–07 10.2214/AJR.12.8611 [DOI] [PubMed] [Google Scholar]
- 13. Farb RI, Forghani R, Lee SK, et al. The venous distension sign: a diagnostic sign of intracranial hypotension at MR imaging of the brain. AJNR Am J Neuroradiol 2007;28:1489–93 10.3174/ajnr.A0621 [DOI] [PMC free article] [PubMed] [Google Scholar]
- 14. Schievink WI, Maya MM, Moser FG, et al. Spectrum of subdural fluid collections in spontaneous intracranial hypotension. J Neurosurg 2005;103:608–13 10.3171/jns.2005.103.4.0608 [DOI] [PubMed] [Google Scholar]
- 15. Callaghan BC, Kerber KA, Pace RJ, et al. Headaches and neuroimaging: high utilization and costs despite guidelines. JAMA Intern Med 2014;174:819–21 10.1001/jamainternmed.2014.173 [DOI] [PMC free article] [PubMed] [Google Scholar]


