Abstract
Nonalcoholic steatohepatitis (NASH) is a progressive liver disease that is characterized by liver injury, inflammation and fibrosis. NASH pathogenesis is linked to reprogramming of chromatin landscape in the liver that predisposes hepatocytes to stress-induced tissue injury. However, the molecular nature of the putative checkpoint that maintains chromatin architecture and preserves hepatocyte health remains elusive. Here we show that heterogeneous nuclear ribonucleoprotein U (hnRNPU), a nuclear matrix protein that governs chromatin architecture and gene transcription, is a critical factor that couples chromatin disruption to NASH pathogenesis. RNA-seq and ChIP-seq studies revealed an extensive overlap between hnRNPU occupancy and altered gene expression during NASH. Hepatocyte-specific inactivation of hnRNPU disrupted liver chromatin accessibility, activated molecular signature of NASH, and sensitized mice to diet-induced NASH pathogenesis. Mechanistically, hnRNPU deficiency stimulated the expression of a truncated isoform of TrkB (TRKB-T1) that promotes inflammatory signaling in hepatocytes and stress-induced cell death. BDNF treatment reduced membrane TRKB-T1 protein and protected mice from diet-induced NASH. These findings illustrate a novel mechanism through which disruptions of chromatin architecture drive the emergence of disease-specific signaling patterns that promote liver injury and exacerbate NASH pathogenesis.
Introduction
The epidemic of metabolic syndrome has greatly increased the risk for type 2 diabetes, cardiovascular disease and non-alcoholic fatty liver disease (NAFLD). NAFLD is characterized by chronic accumulation of excess fat in the liver and represents the most common metabolic liver disease linked to obesity and insulin resistance (1–5). NAFLD encompasses a spectrum of liver pathologies ranging from relatively benign hepatic steatosis to nonalcoholic steatohepatitis (NASH), first described by Ludwig et al. in 1980 (6). The latter is a more severe form of fatty liver disease that is associated with progressive liver injury, tissue inflammation and liver fibrosis. NASH pathogenesis is caused by multifactorial mechanisms that lead to pathological hepatic fat accumulation, stress-induced hepatocyte cell death, and persistently elevated inflammatory and tissue repair response (2, 3). Genetic polymorphisms of several loci have been demonstrated to contribute to NAFLD risk in humans (1, 5, 7), underscoring the dysregulations of gene expression and/or function as an important pathogenic factor in the initiation and progression of NASH.
The chromatin in eukaryotic cells stores genome information in a highly organized three-dimensional structure. Dynamic regulation of chromatin structure and accessibility is a fundamental aspect of transcriptional control in response to external signals (8, 9). In addition, chromatin-remodeling complexes and histone and DNA modifying enzymes act in concert with transcription factors to fine-tune gene expression (10–12). Hepatic gene expression is exquisitely responsive to nutritional and hormonal signals and undergoes reprogramming in disease states such as NAFLD. Recent transcriptomic and proteomic studies have delineated a core molecular signature of diet-induced NASH in mice (13, 14) and in human NASH livers (15, 16). Several features of NASH-associated alterations of hepatic gene expression appear to be conserved during human NASH pathogenesis, including aberrant regulation of metabolic genes and induction of genes involved in immunity, inflammatory response and fibrosis. The latter reflects a coordinated transcriptional response among multiple liver cell types during NASH development (2, 17). Despite this, the molecular nature of the nuclear factors that govern hepatocyte chromatin accessibility in liver disease remains elusive. Here we show that hnRNPU, a nuclear matrix protein, serves an indispensable role in the control of hepatic chromatin accessibility and gene expression. Hepatocyte-specific inactivation of hnRNPU exacerbates diet-induced NASH pathogenesis in mice, in part, through the aberrant induction of a truncated TrkB isoform that promotes inflammatory signaling in hepatocytes and stress-induced cell death.
Methods
Animal and human studies
All animal studies were performed following the guideline established by the University Committee on Use and Care of Animals at the University of Michigan. Mice containing floxed hnRNPU were generated as previously described (18). The Alb-Cre transgenic mice were purchased from the Jackson Laboratory. For chow feeding, mice were fed Teklad 5001 laboratory diet. High-fat diet (HFD) contains 60% kcal% fat (D12492). The Amylin NASH diet (AMLN, D09100301) contains 40% kcal% fat (18% of which was trans fat), 22% fructose and 2% cholesterol. Choline-deficient, L-amino acid-defined HFD (40% kcal%) containing 0.1% methionine (CDAHFD, A06071309) was used as an alternative NASH-inducing diet. All three special diets were purchased from Research Diets Inc. Human liver samples were obtained from the Liver Tissue Cell Distribution System at University of Minnesota and have been previously described (19).
Primary hepatocytes studies
Primary hepatocytes were isolated using collagenase digestion from wild-type C57BL/6J mice, hnRNPU Ctrl or LKO mice (20). Adenoviral infection was performed on the same day of isolation. After 6 h, transduced hepatocytes were switched to serum-free DMEM and cultured overnight before treatments. TNFα (20 ng/mL) was added 2 h after the treatment of palmitic acid (PA, 200 μ M or 400 μM).
qPCR and immunoblotting analysis
qPCR was performed as previously described (21), using primers listed in Supplemental Table 1. Immunoblotting was performed as described previously (22), using antibodies listed in Supplemental Table 2. For immunoprecipitation, liver nuclei were isolated from frozen liver tissues from mice fed chow or NASH diet as previously described (23). Nuclear extracts were incubated with control IgG or antibody specific for hnRNPU in the presence of protein G beads. Proteins associated with beads were analyzed by immunoblotting using antibodies specific for acetyllysine or phosphoserine/threonine.
Isolation of membrane TRKB-T1
Hepa 1–6 mouse hepatoma cells (ATCC, CRL-1830) were used to establish cell lines stably expressing TrkB-T1. Cells were transduced with pMSCV retroviral vector or a recombinant vector expressing TrkB-T1 followed by selection in the presence of puromycin (5 μg/ml) for at least 2 weeks. Stably transduced cells were switched to serum-free DMEM for 12 hours before treatment with BDNF (248-BD, R&D) for 3 hr. Cell membrane fraction was extracted by ultracentrifugation, as described previously (24).
Plasma enzymes and liver TAG analyses
Plasma alanine aminotransferase (ALT) and aspartate aminotransferase (AST) concentrations were measured using kits from Stanbio. Total liver triacylglyceride (TAG) was extracted and measured as previously described (22).
Histopathologic analysis and immunofluorescence staining
Formalin-fixed, paraffin-embedded mouse liver sections were stained with hematoxylin and eosin (H&E) to evaluate steatosis and inflammatory cells infiltration. Liver fibrosis was assessed by Picrosirius (Sirius) red (Polysciences, #24901) staining. For immunofluorescence microscopy, liver tissues were fixed with 10% formalin for 3 hrs, 30% sucrose in PBS overnight, embedded into OCT. Cryosections were permeabilized in 0.1% Triton X-100 in PBS for 30 min, blocked with 10% horse serum for 1 hr, labeled with antibodies against mouse Decorin (DCN) (R&D AF1060), F4/80 (Bio-Rad MCA497G), CD4 (Thermo Fisher 14–0042-82) or CD8a (Thermo Fisher 14–0808-82) overnight, followed by incubation with a fluorophore-conjugated secondary antibody (Jackson Immuno Research) for 1 hr. The stained sections were mounted with DAPI-containing mounting medium (VECTASHIELD) and then viewed on a Nikon A-1-A fluorescence microscope.
Liver ATAC sequencing
Nuclei from frozen liver tissue were isolated as previously described (25). 50,000 isolated nuclei in each sample (Ctrl n=6; LKO n=6) were used in transposase reaction (Ilumina). The libraries were sequenced on NovaSeq-6000 instrument with 50-bp paired-end reads after 2 step-PCR amplification (26). ATAC-seq analysis pipeline was adapted from previous study (27). The downregulated (692) and upregulated (2045) peaks in LKO mice were independently used for motif enrichment analysis (HOMER, findMotifs.pl). The UCSC genome browser was used to visualize the ATAC-seq coverage. Both raw and processed data have been deposited into Gene Expression Omnibus database (GSE131336).
RNA-seq data analysis
Liver RNA sequencing was performed on BGI 500 instrument after polyA-selected mRNA isolation from HFD-fed control and hnRNPU LKO mice. The fastq files were aligned to the mouse reference genome (mm10) using the aligner STAR. All RNA-seq raw data and processed data have been deposited into the GEO database (GSE131336). Gene enrichment analysis was performed using MetaScape (www.metascape.org).
Statistical analysis
All results are presented as mean ± SEM. Student’s t test was used to analyze the differences between two groups. Two-way ANOVA with multiple comparisons was used for statistical analysis of gene expression with the treatment of vehicle or PA plus TNFα. A p value of less than 0.05 was considered statistically significant. Statistical methods and corresponding p values were indicated in figure legends.
Results
Liver-specific inactivation of hnRNPU exacerbates diet-induced NASH pathogenesis
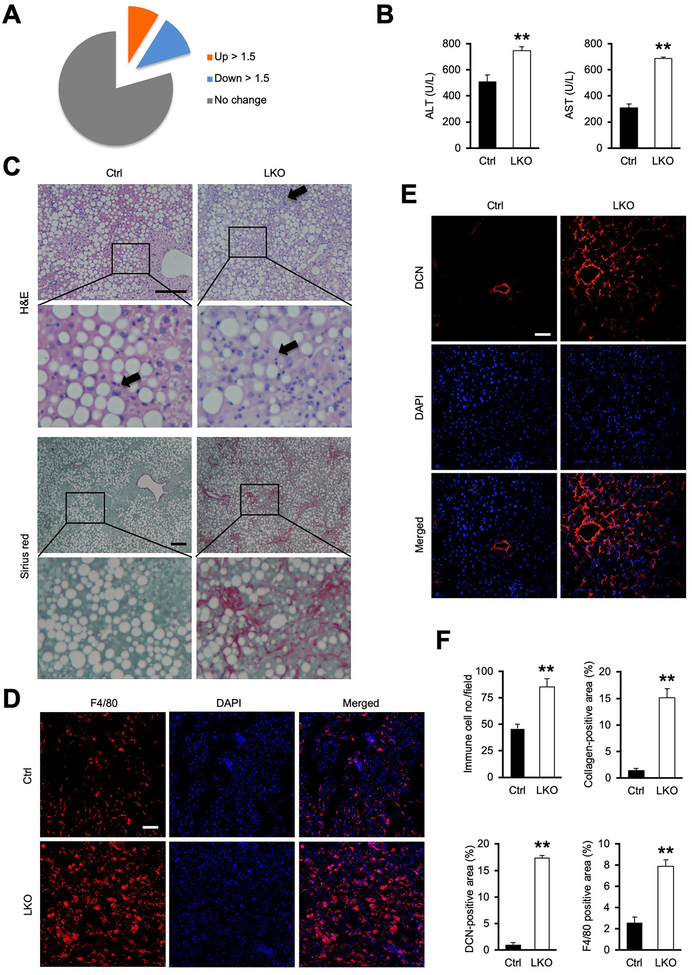
HNRNPU is a nuclear matrix protein that maintains three-dimensional genome architecture in hepatocytes through its association with chromatin (28, 29). These molecular observations led us to postulate that hnRNPU may serve as a chromatin checkpoint for liver metabolism and disease. In support of this, we found that over 20% of hepatic genes exhibiting hnRNPU occupancy were either upregulated (508) or downregulated (668) by more than 1.5-fold following AMLN diet-induced NASH (Figure 1A) (GSE75335 and GSE119340). While hnRNPU mRNA and protein expression in the liver remained similar in healthy and NASH livers, serine/threonine phosphorylation of hnRNPU was increased following diet-induced NASH (Figure S1). These findings suggest that post-translational modifications of hnRNPU may play a role in modulating its function during NASH pathogenesis. The extensive overlap between hnRNPU chromatin association and transcriptomic reprograming in the liver prompted us to generate liver-specific hnRNPU knockout mice (LKO) and determine how chromatin structure governed by hnRNPU contributes to NASH pathogenesis. Compared with hnRNPUflox/flox control (Ctrl), mice with hepatocyte-specific inactivation of hnRNPU (Alb-Cre; hnRNPUflox/flox) were slightly smaller and exhibited normal blood glucose and plasma triacylglycerol (TAG) levels and liver histology when fed standard rodent chow (Figure S2A–B). While plasma ALT was slightly elevated in LKO mice, hepatic expression of genes involved in glucose and lipid metabolism was largely unaffected by hnRNPU deficiency (Figure S2C–D).
Figure 1. Hepatocyte-specific inactivation of hnRNPU exacerbates CDAHFD-induced NASH.
(A) Pie chart depicting NASH regulation of the liver genes containing binding sites for hnRNPU.
(B) Plasma ALT and AST levels.
(C) H&E and Sirius red staining of liver sections from mice fed CDAHFD for three weeks. Arrowheads indicate infiltrated immune cells. Scale bars: 200 μm.
(D) F4/80 immunofluorescence staining of liver sections. Scale bars: 100 μm.
(E) DCN immunofluorescence staining of liver sections. Scale bars: 100 μm.
(F) Quantification of immune cell infiltration, collagen deposition, and DCN- and F4/80-positive areas. Data in (B) and (F) represent mean ± SEM (Ctrl n=8; LKO n=6). **P<0.01, Ctrl vs. LKO, two-tailed unpaired Student’s t-test.
To probe the role of hnRNPU in the liver under metabolic stress conditions, we fed control and LKO mice choline-deficient, L-amino acid-defined HFD containing 0.1% methionine (CDAHFD) to induce NASH pathogenesis. CDAHFD feeding has been shown to elicit the full spectrum of NASH pathologies, including hepatic steatosis, liver inflammation and fibrosis (30). While hnRNPU LKO mice weighed slightly less than control, liver to weight ratio was higher than control group following three weeks of CDAHFD feeding (Figure S3A), and appeared more rugged on the surface and rubbery upon touch. While liver TAG content and blood glucose levels remained comparable, plasma ALT and AST concentrations were significantly higher in LKO mice than control, indicating that hnRNPU inactivation in hepatocytes sensitized mice to CDAHFD-induced liver injury (Figure 1B). Consistently, we observed more pronounced immune cell infiltration and liver fibrosis in LKO mice (Figure 1C–F). Immunofluorescence staining indicated that the abundance of F4/80+ macrophages and CD4+ and CD8+ T cells was markedly elevated in LKO mouse livers (Figure 1D, 1F, S3B–C). Deposition of pericellular collagen and accumulation of Decorin (DCN), a proteoglycan secreted by hepatic stellate cells (HSC), was markedly enhanced by hnRNPU deficiency (Figure 1C, 1E, 1F). Ductular reaction is a common feature of chronic liver injury in liver diseases including NASH (31). Analysis of hepatic gene expression indicated that mRNA expression of genes associated with bile duct epithelial proliferation and ductular reaction (Spp1, Gli2, Afp, Prom1, Cd24a and Ncam1) was significantly increased in hnRNPU LKO mice following CDAHFD feeding (Figure S4A–B). Consistently, we observed increased bile epithelial expansion and osteopontin (OPN) immunoreactivity near the portal area in LKO mouse livers (Figure S4C–D). These findings illustrate that hnRNPU inactivation elicits a full spectrum of NASH-associated liver pathologies.
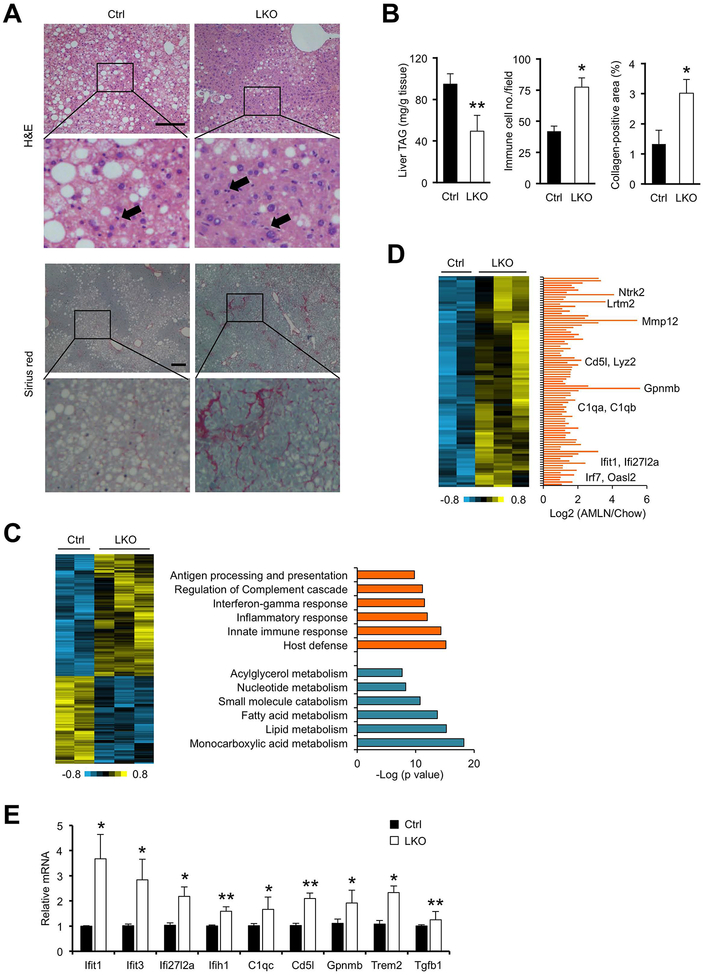
Chronic HFD feeding promotes obesity, insulin resistance and hepatic steatosis but fails to induce liver fibrosis in mice. In a separate set of studies, we examined whether hnRNPU deficiency sensitized mice to develop NASH pathologies upon HFD feeding. Following six months of HFD feeding, hnRNPU LKO mice gained approximately 15% less body weight and exhibited lower liver to body weight ratio than control (data not shown). Histological analysis and liver TAG measurements indicated that, while LKO mice exhibited slightly less severe hepatic steatosis, they had increased immune cell infiltration in the liver and developed more severe liver fibrosis as revealed by Sirius red staining (Figure 2A–B). As such, pericellular collagen accumulation was readily detectable in hnRNPU-deficient mouse livers but remained largely absent in control mice. As liver fibrosis is a hallmark of NASH pathogenesis, these findings strongly suggest that hepatic hnRNPU functions to restrict the progression from steatosis to NASH.
Figure 2. hnRNPU deficiency worsens NASH pathologies in mice following HFD feeding.
(A) H&E and Sirius red staining of liver sections. Arrowheads indicate infiltrated immune cells. Scale bars: 200 μm.
(B) Quantification of liver TAG content, immune cell infiltration, and collagen deposition.
(C) Heat map of hepatic genes upregulated or downregulated in hnRNPU LKO mice (left). Enrichment of biological processes in these two clusters is indicated (right).
(D) A cluster of hepatic genes upregulated in HFD-fed LKO mice (heat map, left) and following AMLN diet-induced NASH (bar graph, right). Liver RNA-seq data from mice fed chow or AMLN diet were used for the bar graph.
(E) qPCR analysis of hepatic gene expression in HFD-fed mice (Ctrl n=6; LKO n=10). Data in (B) and (C) represent mean ± SEM. *P<0.05, **P<0.01; Ctrl vs. LKO, two-tailed unpaired Student’s t-test.
Reprogramming of the liver transcriptome in response to hnRNPU inactivation
To delineate the effects of hnRNPU deficiency on liver transcriptome, we performed RNA-seq analysis on total liver RNA from HFD-fed control and LKO mice. Our analysis identified a total of 483 genes that were differentially regulated by hnRNPU inactivation (FDR<0.1). Gene ontology analysis indicated that downregulated genes (202) were enriched for monocarboxylic acid and lipid metabolism, whereas upregulated genes (281) were primarily responsible for host defense, innate immune response and inflammation (Figure 2C). Our recent RNA-seq studies comparing healthy and NASH livers defined a molecular signature of diet-induced NASH in mice (14). Remarkably, 89 of 281 genes elevated in hnRNPU LKO livers were also induced in NASH mouse livers (Figure 2D). qPCR analysis confirmed the induction of genes involved in type I interferon response (Ifit1, Ifit3, Ifi27l2a, Ifih1) and macrophage function (C1qc, Cd5l, Gpnmb, Trem2) in LKO livers (Figure 2E). These results indicate that hnRNPU deficiency elicits transcriptional reprogramming in the liver that is characteristic of NASH pathogenesis.
We recently performed single-cell RNA-seq (scRNA-seq) analysis of liver cells in healthy and diet-induced NASH mice (32). This scRNA-seq dataset contains gene expression data for hepatocytes and non-parenchymal cells at the single-cell resolution. To delineate the cellular origins of hnRNPU-regulated genes in the liver, we obtained expression values for these genes among different liver cell types from the scRNA-seq dataset. Clustering analysis revealed that a large proportion of the upregulated and downregulated genes were enriched in hepatocytes (Figure S5A), supporting the notion that hnRNPU deficiency likely directly perturbed hepatocyte gene expression. Several cell types involved in immune response, including macrophage, T cell, B cell and dendritic cell, were enriched for genes that were upregulated in hnRNPU LKO livers (Figure S5B). These integrated data analyses illustrate a coordinated transcriptomic response among diverse liver cell types as a result of hepatocyte-specific hnRNPU inactivation.
hnRNPU governs liver chromatin accessibility
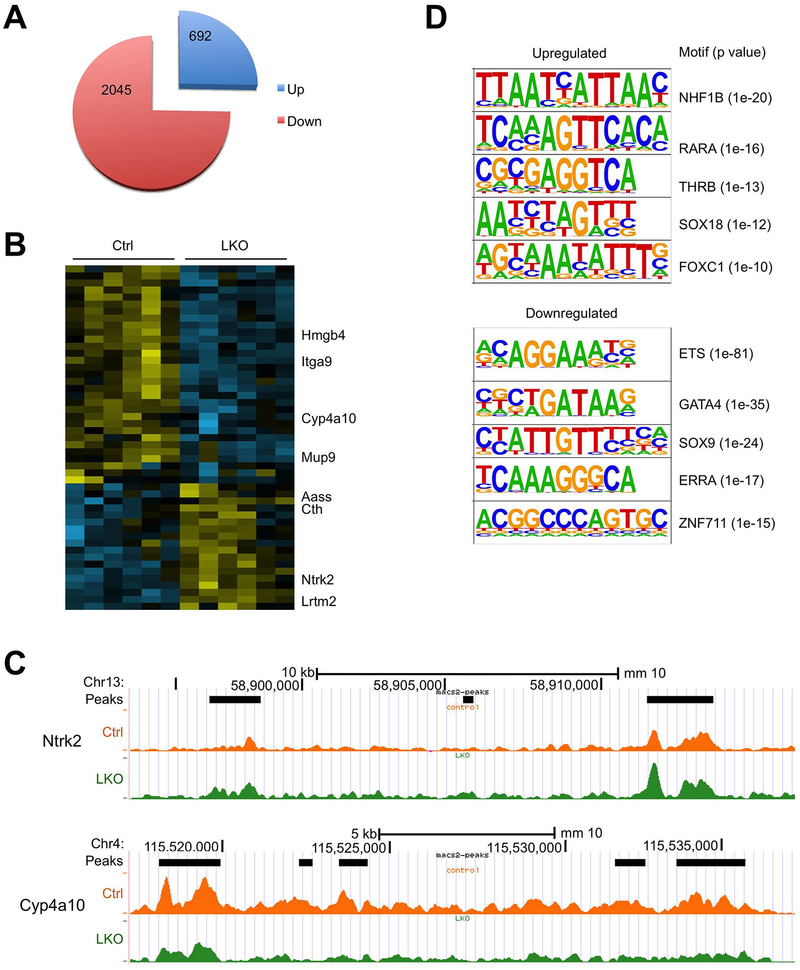
We next determined how hnRNPU inactivation alters liver chromatin accessibility and transcriptome during NASH pathogenesis. We performed Assay for Transposase-Accessible Chromatin using sequencing (ATAC-seq) on liver nuclei isolated from six pairs of HFD-fed control and LKO mice to delineate the role of hnRNPU in governing liver chromatin accessibility (26). We identified a total of 159,578 transposase-accessible chromatin peaks, 2045 and 692 of which showed decreased and increased accessibility (FDR<0.1), respectively, as a result of hnRNPU inactivation (Figure 3A). Using more stringent criteria, we revealed a list of ATAC-seq peaks exhibiting differential regulation by over 2-fold in LKO livers with FDR<0.05 (Figure 3B). As such, multiple ATAC peaks within the Cyp4a10 locus were significantly lower in hnRNPU LKO livers (Figure 3C). On the contrary, chromatin accessibility for Ntrk2, which encodes the TrkB receptor tyrosine kinase, was enhanced by hnRNPU deficiency. We next performed transcription factor motif-enrichment analysis on ATAC-seq peaks that were differentially regulated by hnRNPU inactivation. We observed that binding sites predicted for several transcription factors, including ETS, GATA4, SOX9, ERRA and ZNF711, were highly enriched at genomic locations exhibiting reduced accessibility in hnRNPU LKO mouse livers (Figure 3D). In contrast, the top five motifs enriched for upregulated chromatin peaks corresponded to predicted binding sites for HNF1B, RARA, THRB, SOX18 and FOXC1. These results illustrate a global effect of hnRNPU inactivation on liver chromatin accessibility in both directions.
Figure 3. ATAC-seq analysis of liver chromatin accessibility.
ATAC-seq was performed on liver nuclei isolated from Ctrl (n=6) and LKO (n=6) mice after six months of HFD feeding.
(A) Pie chart showing ATAC-seq peaks altered by hnRNPU deficiency.
(B) Heat map representation of peaks increased or decreased by over 2-fold in hnRNPU LKO mouse livers.
(C) UCSC genome browser tracks near Ntrk2 and Cyp4a10.
(D) Motif-enrichment analysis of the upregulated and downregulated ATAC-seq peaks.
hnRNPU deficiency enhances inflammatory signaling and hepatocyte injury
As shown above, hnRNPU LKO mice developed more severe NASH pathologies following CDAHFD feeding. Accordingly, mRNA expression of genes involved in liver fibrosis (Col1a1, Tgfb1, Timp1) and inflammatory response (Trem2, Gpnmb, Ms4a7, H2-Ab1, Ccl2) was elevated in the LKO mouse livers (Figure S6A–B). Immunoblotting analysis revealed that hnRNPU deficiency increased protein expression of TRAF2, a mediator of signaling by the TNF family receptors, and markedly increased protein levels of p52, a key effector of the non-canonical NF-kB pathway (33). Other factors involved in inflammatory signaling, including RELB and phosphorylated p65, p38 and JNK, and phosphorylated ERK were also elevated in hnRNPU LKO mouse livers (Figure S6C).
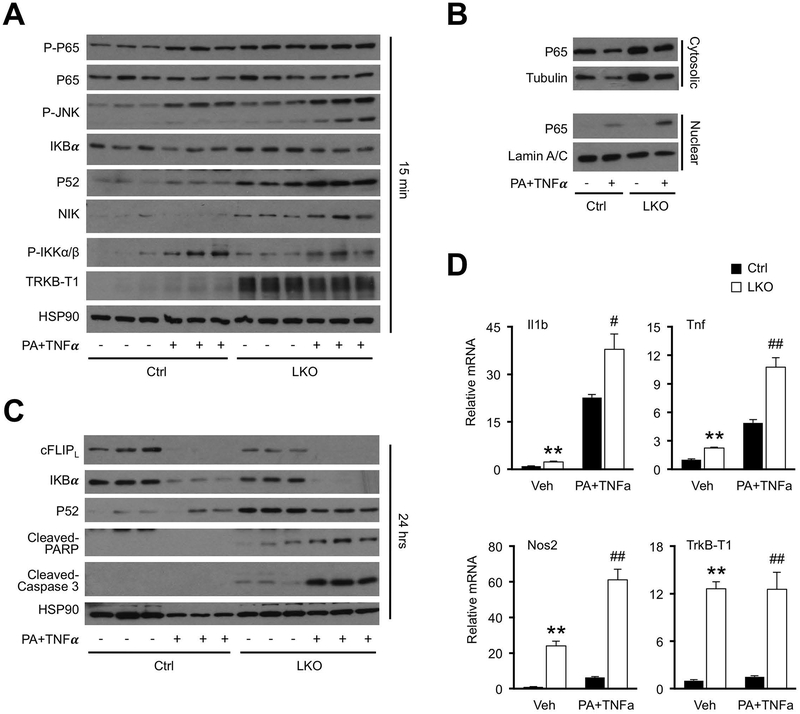
To determine whether hnRNPU regulates hepatocyte inflammatory signaling in a cell-autonomous manner, we performed studies using primary hepatocytes isolated from control and hnRNPU LKO mice. Consistent with in vivo results, protein levels of p52, phosphorylated p65 and TrkB-T1 were elevated in hnRNPU deficient hepatocytes (Figure 4A). Exposure of hepatocytes to a combination of palmitic acid (PA) and TNFα has been used to mimic NASH-associated metabolic stress and inflammatory signaling (19, 34). hnRNPU deficiency further increased p52 and p-JNK protein levels, as well as nuclear p65 level, in hepatocytes in response to acute treatments (15 min) with PA plus TNFα (Figure 4A–B). Following a more prolonged PA plus TNFα treatment, hnRNPU-deficient hepatocytes showed increased sensitivity to stress-induced cell death, as indicated by elevated levels of cleaved PARP and Caspase 3, markers of apoptotic cell death (Figure 4C). We previously demonstrated that cFLIPL plays an important role in protecting hepatocytes from stress-induced cell death (19). Consistently, protein levels of c-FLIPL were diminished in the absence of hnRNPU (Figure 4C). Induction of IL1b, Tnf and Nos2 expression was also augmented in knockout hepatocytes (Figure 4D). These results demonstrated that hnRNPU deficiency enhances inflammatory signaling in hepatocytes in response to metabolic stress and cytokines, thereby promoting liver injury and NASH progression.
Figure 4. Cell-autonomous regulation of hepatocyte signaling and gene expression by hnRNPU.
The following experiments were performed in primary hepatocytes prepared from Ctrl or LKO mice. Hepatocytes were cultured in serum-free media overnight before treatments. PA (200 μM) was added 2 hrs prior to the addition of TNFα (20 ng/mL).
(A) Immunoblots of total lysates from hepatocytes treated with vehicle (−) or PA+TNFα (+) for 15 min.
(B) Immunoblots of cytosolic or nuclear extracts from treated hepatocytes.
(C) Immunoblots of total lysates from hepatocytes treated with vehicle (−) or PA+TNFα (+) for 24 hrs.
(D) qPCR analysis of gene expression from hepatocytes treated with vehicle (Veh) or PA+TNFα for 6 hrs (n=3). Data represent mean ± SEM. **P<0.01, Ctrl vs. LKO in vehicle-treated cells. #P<0.05, ##P<0.01, Ctrl vs. LKO in hepatocytes treated with PA+TNFα. Two-way ANOVA with multiple comparisons.
TrkB induction in NASH liver predisposes hepatocytes to stress-induced injury
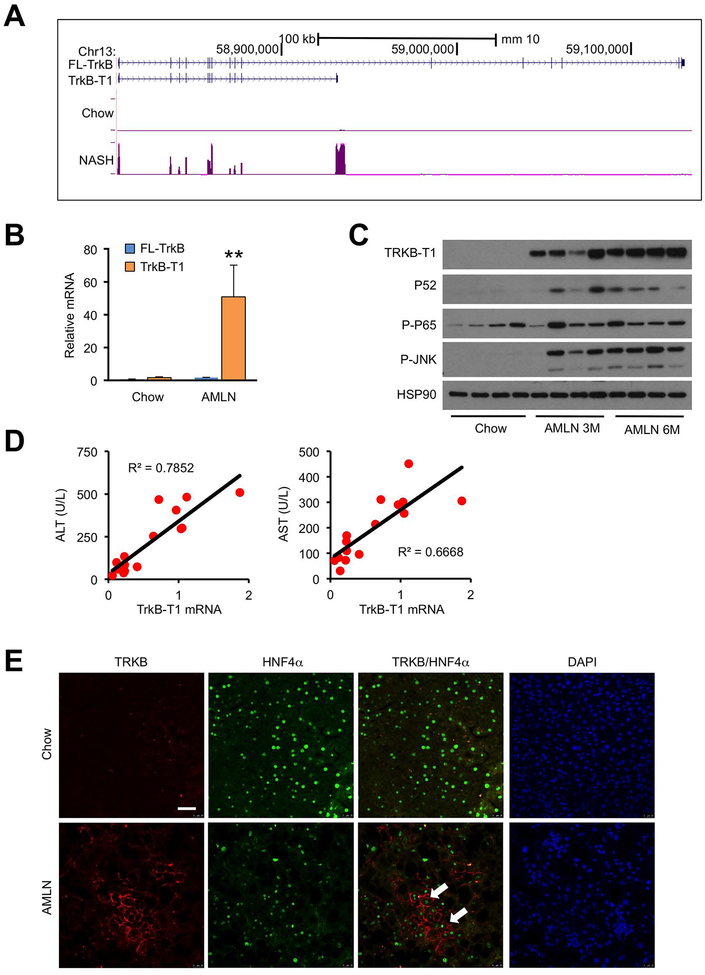
The above ATAC-seq and RNA-seq studies revealed a crucial role of hnRNPU in governing liver chromatin architecture and transcriptome. Notably, hnRNPU deficiency increased chromatin accessibility at the Ntrk2 locus and its mRNA expression (Figures 2E and 3B–C). Two predominant isoforms of TrkB correspond to the full-length isoform (FL-TrkB) and a truncated isoform (TrkB-T1) that lacks most of the intracellular domains (35, 36). The TrkB-T1 transcript originates from the use of an alternative 3’ exon, resulting in premature termination of transcription and production of a truncated protein. Inspection of liver RNA-seq tracks from mice fed chow or AMLN diet revealed that NASH increased the expression of TrkB in an isoform-specific manner (Figure 5A). qPCR analysis using isoform-specific primers indicated that TrkB-T1, but not FL-TrkB, was markedly increased during AMLN diet-induced NASH (Figure 5B). Consistent with these qPCR results, we observed strong induction of TRKB-T1 protein expression in NASH liver lysates following three and six months of AMLN diet feeding (Figure 5C). The induction of TrkB-T1 expression was associated with elevated P52 levels and increased phosphorylation of P65 and JNK, molecular markers of inflammatory cytokine signaling during NASH pathogenesis.
Figure 5. Induction of TrkB-T1 expression in mouse NASH.
(A) UCSC genome browser view of Ntrk2 liver RNA-seq reads from mice fed chow or AMLN diet (n=3).
(B) qPCR analysis of TrkB isoforms in the liver from mice fed chow or AMLN diet (n=3) using isoform-specific primers. Data represent mean ± SEM. *P<0.05, **P<0.01; AMLN vs. chow, two-tailed unpaired Student’s t-test.
(C) Immunoblots of total liver lysates from chow or ALMN diet-fed mice.
(D) Correlation of liver TrkB-T1 mRNA expression with plasma ALT and AST in a cohort of AMLN diet-fed WT mice exhibiting different severity of liver injury (n=15).
(E) Representative TrkB immunofluorescence in chow and AMLN diet-fed mouse livers. Arrowheads indicate HNF4α-positive hepatocytes. Scale bars: 100 μm
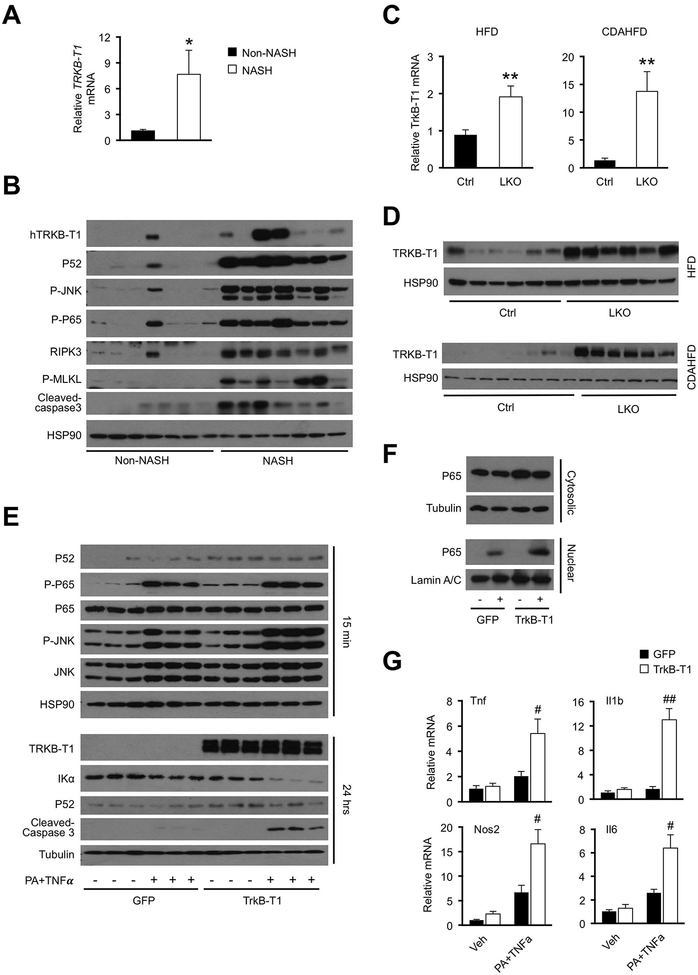
We next examined whether hepatic TrkB-T1 mRNA expression is associated with severity of liver injury in NASH. In a cohort of wild type mice fed AMLN diet exhibiting different degree of liver injury, we observed that hepatic TrkB-T1 expression strongly correlated with plasma ALT and AST levels (Figure 5D). Using immunofluorescence staining, we confirmed that TrkB induction was restricted to hepatocytes, which were marked by nuclear staining of HNF4α, a hepatocyte-specific transcription factor (Figure 5E). Importantly, increased TrkB-T1 mRNA and protein expression was observed in human NASH patient liver biopsies (Figure 6A–B). Similar to diet-induced NASH in mice, increased TrkB-T1 expression was associated with induction of JNK and P65 phosphorylation and increased P52 protein expression, suggesting that both the canonical and non-canonical NF-kB pathway is enhanced during human NASH pathogenesis. Interestingly, protein levels of RIPK3 and phosphorylated MLKL, two markers of necroptotic cell death, and cleaved Caspase 3 were increased in human NASH livers (Figure 6B). We performed qPCR and immunoblotting analyses on control and hnRNPU LKO mouse livers using isoform-specific primers and confirmed that hnRNPU inactivation significantly increased hepatic expression of TrkB-T1 under both HFD and CDAHFD feeding conditions (Figure 6C–D). The induction of TRKB-T1 expression was also observed in hnRNPU-deficient hepatocytes, indicating that this is a cell-autonomous effect of hnRNPU (Figure 4A). These results illustrate that TrkB-T1 induction is a common molecular feature of NASH pathogenesis in mice and humans. In addition, hnRNPU regulates the expression of TrkB in an isoform-specific manner.
Figure 6. Regulation and functional role of TRKB-T1 in hepatocyte stress response.
(A) qPCR analysis of TRKB-T1 expression in liver biopsies obtained from non-NASH control (n=7) and NASH patients (n=7). Data represent mean ± SEM. *P<0.05, NASH vs. control, two-tailed unpaired Student’s t-test.
(B) Immunoblots of total liver lysates from non-NASH and NASH individuals.
(C) qPCR analysis of liver TrkB-T1 expression in control and hnRNPU LKO mice fed HFD (Ctrl n=6; LKO n=10) or CDAHFD (Ctrl n=8; LKO n=6). Data represent mean ± SEM. **P<0.01, LKO vs. Ctrl, two-tailed unpaired Student’s t-test.
(D) Immunoblots of total liver lysates from mice fed HFD or CDAHFD.
(E) Immunoblots of total cell lysates from primary hepatocytes transduced with GFP or TrkB-T1 adenovirus followed by treatment with vehicle (−) or PA+TNFα (+) for 15 min (top) or 24 hrs (bottom).
(F) Immunoblots of cytosolic or nuclear extracts from transduced hepatocytes treated with vehicle (−) or PA+TNFα (+) for 15 min.
(G) qPCR analysis of gene expression in transduced hepatocytes treated with vehicle (Veh) or PA+TNFα for 6 hrs (n=3). Data represent mean ± SEM. #P<0.05, ##P<0.01, TrkB-T1 vs. GFP in hepatocytes treated with PA+TNFα. Two-way ANOVA with multiple comparisons.
The biological function of the truncated TrkB isoform in hepatocytes remains unexplored. TRKB-T1 stimulation has been shown to trigger ERK phosphorylation and regulates actin dynamics in glia cells (37–39). However, BDNF appeared to have modest effects on ERK phosphorylation and actin cytoskeletal organization in primary hepatocytes (Supplementary Figure S7). To investigate whether TrkB-T1 plays a protective or detrimental role in stress signaling, we transduced cultured primary hepatocytes with recombinant adenoviral vectors expressing GFP or TrkB-T1 and examined their response to PA/TNFα treatments. At the baseline, we observed that adenoviral overexpression of TrkB-T1 led to slightly elevated levels of P52 and phosphorylated P65 and JNK in transduced hepatocytes. Upon PA/TNFα treatments for 15 minutes, TrkB-T1 overexpression augmented the stimulation of JNK and P65 phosphorylation (Figure 6E), and nuclear translocation of P65 (Figure 6F), suggesting that TrkB-T1 facilitates activation of signaling pathways in response to metabolic stress and cytokine stimulation. Compared to GFP control, the levels of cleaved Caspase 3 were markedly higher in hepatocytes transduced with adenoviral TrkB-T1 following prolonged exposure to PA/TNFα. Analysis of gene expression in treated hepatocytes indicated that TrkB-T1 overexpression augments the induction of Tnf, Il1b, Nos2 and Il6 expression under PA/TNFα treated condition (Figure 6G). These studies demonstrate that TrkB-T1 overexpression is sufficient to enhance inflammatory signaling in hepatocytes in response to stress signals relevant for NASH pathogenesis.
BDNF reduces membrane TRKB-T1 and protects mice from diet-induced NASH
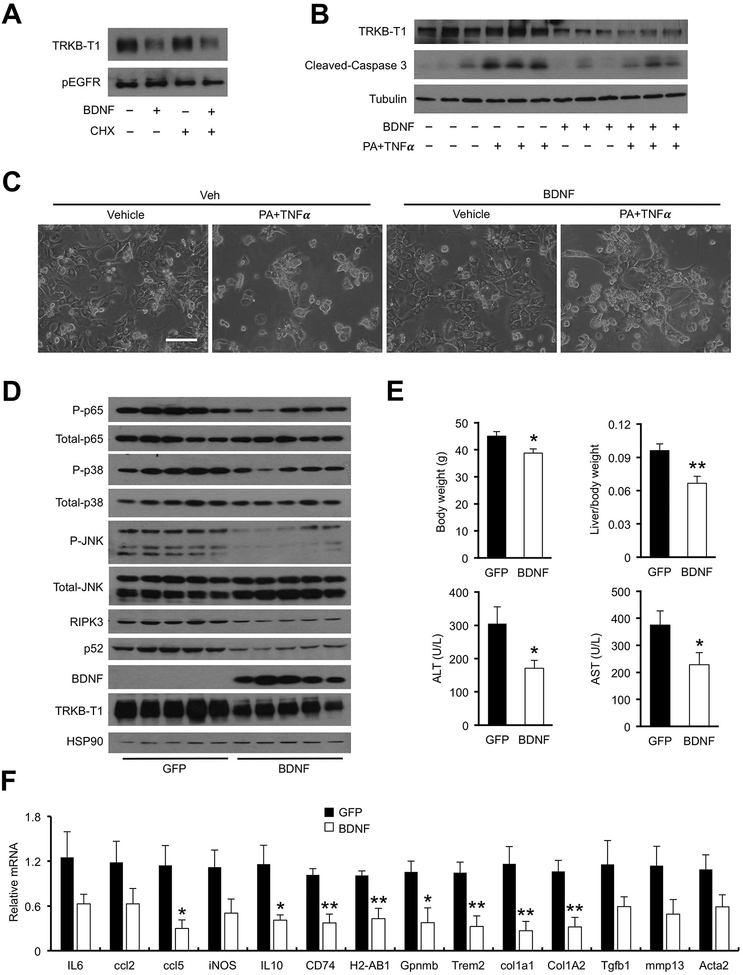
TRKB-T1 contains an extracellular ligand-binding domain identical to FL-TRKB, yet it lacks the intracellular receptor tyrosine kinase domain. As a result, TRKB-T1 is unable to trigger the canonical downstream signaling pathway in response to its ligand BDNF. Interestingly, we found that BDNF treatment of mouse hepatoma cells stably overexpressing TRKB-T1 diminished membrane TRKB-T1 protein levels (Figure 7A), while the levels of EGF receptor (EGFR) remained largely unchanged by BDNF. Importantly, BDNF treatment decreased endogenous TRKB-T1 protein levels in primary hepatocytes isolated from hnRNPU LKO mice and ameliorated PA/TNFα-induced Casp3 cleavage and hepatocyte cell death (Figure 7B–C). These results suggest that BDNF may directly modulate stress-induced hepatocyte injury via its regulation of TRKB-T1 protein levels. While the exact mechanisms through which BDNF reduces membrane TRKB-T1 remain unknown, a likely scenario is that ligand binding triggers endocytosis and subsequent lysosomal degradation of TRKB-T1 in hepatocytes. In fact, BDNF has been reported to bind TRKB and promote its endocytosis and degradation (40).
Figure 7. BDNF decreases membrane TRKB-T1 and protects mice from diet-induced NASH.
(A) Immunoblots of membrane proteins isolated from Hepa 1–6 cells stably expressing TrkB-T1. Transduced cells were treated with vehicle (−) or BDNF in the presence or absence of cycloheximide (CHX; 4 μM).
(B) Immunoblots of total cell lysates from primary hepatocytes isolated from hnRNPU LKO mice. Hepatocytes were pretreated with BDNF (100 ng/mL) for 2 hrs before addition of PA (200 μM)) and TNFa (20 ng/mL).
(C) Morphology of treated hepatocytes. Hepatocytes were pretreated with BDNF (100 ng/mL) for 2 hrs before addition of PA (400 μM) and TNFa (20 ng/mL).
(D) Immunoblots of total liver lysates from mice transduced with AAV-GFP or AAV-BDNF (GFP n=7; BDNF n=6).
(E) Metabolic parameters and plasma ALT/AST levels in transduced mice.
(F) qPCR analysis of hepatic gene expression. Data in (E) and (F) represent mean ± SEM. *P<0.05, **P<0.01; BDNF vs. GFP, two-tailed unpaired Student’s t-test.
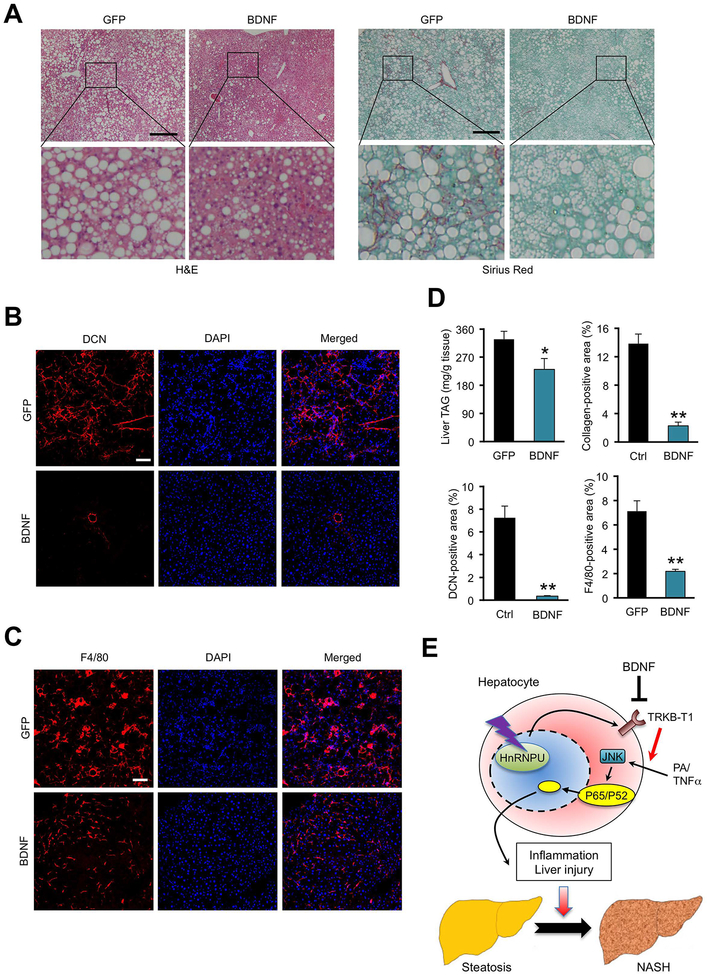
A prediction of the above findings is that BDNF overexpression may diminish TRKB-T1 protein levels in the liver, thereby alleviating diet-induced NASH pathogenesis. To test this, we generated a recombinant adeno-associated virus (AAV) overexpressing BDNF under the control of liver-specific thyroid hormone-binding globulin (TBG) promoter. As expected, tail vein injection of AAV-BDNF resulted in robust BDNF mRNA and protein expression in the liver (Figure 7D, S8D, S9A). BDNF overexpression had modest effects on plasma parameters, liver histology and hepatic gene expression when mice were fed chow diet (Figure S8). Following AMLN diet feeding, mice transduced with AAV-BDNF exhibited significantly lower plasma ALT and AST levels, reduced P52 and RIPK3 protein levels and P65, P38 and JNK phosphorylation in the liver than control (Figure 7E). mRNA expression of proinflammatory genes (Ccl4, Il10, Cd74, H2-Ab1, Gpnmb and Trem2) and fibrosis markers (Col1a1 and Col1a2) was significantly decreased by BDNF overexpression (Figure 7F). While TrkB-T1 mRNA levels remained similar between two groups, its protein expression was notably lower in the AAV-BDNF group (Figure 7D). Histological staining indicated that hepatic steatosis, liver fibrosis and DCN accumulation were markedly improved in mice transduced with AAV-BDNF (Figure 8A–B). Liver inflammation, as indicated by the abundance of macrophages and T cells, was greatly attenuated in response to BDNF overexpression (Figure 8C–D, S9B–C). Together, these results demonstrate that elevating BDNF levels is sufficient to reduce TRKB-T1 protein expression and ameliorate diet-induced NASH pathologies in mice.
Figure 8. AAV-mediated BDNF overexpression protects mice from diet-induced NASH pathogenesis.
(A) H&E and Sirius red staining of liver sections from mice transduced with AAV-GFP or AAV-BDNF. Arrowheads indicate infiltrated immune cells. Scale bars: 200 μm.
(B) F4/80 immunofluorescence staining of liver sections. Scale bars: 100 μm.
(C) DCN immunofluorescence staining of liver sections. Scale bars: 100 μm.
(D) Quantification of immune cell infiltration, collagen deposition, and DCN and F4/80 positive areas. Data represent mean ± SEM (GFP n=7; BDNF n=6). *P<0.05, **P<0.01; GFP vs. BDNF, two-tailed unpaired Student’s t-test.
(E) Model depicting the role of hnRNPU/TRKB-T1 as a chromatin accessibility checkpoint for NASH pathogenesis.
Discussion
The liver transcriptome is highly responsive to nutritional, hormonal and circadian cues. Reprogramming of the liver transcriptome as a consequence of altered epigenetic state and chromatin accessibility in hepatocytes is a fundamental feature of non-alcoholic fatty liver disease (14, 41, 42). Despite this, the molecular nature of the regulatory network that governs chromatin architecture in the liver remains obscure. In this study, we uncovered hnRNPU as a regulator of chromatin accessibility across the genome that functions to protect hepatocytes from stress-induced cell injury (Figure 8E). Hepatocyte-specific inactivation of hnRNPU exacerbated diet-induced NASH pathogenesis in mice, including liver injury, inflammation and fibrosis. HNRNPU is a nuclear matrix protein that regulates three-dimensional chromatin structure and gene transcription (28, 29). In the heart, hnRNPU is required for postnatal development and cardiac function (18). The expression levels of hnRNPU in the liver remained largely unchanged during diet-induced NASH in mice and in human NASH, suggesting that other mechanisms are likely at work to regulate the dynamic chromatin response. In support of this, hnRNPU phosphorylation at serine/threonine residues appeared to be enhanced in diet-induced NASH. However, the exact residues, their upstream kinases and the effects of hnRNPU phosphorylation on its biological functions remain currently unknown. Previous studies have demonstrated that hnRNPU interacts with a number of nuclear proteins including heterochromatin protein 1 alpha, the transcription factor Zbtb7b and the long noncoding RNA Blnc1 (21, 43, 44). It is likely that regulation of these hnRNPU-interacting factors may also underlie its effects on chromatin structure in response to physiological and pathophysiological stimuli.
Unlike transcriptional coactivators and repressors, the effects of hnRNPU inactivation on chromatin accessibility appeared to be bidirectional, suggesting that hnRNPU acts in a context-dependent manner to influence hepatic gene expression. Integration of the RNA-seq data from the hnRNPU LKO mouse livers with single-cell RNA-seq data revealed an interesting feature of liver gene regulation by hnRNPU (Figure S4A). While many differentially expressed genes exhibit highest expression in hepatocytes, among different liver cell types, mRNA expression of a large number of genes altered by hnRNPU deficiency appeared to be enriched in non-parenchymal cells. Remarkably, many genes upregulated in hnRNPU LKO livers are restricted to cells involved in immunity and inflammation, including macrophage, T cell, B cell and dendritic cell (Figure S4B). These findings illustrate the prevalence of intercellular crosstalk between hepatocytes and other cell types in the liver. While the exact mechanisms that mediate immune cell gene expression remain unknown, a likely scenario is that hnRNPU deficiency sensitizes hepatocytes to stress-induced injury, leading to enhanced inflammatory response and stellate cell activation.
The receptor tyrosine kinase TrkB is a high-affinity receptor for neurotrophins that is known to promote neuronal differentiation and survival (45, 46). A number of TrkB transcripts have been described as a result of alternative splicing. The full-length isoform contains the extracellular ligand-binding domain and intracellular tyrosine kinase domain, whereas TrkB-T1 is truncated immediately after the transmembrane domain and lacks the kinase domain (47). Our RNA-seq study comparing healthy and NASH mouse livers revealed that TrkB-T1, but not the FL-TrkB isoform, was among the most highly induced gene in the liver following diet-induced NASH (Figure 5A). It is notable that TrkB expression is largely absent in healthy liver. As such, the induction of TrkB-T1 represents an emergent property of NASH hepatocytes that may be functionally linked to NASH pathogenesis. This isoform-specific induction of TrkB expression was observed in human NASH liver biopsies, illustrating that dysregulation of TrkB expression is likely a conserved feature of NASH (Figure 6A–B). Interestingly, a recent study showed that expression of TrkB and its ligand BDNF was induced in the liver following bile duct ligation (48); however, the exact isoform(s) involved was not determined. TrkB-T1 has been shown to regulate calcium signaling and actin dynamics (37–39) and may act as a dominant negative receptor for BDNF, thereby attenuating BDNF signaling through TrkB (47). Our functional studies demonstrate that TRKB-T1 promotes stress-induced hepatocyte death whereas its ligand BDNF diminishes membrane TRKB-T1 protein levels and protects mice from diet-induced NASH.
Translational and clinical potential of the study
This work delineates a molecular pathway that links chromatin regulation to NASH pathogenesis. The aberrant induction of TRKB-T1 expression in mouse and human NASH is particularly intriguing. Our results support a deleterious effect of membrane TRKB-T1 on hepatocyte health, whereas BDNF-mediated downregulation elicits protective activities. As such, the BDNF/TRKB-T1 axis may present unique molecular targets for the therapeutic intervention of NASH.
Supplementary Material
Acknowledgements
We thank Dr. Tom Maniatis for sharing the hnRNPU flox mouse strain. This work was supported by NIH grants (DK102456 and DK118731 to J.D.L). H.K. was supported by NRSA F30 fellowship (DK117615) and MSTP training grant (T32GM007863). T.L. was supported by Patten Predoctoral Fellowship provided by the University of Michigan.
Footnotes
Competing interests
The authors declare no competing interests.
References
- 1.Cohen JC, Horton JD, Hobbs HH. Human fatty liver disease: old questions and new insights. Science 2011;332:1519–1523. [DOI] [PMC free article] [PubMed] [Google Scholar]
- 2.Friedman SL, Neuschwander-Tetri BA, Rinella M, Sanyal AJ. Mechanisms of NAFLD development and therapeutic strategies. Nat Med 2018;24:908–922. [DOI] [PMC free article] [PubMed] [Google Scholar]
- 3.Samuel VT, Shulman GI. Nonalcoholic Fatty Liver Disease as a Nexus of Metabolic and Hepatic Diseases. Cell Metab 2018;27:22–41. [DOI] [PMC free article] [PubMed] [Google Scholar]
- 4.Suzuki A, Diehl AM. Nonalcoholic Steatohepatitis. Annu Rev Med 2017;68:85–98. [DOI] [PubMed] [Google Scholar]
- 5.Hardy T, Oakley F, Anstee QM, Day CP. Nonalcoholic Fatty Liver Disease: Pathogenesis and Disease Spectrum. Annu Rev Pathol 2016;11:451–496. [DOI] [PubMed] [Google Scholar]
- 6.Ludwig J, Viggiano TR, McGill DB, Oh BJ. Nonalcoholic steatohepatitis: Mayo Clinic experiences with a hitherto unnamed disease. Mayo Clin Proc 1980;55:434–438. [PubMed] [Google Scholar]
- 7.Kahali B, Halligan B, Speliotes EK. Insights from Genome-Wide Association Analyses of Nonalcoholic Fatty Liver Disease. Semin Liver Dis 2015;35:375–391. [DOI] [PMC free article] [PubMed] [Google Scholar]
- 8.Klemm SL, Shipony Z, Greenleaf WJ. Chromatin accessibility and the regulatory epigenome. Nat Rev Genet 2019;20:207–220. [DOI] [PubMed] [Google Scholar]
- 9.Voss TC, Hager GL. Dynamic regulation of transcriptional states by chromatin and transcription factors. Nat Rev Genet 2014;15:69–81. [DOI] [PMC free article] [PubMed] [Google Scholar]
- 10.Soshnev AA, Josefowicz SZ, Allis CD. Greater Than the Sum of Parts: Complexity of the Dynamic Epigenome. Mol Cell 2016;62:681–694. [DOI] [PMC free article] [PubMed] [Google Scholar]
- 11.Wang RR, Pan R, Zhang W, Fu J, Lin JD, Meng ZX. The SWI/SNF chromatin-remodeling factors BAF60a, b, and c in nutrient signaling and metabolic control. Protein Cell 2018;9:207–215. [DOI] [PMC free article] [PubMed] [Google Scholar]
- 12.Wu X, Zhang Y. TET-mediated active DNA demethylation: mechanism, function and beyond. Nat Rev Genet 2017;18:517–534. [DOI] [PubMed] [Google Scholar]
- 13.Clapper JR, Hendricks MD, Gu G, Wittmer C, Dolman CS, Herich J, Athanacio J, et al. Diet-induced mouse model of fatty liver disease and nonalcoholic steatohepatitis reflecting clinical disease progression and methods of assessment. Am J Physiol Gastrointest Liver Physiol 2013;305:G483–495. [DOI] [PubMed] [Google Scholar]
- 14.Xiong X, Wang Q, Wang S, Zhang J, Liu T, Guo L, Yu Y, et al. Mapping the molecular signatures of diet-induced NASH and its regulation by the hepatokine Tsukushi. Mol Metab 2019;20:128–137. [DOI] [PMC free article] [PubMed] [Google Scholar]
- 15.Arendt BM, Comelli EM, Ma DW, Lou W, Teterina A, Kim T, Fung SK, et al. Altered hepatic gene expression in nonalcoholic fatty liver disease is associated with lower hepatic n-3 and n-6 polyunsaturated fatty acids. Hepatology 2015;61:1565–1578. [DOI] [PubMed] [Google Scholar]
- 16.Lefebvre P, Lalloyer F, Bauge E, Pawlak M, Gheeraert C, Dehondt H, Vanhoutte J, et al. Interspecies NASH disease activity whole-genome profiling identifies a fibrogenic role of PPARalpha-regulated dermatopontin. JCI Insight 2017;2. [DOI] [PMC free article] [PubMed] [Google Scholar]
- 17.Machado MV, Diehl AM. Pathogenesis of Nonalcoholic Steatohepatitis. Gastroenterology 2016;150:1769–1777. [DOI] [PMC free article] [PubMed] [Google Scholar]
- 18.Ye J, Beetz N, O’Keeffe S, Tapia JC, Macpherson L, Chen WV, Bassel-Duby R, et al. hnRNP U protein is required for normal pre-mRNA splicing and postnatal heart development and function. Proc Natl Acad Sci U S A 2015;112:E3020–3029. [DOI] [PMC free article] [PubMed] [Google Scholar]
- 19.Guo L, Zhang P, Chen Z, Xia H, Li S, Zhang Y, Kobberup S, et al. Hepatic neuregulin 4 signaling defines an endocrine checkpoint for steatosis-to-NASH progression. J Clin Invest 2017. [DOI] [PMC free article] [PubMed] [Google Scholar]
- 20.Wang GX, Zhao XY, Meng ZX, Kern M, Dietrich A, Chen Z, Cozacov Z, et al. The brown fat-enriched secreted factor Nrg4 preserves metabolic homeostasis through attenuation of hepatic lipogenesis. Nat Med 2014;20:1436–1443. [DOI] [PMC free article] [PubMed] [Google Scholar]
- 21.Li S, Mi L, Yu L, Yu Q, Liu T, Wang GX, Zhao XY, et al. Zbtb7b engages the long noncoding RNA Blnc1 to drive brown and beige fat development and thermogenesis. Proc Natl Acad Sci U S A 2017;114:E7111–E7120. [DOI] [PMC free article] [PubMed] [Google Scholar]
- 22.Guo L, Zhang P, Chen Z, Xia H, Li S, Zhang Y, Kobberup S, et al. Hepatic neuregulin 4 signaling defines an endocrine checkpoint for steatosis-to-NASH progression. J Clin Invest 2017;127:4449–4461. [DOI] [PMC free article] [PubMed] [Google Scholar]
- 23.Li S, Liu C, Li N, Hao T, Han T, Hill DE, Vidal M, et al. Genome-wide coactivation analysis of PGC-1alpha identifies BAF60a as a regulator of hepatic lipid metabolism. Cell Metab 2008;8:105–117. [DOI] [PMC free article] [PubMed] [Google Scholar]
- 24.Welman A, Burger MM, Hagmann J. Structure and function of the C-terminal hypervariable region of K-Ras4B in plasma membrane targetting and transformation. Oncogene 2000;19:4582–4591. [DOI] [PubMed] [Google Scholar]
- 25.Corces MR, Trevino AE, Hamilton EG, Greenside PG, Sinnott-Armstrong NA, Vesuna S, Satpathy AT, et al. An improved ATAC-seq protocol reduces background and enables interrogation of frozen tissues. Nat Methods 2017;14:959–962. [DOI] [PMC free article] [PubMed] [Google Scholar]
- 26.Buenrostro JD, Giresi PG, Zaba LC, Chang HY, Greenleaf WJ. Transposition of native chromatin for fast and sensitive epigenomic profiling of open chromatin, DNA-binding proteins and nucleosome position. Nat Methods 2013;10:1213–1218. [DOI] [PMC free article] [PubMed] [Google Scholar]
- 27.Orchard P, White JS, Thomas PE, Mychalowych A, Kiseleva A, Hensley J, Allen B, et al. Genome-wide chromatin accessibility and transcriptome profiling show minimal epigenome changes and coordinated transcriptional dysregulation of hedgehog signaling in Danforth’s short tail mice. Hum Mol Genet 2018. [DOI] [PMC free article] [PubMed] [Google Scholar]
- 28.Fan H, Lv P, Huo X, Wu J, Wang Q, Cheng L, Liu Y, et al. The nuclear matrix protein HNRNPU maintains 3D genome architecture globally in mouse hepatocytes. Genome Res 2018;28:192–202. [DOI] [PMC free article] [PubMed] [Google Scholar]
- 29.Wang S, Wu X, Liu Y, Yuan J, Yang F, Huang J, Meng Q, et al. Long noncoding RNA H19 inhibits the proliferation of fetal liver cells and the Wnt signaling pathway. FEBS Lett 2016;590:559–570. [DOI] [PubMed] [Google Scholar]
- 30.Matsumoto M, Hada N, Sakamaki Y, Uno A, Shiga T, Tanaka C, Ito T, et al. An improved mouse model that rapidly develops fibrosis in non-alcoholic steatohepatitis. Int J Exp Pathol 2013;94:93–103. [DOI] [PMC free article] [PubMed] [Google Scholar]
- 31.Sato K, Marzioni M, Meng F, Francis H, Glaser S, Alpini G. Ductular Reaction in Liver Diseases: Pathological Mechanisms and Translational Significances. Hepatology 2019;69:420–430. [DOI] [PMC free article] [PubMed] [Google Scholar]
- 32.Xiong X, Kuang H, Ansari S, Liu T, Gong J, Wang S, Zhao XY, et al. Landscape of Intercellular Crosstalk in Healthy and NASH Liver Revealed by Single-Cell Secretome Gene Analysis. Mol Cell 2019;75:644–660 e645. [DOI] [PMC free article] [PubMed] [Google Scholar]
- 33.Shih VF, Tsui R, Caldwell A, Hoffmann A. A single NFkappaB system for both canonical and non-canonical signaling. Cell Res 2011;21:86–102. [DOI] [PMC free article] [PubMed] [Google Scholar]
- 34.Ni HM, McGill MR, Chao X, Woolbright BL, Jaeschke H, Ding WX. Caspase Inhibition Prevents Tumor Necrosis Factor-alpha-Induced Apoptosis and Promotes Necrotic Cell Death in Mouse Hepatocytes in Vivo and in Vitro. Am J Pathol 2016;186:2623–2636. [DOI] [PMC free article] [PubMed] [Google Scholar]
- 35.Eide FF, Vining ER, Eide BL, Zang K, Wang XY, Reichardt LF. Naturally occurring truncated trkB receptors have dominant inhibitory effects on brain-derived neurotrophic factor signaling. J Neurosci 1996;16:3123–3129. [DOI] [PMC free article] [PubMed] [Google Scholar]
- 36.Luberg K, Wong J, Weickert CS, Timmusk T. Human TrkB gene: novel alternative transcripts, protein isoforms and expression pattern in the prefrontal cerebral cortex during postnatal development. J Neurochem 2010;113:952–964. [DOI] [PubMed] [Google Scholar]
- 37.Ohira K, Kumanogoh H, Sahara Y, Homma KJ, Hirai H, Nakamura S, Hayashi M. A truncated tropomyosin-related kinase B receptor, T1, regulates glial cell morphology via Rho GDP dissociation inhibitor 1. J Neurosci 2005;25:1343–1353. [DOI] [PMC free article] [PubMed] [Google Scholar]
- 38.Ohta K, Lupo G, Kuriyama S, Keynes R, Holt CE, Harris WA, Tanaka H, et al. Tsukushi functions as an organizer inducer by inhibition of BMP activity in cooperation with chordin. Dev Cell 2004;7:347–358. [DOI] [PMC free article] [PubMed] [Google Scholar]
- 39.Rose CR, Blum R, Pichler B, Lepier A, Kafitz KW, Konnerth A. Truncated TrkB-T1 mediates neurotrophin-evoked calcium signalling in glia cells. Nature 2003;426:74–78. [DOI] [PubMed] [Google Scholar]
- 40.Huang SH, Zhao L, Sun ZP, Li XZ, Geng Z, Zhang KD, Chao MV, et al. Essential role of Hrs in endocytic recycling of full-length TrkB receptor but not its isoform TrkB.T1. J Biol Chem 2009;284:15126–15136. [DOI] [PMC free article] [PubMed] [Google Scholar]
- 41.Cazanave S, Podtelezhnikov A, Jensen K, Seneshaw M, Kumar DP, Min HK, Santhekadur PK, et al. The Transcriptomic Signature Of Disease Development And Progression Of Nonalcoholic Fatty Liver Disease. Sci Rep 2017;7:17193. [DOI] [PMC free article] [PubMed] [Google Scholar]
- 42.Ryaboshapkina M, Hammar M. Human hepatic gene expression signature of non-alcoholic fatty liver disease progression, a meta-analysis. Sci Rep 2017;7:12361. [DOI] [PMC free article] [PubMed] [Google Scholar]
- 43.Ameyar-Zazoua M, Souidi M, Fritsch L, Robin P, Thomas A, Hamiche A, Percipalle P, et al. Physical and functional interaction between heterochromatin protein 1alpha and the RNA-binding protein heterogeneous nuclear ribonucleoprotein U. J Biol Chem 2009;284:27974–27979. [DOI] [PMC free article] [PubMed] [Google Scholar]
- 44.Mi L, Zhao XY, Li S, Yang G, Lin JD. Conserved function of the long noncoding RNA Blnc1 in brown adipocyte differentiation. Mol Metab 2017;6:101–110. [DOI] [PMC free article] [PubMed] [Google Scholar]
- 45.Huang EJ, Reichardt LF. Trk receptors: roles in neuronal signal transduction. Annu Rev Biochem 2003;72:609–642. [DOI] [PubMed] [Google Scholar]
- 46.Skaper SD. The neurotrophin family of neurotrophic factors: an overview. Methods Mol Biol 2012;846:1–12. [DOI] [PubMed] [Google Scholar]
- 47.Fenner BM. Truncated TrkB: beyond a dominant negative receptor. Cytokine Growth Factor Rev 2012;23:15–24. [DOI] [PubMed] [Google Scholar]
- 48.Vivacqua G, Renzi A, Carpino G, Franchitto A, Gaudio E. Expression of brain derivated neurotrophic factor and of its receptors: TrKB and p75NT in normal and bile duct ligated rat liver. Ital J Anat Embryol 2014;119:111–129. [PubMed] [Google Scholar]
Associated Data
This section collects any data citations, data availability statements, or supplementary materials included in this article.


