Abstract
Background
Novel haloemodin (HEI2) synthesized by modifying emodin, a traditional Chinese medicine component, possesses remarkable antibacterial activity, being much more effective than its parent nucleus, emodin.
Methods
Firstly, we discovered that HEI2 increases bacterial cell membrane permeability to potassium ions more drastically than emodin. We thus further investigated the interaction of haloemodin and protein using a fluorescence quenching and circular dichroism (CD) study based on bovine serum albumin (BSA).
Results
HEI2 spontaneously bound to BSA at Trp 212 residue (subdomain IIA) by hydrogen bonds and van der Waals interactions to forms HEI2-BSA complexes, and this binding decreased the α-helical content of BSA. We also confirmed that emodin bound to BSA by hydrophobic interaction alone.
Conclusions
These results suggest that the main responses for the substantial antibacterial activities of HEI2 are a disruption of the bacterial plasma membrane function and the interaction with biological functional proteins. Furthermore, the study of the interaction of drugs with BSA, which has a fluorescent group tryptophan residue similar to many bio-functional proteins, will be a simple and inexpensive scope-reducing method in screening new drugs.
Keywords: Haloemodin, antibacterial activity, bovine serum albumin (BSA), fluorescence quenching, circular dichroism (CD)
Introduction
Emodin (1,3,8-trihydroxy-6-methylanthraquinone, Figure 1A), an active anthraquinone component isolated from the root of Rheum palmatum L (1), is capable of a variety of bioactivities including anti-tumor (2), antioxidant (3,4), antibacterial, and vasorelaxant effects (5,6). Drugs containing an anthraquinone moiety such as daunorubicin (7) and mitoxantrone (8) have been used for inhibiting various cancer cells in the clinic. However, the low efficiency and bioavailability of emodin restrict its application in clinic for curing infections, cancers, etc. We therefore synthesized a class of novel haloemodins (Figure 1B) by introducing iodine substituents on its ring, and investigated their bioactivities in vitro and in vivo. As we expected, the novel haloemodins, including 2,4-diiodoemodin (HEI2), 2-iodioemodin (HEI1), and 2,4,5-triiodoemodin (HEI3) (Figure 1B), showed significant antibacterial activities against Gram-positive bacteria even for several drug-resistant clinical bacteria like methicillin-resistant Staphylococcus aureus (MRSA) and vancomycin-resistant Enterococcus faecium (VRE), with least 50 times more efficiency than its parent nucleus, emodin (9).
Figure 1.
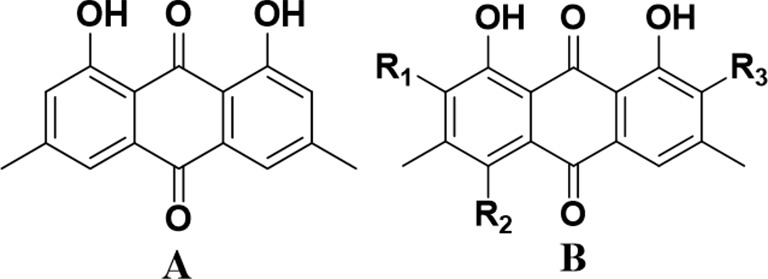
Chemical structures of emodin and haloemodins. (A) Emodin and (B) haloemodins. HEI1: R1 = I, R2 = R3 = H; HEI2: R1 = R2 = I, R3 = H; HEI3: R1 = R2 = R3 = I.
The plasma membrane is essential for bacterial cell viability due to its barrier and transport function, while bio-macromolecules, especially proteins, play a crucial role in bacterial cell division, multiplication, metabolism and pathogenicity. Examining the binding of small molecules with proteins has great value in pharmacology, pharmacy, and biochemistry. To investigate the mechanism underlying antibacterial activity promotion by iodine substitutions on the anthraquinone ring of emodin, the plasma membrane permeability of Gram-positive bacteria, Staphylococci aureus and Bacillus cereus, as detected in culture with haloemodins, and fluorescence spectroscopy, ultraviolet-visible (UV-vis) absorption spectrum, and circular dichroism (CD) were used to study the binding mechanism, binding parameters, binding site, and other features of the haloemodin and protein.
Bovine serum albumin (BSA) is one of the most extensively investigated proteins, as it is easy to acquire, is highly stable, and displays structural homology with human serum albumin (HSA) (10,11). BSA is a globular, heart-shaped protein, composed of three linearly arranged, homologous domains (I, II, and III) which are divided into 9 loop by 17 disulfide bonds (3), with each domain containing two sub-domains (A and B). From crystallographic data of X-rays, it has been revealed that the structure of the albumin in BSA is largely α-helical with the left polypeptide occurring in turns (7,12). BSA has two tryptophan residues that have intrinsic fluorescence (3). Trp-212 usually occurs in a hydrophobic binding pocket of subdomain IIA, while Trp-134 can be found on the surface of the subdomain IB. The location of the drug binding sites of BSA is usually in the hydrophobic cavities of subdomain IIA and IIIA (5). Therefore, a binding mode study of those drugs with proteins using BSA as a model protein may be a useful method for new drug screening and pharmacology research.
Methods
Materials
Albumin bovine V was purchased from Roche (USA), and emodin was purchased from Sigma (USA). The haloemodins including 2,4-diiodoemodin, 2-iodioemodin and 2,4,5-triiodoemodin (purity >95%) were synthesized in our lab with the structure being thoroughly clarified using high resolution mass spectrometer (HRMS) and nuclear magnetic resonance (NMR) (9). Staphylococcus aureus ATCC6538, Bacillus cereus ATCC10231, and Enterococcus faecalis ATCC 29212 were acquired from the College of Food Science and Nutritional Engineering, China Agricultural University, and the clinical isolates were acquired from the Institute of Clinical Pharmacology, Peking University. All other reagents were of analytical grade.
Preparation of stock solutions
The BSA solution (100 µM) was prepared in 50 mM phosphate buffer with pH 7.4 containing 100 mM NaCl. A stock solution of haloemodin (1 mM) was prepared in water. All stock solutions were stored at 4 °C.
Potassium measurements
To assess the free extracellular potassium, Staphylococcus aureus ATCC6538 and Bacillus cereus ATCC10231 were loaded with sodium phosphate buffer (50 mM, 20 mM NaCl) and 50 µM HEI2 for different time-points (20, 40, 60, 120, and 240 min) at 37 °C. The potassium concentration was measured by ZA3000 atomic absorption spectrophotometer (Hitachi Ltd., Tokyo, Japan).
UV-Vis absorbance spectroscopy
Measurements of the absorbance spectrum were conducted using a Beckman DU800 nucleic acid/protein analyzer (Beckman Coulter Ltd., CA, USA) with a quartz cell of 1 cm path length (13). The absorbance spectra were recorded with final BSA and a drug concentration of 50 µM.
Fluorescence spectroscopy
Fluorimetric experiments were conducted using a Hitachi F-7000 Fluorescence Spectrophotometer (Hitachi Ltd., Tokyo, Japan). A wavelength range of 300–500 nm was the setting for the fluorescence spectra assessment, which was performed by exciting the serum albumins at 280 nm using a slit width of 5 nm.
The quenching data were calculated using the Stern-Volmer equation (14):
| [1] |
Where F0 and F are the fluorescence intensity in the absence and presence of a quencher, Kq is the biomolecular quenching rate constant, [Q] is the concentration of quencher, Ksv is Stern-Volmer dynamic quenching constant, τ0 represents the average lifetime of the protein without the quencher, and the value of τ0 is 10−8 s (15).
When small molecules interact with a set of commensurate sites of a macromolecule, the equilibrium of free and bound molecules can be calculated using the following equation (16):
| [2] |
Where K and n represent the binding constant and the number of binding sites per albumin molecule.
Generally, small molecular substrates bind to protein through four kinds of forces: hydrogen bond, van der Waals force, electrostatic and hydrophobic interactions (3). For the purpose of confirming the acting forces influencing the drugs-BSA interactions, the temperature-dependent thermodynamic parameters were obtained using the Van’t Hoff equation (13):
| [3] |
Where K1 and K2 are the binding constant at the corresponding temperature, and R is the gas constant. The tests were conducted at 298 and 310 K. The fluctuations in enthalpy and entropy of quenching process are represented below by ΔH and ΔS, respectively .
ΔG related to the interaction of haloemodin with BSA is calculated as follows:
| [4] |
The transfer of energy occurs through the direct electrodynamic interaction of the primarily excited molecule and its neighbors, which occurs when the donor is able to produce fluorescent light, when the fluorescent emission spectrum of the donor and UV-vis absorbance spectrum of the acceptor overlap, and when they are separated by less than 8 nm (17). The binding distance (r) between the donor fluorophore and acceptor can be found using Forster resonance energy transfer (FRET) (18), which can be calculated as follows (19):
| [5] |
Where E is the energy transfer efficiency, F and F0 are the fluorescence intensities of BSA in the presence and absence of drugs, r is the distance between the acceptor and the donor, and R0 is the critical distance at which 50% of the excitation energy is transferred to the acceptor (20). It can be calculated as follows (21):
| [6] |
Where K2 is the spatial orientation factor, N is the refractive index of medium, φ is the quantum yield of the donor in the absence of the acceptor, and J is the overlap integral of the emission spectrum of the donor and the absorption spectrum of the acceptor. J is calculated as follows (21):
| [7] |
Where F(λ) is the fluorescence intensity of the fluorescent donor at wavelength λ, and where ε(λ) is the molar absorption coefficient of the acceptor at wavelength λ.
CD spectroscopy
The CD spectra between 190 and 260 nm were recorded on an AVIV Model 400 CD spectrometer (Aviv Biomedical, Inc., Lakewood, NJ, USA) at 25 °C, using a 0.2 cm path length cell. Spectra were gathered at intervals of 1 nm with a 1 s signal averaging time. Three scans were averaged, and all the data were expressed as mean residue ellipticity, [θ], in units of degrees·cm2·dmol−1.
The secondary structures of the protein were calculated by the software CDNN (Institut für Biotechnologie, Martin-Luther-Universität Halle-Wittenberg, Germany).
Results
Antibacterial activity analysis
In our previous study, we found that all three haloemodins inhibit Gram-positive bacteria growth including that of S. aureus, B. laterosporus, and E. faecium (9). The MIC of HEI2 for S. aureus ATCC 6538 was 0.002 mg/mL, which is less than 1% of that of emodin (0.256 mg/mL), and the same as that of vancomycin. Furthermore, the MIC of HEI2 for MRSA and VRE was 0.004–0.032 and 0.008–0.016 mg/mL, respectively, whereas the MIC of cefoxitin for MRSA was 0.128 mg/mL.
HEI2 increases bacterial cell membrane permeability for K+
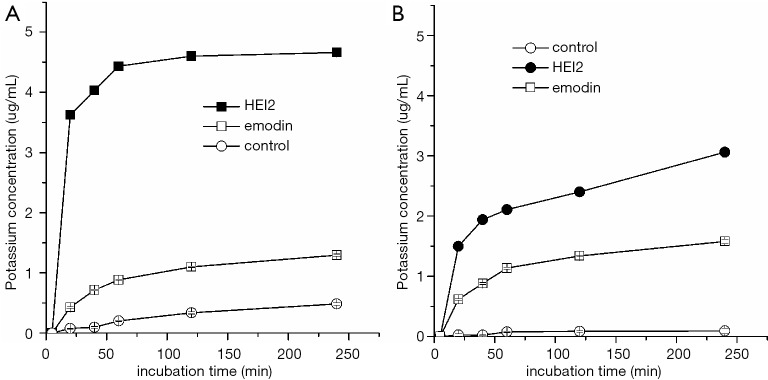
The plasma membrane is essential for bacterial cell viability due to its barrier and transport function. The potassium-ion permeability of bacterial cell plasma membrane is able to not only control the ion concentration in and out of cell, but can also alter the membrane potential and trans-membrane resting potential in turn. To reveal the effect of haloemodin on bacterial membrane permeability, the extracellular potassium concentrations of S. aureus ATCC6538 and B. cereus ATCC10231 treated with HEI2 for gradient time were determined using atomic absorption spectrometry. As shown in Figure 2, the extracellular potassium concentration of HEI2-S. aureus group rose to 3.2 and 4.5 µg/mL after about 20 and 60 min of treatment, respectively, while that of emodin-S. aureus group was 0.4 and 0.9 µg/mL, respectively. A similar phenomenon was observed in the B. cereus groups. These results imply that the introduction of iodine substituents to the anthraquinone ring of emodin can increase bacterial plasma membrane permeability for potassium ions, which is an important contributory factor in the inhibition against the growth of bacterial cells of HEI2.
Figure 2.
The extracellular potassium concentration of Staphylococcus aureus ATCC6538 (A), Bacillus cereus ATCC10231 (B) with emodin and HEI2. HEI2, 2,4-diiodoemodin.
Interaction of BSA with haloemodin
Quenching mechanism analysis
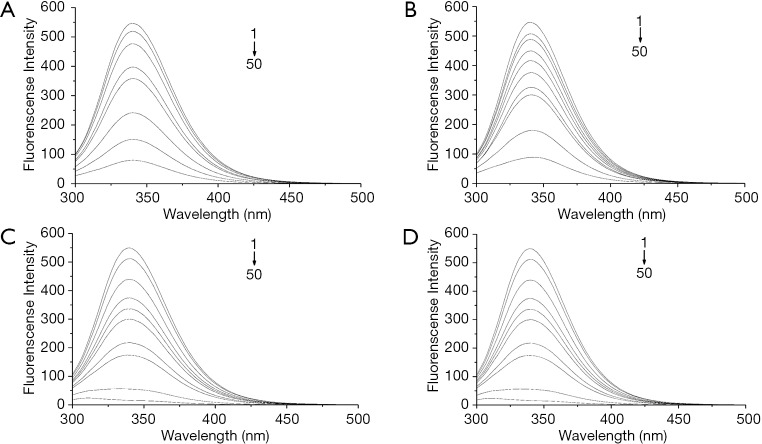
HEI2 showed intense inhibitory effect on both bacterial topoisomerase I and DNA gyrase (9). To simulate the effect of the interaction between these enzymes with haloemodin, we chose the classical protein, BSA, in a quenching mechanism study. The fluorescence of the tryptophan residues of BSA was monitored, and the maximum emission wavelength was 340 nm. The fluorescence quenching spectra of BSA with haloemodin are displayed in Figure 3A,B,C,D.
Figure 3.
Fluorescence quenching spectra of BSA with emodin (A), HEI1 (B), HEI2 (C), and HEI3 (D). BSA =5 µM, HEI1 = HEI2 = HEI3 =0, 1, 2, 3, 4, 5, 7.5, 10, 25, and 50 µM. BSA, bovine serum albumin; HEI1, 2-iodioemodin; HEI2, 2,4-diiodoemodin; HEI3, 2,4,5-triiodoemodin.
As is evident from Figure 3, a fluorescence intensity decrease of 340 nm was accompanied by an increase in haloemodin concentrations. The result revealed that haloemodin can bind to BSA and quench the fluorescence of tryptophan residues.
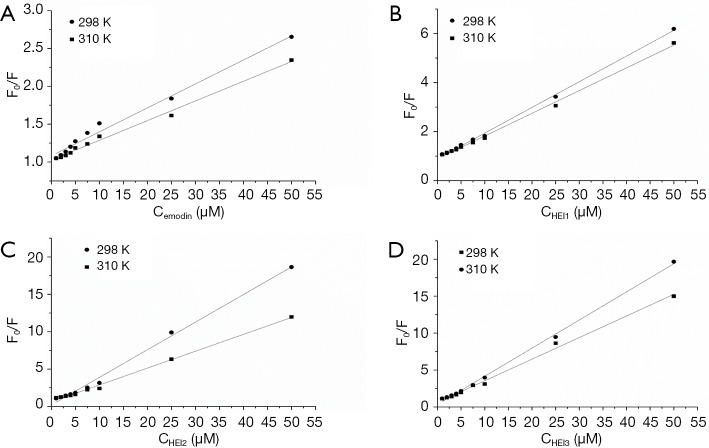
Dynamic quenching involves the quencher diffusing to the fluorophore within the duration of the exited state. Meanwhile, static quenching describes the development of a non-fluorescent fluorophore-quencher complex. The maximum diffusion-collision-quenching rate constant of various quenchers with a biopolymer is 2.0×10¹⁰ L·mol−1·s−1 (14). Sterm-Volmer plots for BSA with emodin derivatives are shown in Figure 4. The values of Kq derived from Eq. [1] is 3.16×10¹² and 1.02×10¹³; meanwhile, 3.69×10¹³ and 3.81×10¹³ L·mol−1·s−1 are the values for the binding of emodin, along with HEI1, HEI2, and HEI3 at 298 K (Table 1). This demonstrates that the quenching processes are static quenching.
Figure 4.
Sterm-Volmer plots for BSA with emodin (A), HEI1 (B), HEI2 (C) and HEI3 (D) at 298 and 310 K. BSA, bovine serum albumin; HEI1, 2-iodioemodin; HEI2, 2,4-diiodoemodin; HEI3, 2,4,5-triiodoemodin.
Table 1. Stern-Volmer quenching equation of emodin, HEI1, HEI2, and HEI3 to BSA.
| Variable | T/K | Kq (L/mol/s) | Ksv (L/mol) | r |
|---|---|---|---|---|
| Emodin | 298 | 3.16×10¹² | 3.16×10⁴ | 0.9933 |
| 310 | 2.60×10¹² | 2.60×10⁴ | 0.9967 | |
| HEI1 | 298 | 1.02×10¹³ | 1.02×10⁵ | 0.9950 |
| 310 | 9.26×10¹² | 9.26×10⁴ | 0.9985 | |
| HEI2 | 298 | 3.69×10¹³ | 3.69×10⁵ | 0.9981 |
| 310 | 2.26×10¹³ | 2.26×10⁵ | 0.9975 | |
| HEI3 | 298 | 3.81×10¹³ | 3.81×10⁵ | 0.9976 |
| 310 | 2.93×10¹³ | 2.93×10⁵ | 0.9990 |
r is the correlation coefficient. HEI1, 2-iodioemodin; HEI2, 2,4-diiodoemodin; HEI3, 2,4,5-triiodoemodin; BSA, bovine serum albumin.
The decrease of Kq and Ksv with a rising temperature also suggests that quenching should be ascribed to complex formation and not dynamic collision (22). Also, the Ksv value of haloemodin was greater than that of emodin, resulting in the haloemodin exhibiting a stronger quenching ability than emodin. The higher Ksv and Kq values for the HEI2-BSA system imply that HEI2 quenches BSA through complexation more effectively than emodin.
Binding constant and the binding site number
Plots of log(F0-F)/F versus log[Q] are illustrated in Figure 5, while the values of binding constant K and the number of binding sites per BSA are shown in Table 2. The binding capacity of emodin and haloemodin declined with increasing temperature, suggesting that emodin/haloemodin-BSA was sensitive to temperature. The values of n are almost equal to 1, which shows that there was a single binding site in BSA, and the drugs were most likely bound to Trp-212 within the hydrophobic pocket of subdomain IIA. The n value for emodin smaller than 1 indicated that emodin was limited to being bound to BSA (23,24). For HEI2-BSA, the n value was bigger than 1, which corresponded to a powerful binding force between HEI2 and BSA. The data revealed that the binding ability of HEI2 to emodin was stronger than that of BSA.
Figure 5.
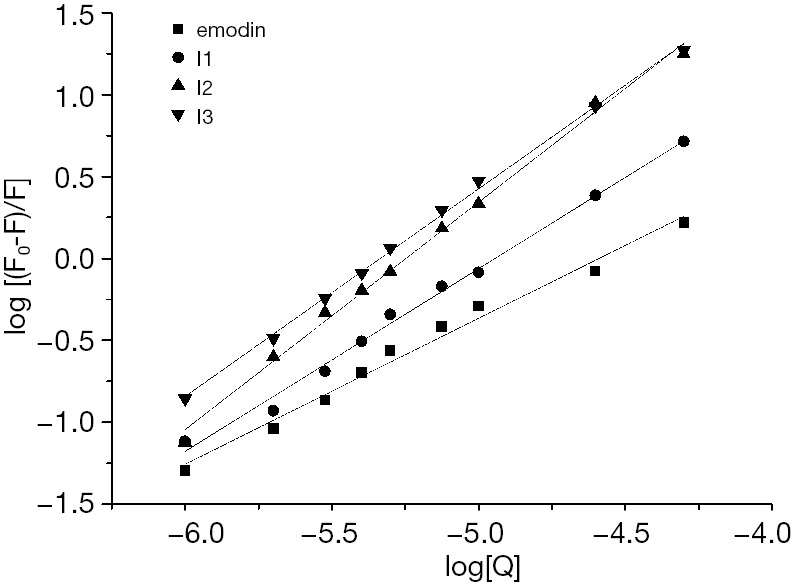
Double-log plots of BSA-haloemodin system. BSA, bovine serum albumin.
Table 2. The n and K value of BSA with emodin, HEI1, HEI2, and HEI3.
| Variable | Emodin | HEI1 | HEI2 | HEI3 |
|---|---|---|---|---|
| K | ||||
| 298 | 1.23×10⁴ | 3.26×10⁵ | 1.93×10⁷ | 5.75×10⁶ |
| 310 | 8.67×10³ | 2.45×10⁵ | 7.87×10⁵ | 4.88×10⁶ |
| n | 0.89 | 1.10 | 1.39 | 1.27 |
BSA, bovine serum albumin; HEI1, 2-iodioemodin; HEI2, 2,4-diiodoemodin; HEI3, 2,4,5-triiodoemodin.
Thermodynamic parameters and binding modes
On the basis of the binding constants that were acquired at different temperatures (298 and 310 K), the alteration of entropy (ΔS) and enthalpy (ΔH) values were found using Eq. [3], while the free energy change (ΔG) was found using Eq. [4]. The results are presented in Table 3. The importance of the thermodynamic parameters in the protein association process has been presented by Ross and Subramanian (25). The negative ΔG value indicated that the interaction process was spontaneous. Consequently, the BSA-haloemodin binding process must have been spontaneous. As ΔH was very small (almost 0), its negative value cannot be accounted for by electrostatic interactions. In minor interactions between molecules and protein, a positive ΔS value is usually considered to be proof of a hydrophobic interaction as the water molecules have a more random configuration than when they are in an organized mode around the drug and protein (26). The negative values of ΔH and ΔS indicate that the forces between HEI2 and BSA molecules consisted mostly of hydrogen bonds and van der Waals interactions. Furthermore, the negative ΔH and positive ΔS value s suggest that hydrophobic interactions were critically involved in the binding process of emodin, HEI1, and HEI3 with BSA. The primary forces informing the emodin-BSA and HEI2-BSA interactions were different, which gave rise to varying compound stabilities; this may explain the variation in antibacterial activity.
Table 3. Thermodynamic parameters of the interaction between BSA and emodin, HEI1, HEI2, and HEI3.
| Variable | ΔH | ΔG | ΔS |
|---|---|---|---|
| Emodin | −22.17 | −22.47 | 1.01 |
| HEI1 | −18.16 | −31.45 | 44.60 |
| HEI2 | −204.79 | −41.56 | −547.74 |
| HEI3 | −10.5 | −38.56 | 94.17 |
BSA, bovine serum albumin; HEI1, 2-iodioemodin; HEI2, 2,4-diiodoemodin; HEI3, 2,4,5-triiodoemodin.
It is also worth noting that, compared to emodin-BSA, the value of ΔH for haloemodin-BSA was dramatically lower, suggesting that the modified emodin-BSA complex is more stable than emodin-BSA.
Energy transfer between BSA and haloemodin
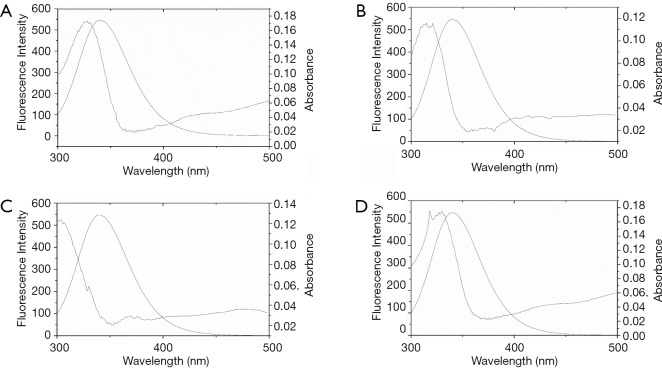
To evaluate the distance between haloemodin and the tryptophan residues in BSA, the overlap of the fluorescence spectrum of BSA with the absorption of the haloemodin at 298 K were studied (Figure 6). The values of R0 could be calculated with the values of K2=2/3, N=1.336, φ=0.15 (27). The r values are 2.29, 2.27, 2.07, 2.15 nm for emodin, HEI1, HEI2, HEI3. The distance between Trp 212 residue of BSA and drugs are far lower than 8 nm indicating the energy transfer from BSA to drugs and the presence of static quenching mechanism (28). Meanwhile, the distance for HEI2-BSA was smaller than that for emodin-BSA, showing a more constant binding process in HEI2-BSA.
Figure 6.
Spectral overlap of emodin and haloemodin absorption spectra with BSA fluorescence. (A) Emodin; (B) HEI1; (C) HEI2; (D) HEI3. BSA =1 µM, emodin = HEI1 = HEI2 = HEI3 =5 µM. BSA, bovine serum albumin; HEI1, 2-iodioemodin; HEI2, 2,4-diiodoemodin; HEI3, 2,4,5-triiodoemodin.
Conformational investigation of BSA induced by haloemodin
To verify the binding mechanism of the haloemodin-BSA complex and the secondary structural changes of BSA, CD studies were carried out on the haloemodin-BSA complex and BSA.
Figure 7 shows the CD spectra of BSA with haloemodin. There are two negative bands (222 and 208 nm) in the distant UV region which have a typical α-helix protein structure (29,30). These bands resulted from the n-π* transition in the peptide bond of α-helix. The CD data induced the partial unfolding of the α-helix structure. The α-helix content of BSA, as calculated by the CD spectra deconvolution software, is presented in Table 4. It can be seen that haloemodin, especially HEI2, could alter the secondary structure of BSA, suggesting that the interaction of haloemodin with BSA can lead to a change in the microenvironment of the protein. This accords with the results acquired via fluorescence spectroscopy.
Figure 7.
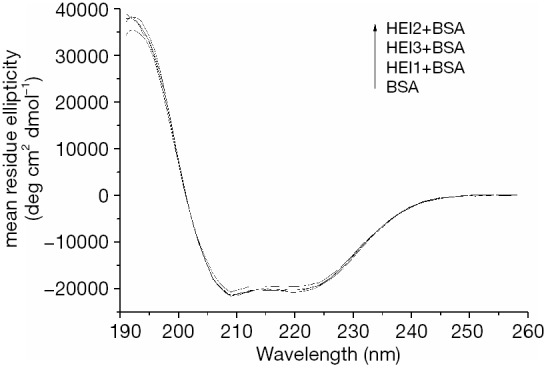
CD spectra of free BSA and its complexation with HEI1, HEI2, and HEI3. BSA = HEI1 = HEI2 = HEI3 =1 µM. BSA, bovine serum albumin; HEI1, 2-iodioemodin; HEI2, 2,4-diiodoemodin; HEI3, 2,4,5-triiodoemodin.
Table 4. The contents of α-helix in the BSA-haloemodin system.
| Experimental samples | The content of α-helix (%) |
|---|---|
| 1 ìM BSA | 67.2 |
| 1 ìM BSA + 1 μM HEI1 | 66.1 |
| 1 ìM BSA + 1 μM HEI2 | 61.9 |
| 1 ìM BSA + 1 μM HEI3 | 64.9 |
BSA, bovine serum albumin; HEI1, 2-iodioemodin; HEI2, 2,4-diiodoemodin; HEI3, 2,4,5-triiodoemodin.
Discussion
The haloemodin derived in our lab from the Chinese traditional medicine, emodin, exhibits strong antibacterial activity against Gram-positive bacterial strains, including those generally resistant to drugs, such as MRSA and VRE. Compared with emodin, haloemodin more rapidly increases the bacterial plasma membrane permeability for potassium ions. More importantly, the haloemodin binds more tightly and more stably to the proteins than emodin. These results partially explain the stronger antibacterial activities of haloemodin over their parent nucleus, emodin.
In this study, BSA was used as model protein to investigate the binding mode of haloemodin and emodin with protein. We found that HEI2 binds to BSA and forms HEI2-BSA complexes at Trp-212 within the hydrophobic pocket of subdomain IIA. The thermodynamic parameters suggest that the hydrogen bonds and van der Waals interactions are key actors in the HEI2-BSA binding process, while in the emodin-BSA complex, hydrophobic interactions play the main role. Moreover, the distance between HEI2 and the BSA binding site, Trp 212 (subdomain II) of BSA, is shorter than that of emodin. HEI2 also reduces the α-helix of BSA and changes the secondary protein structure, while emodin induces no influence on the secondary protein structure. These results indicate that HEI2 has a stronger affinity to BSA than emodin, which support our previous findings wherein HEI2 hindered the catalytic activities of DNA gyrase and bacterial topoisomerase I more efficiently than emodin (22). Interestingly, it can be found in most bioactive proteins, such as BSA, E. coli DNA gyrase (GenBank: AHN18133.1), S. aureus DNA gyrase (GenBank: CAA50570.1), and E. coli Topo I (GenBank: KDN05281.1). Thus, we can consider looking at the binding mode of small molecules and BSA as a viable alternative approach to investigating the interaction of small molecules and proteins.
In addition, since BSA is an economical, commercialized, and extensively studied protein, the binding mode study of drugs with proteins using BSA as a model protein can be a novel, practical method for the screening of new drugs and the conducting of pharmacological research.
Acknowledgments
Funding: This work was financially supported by the National ‘‘12th-5-Year’’ Plan Project of China (2006BAB04A14 and 2011BAJ07B04)’’ and the National Natural Science Foundation of China (No. 20972105).
Ethical Statement: The authors are accountable for all aspects of the work in ensuring that questions related to the accuracy or integrity of any part of the work are appropriately investigated and resolved.
Footnotes
Conflicts of Interest: The authors have no conflicts of interest to declare.
References
- 1.Wang L, Li D, Bao C, et al. Ultrasonic extraction and separation of anthraquinones from Rheum palmatum L. Ultrason Sonochem 2008;15:738-46. 10.1016/j.ultsonch.2007.12.008 [DOI] [PubMed] [Google Scholar]
- 2.Dai G, Ding K, Cao Q, et al. Emodin suppresses growth and invasion of colorectal cancer cells by inhibiting VEGFR2. Eur J Pharmacol 2019;859:172525. 10.1016/j.ejphar.2019.172525 [DOI] [PubMed] [Google Scholar]
- 3.Ahmad E, Sen P, Khan RH. Structural stability as a probe for molecular evolution of homologous albumins studied by spectroscopy and bioinformatics. Cell Biochem Biophys 2011;61:313-25. 10.1007/s12013-011-9214-4 [DOI] [PubMed] [Google Scholar]
- 4.Xia S, Ni Y, Zhou Q, et al. Emodin Attenuates Severe Acute Pancreatitis via Antioxidant and Anti-inflammatory Activity. Inflammation 2019;42:2129-38. 10.1007/s10753-019-01077-z [DOI] [PubMed] [Google Scholar]
- 5.Ji X, Liu X, Peng Y, et al. Comparative analysis of methicillin-sensitive and resistant Staphylococcus aureus exposed to emodin based on proteomic profiling. Biochem Biophys Res Commun 2017;494:318-24. 10.1016/j.bbrc.2017.10.033 [DOI] [PubMed] [Google Scholar]
- 6.Zhou XM, Chen QH. Biochemical study of Chinese rhubarb. XXII. Inhibitory effect of anthraquinone derivatives on Na+-K+-ATPase of the rabbit renal medulla and their diuretic action. Yao Xue Xue Bao 1988;23:17. [PubMed] [Google Scholar]
- 7.Han W, Sun J, Feng L, et al. Autophagy inhibition enhances daunorubicin-induced apoptosis in K562 cells. PLoS One 2011;6:e28491. 10.1371/journal.pone.0028491 [DOI] [PMC free article] [PubMed] [Google Scholar]
- 8.Mikusová V, Tichý A, Rezáčová M, et al. Mitoxantrone in combination with a DNA-PK inhibitor: possible therapy of promyelocytic leukaemia resistant forms. Folia Biol (Praha) 2011;57:200-5. [PubMed] [Google Scholar]
- 9.Duan F, Li X, Cai S, et al. Haloemodin as novel antibacterial agent inhibiting DNA gyrase and bacterial topoisomerase I. J Med Chem 2014;57:3707-14. 10.1021/jm401685f [DOI] [PubMed] [Google Scholar]
- 10.Carter DC, Ho JX. Structure of serum albumin. Advances in protein chemistry. Academic Press 1994;45:153-203. [DOI] [PubMed]
- 11.Olson RE, Christ DD. Plasma protein binding of drugs. Annual reports in medicinal chemistry. Academic Press 1996;31:327-36.
- 12.Papadopoulou A, Green RJ, Frazier RA. Interaction of flavonoids with bovine serum albumin: a fluorescence quenching study. J Agric Food Chem 2005;53:158-63. 10.1021/jf048693g [DOI] [PubMed] [Google Scholar]
- 13.Ghosh KS, Sahoo BK, Dasgupta S. Spectrophotometric studies on the interaction between (−)-epigallocatechin gallate and lysozyme. Chem Phys Lett 2008;452:193-7. 10.1016/j.cplett.2007.12.018 [DOI] [Google Scholar]
- 14.Eftink MR, Ghiron C. Fluorescence quenching studies with proteins. Anal Biochem 1981;114:199-227. 10.1016/0003-2697(81)90474-7 [DOI] [PubMed] [Google Scholar]
- 15.Lakowicz JR, Weber G. Quenching of fluorescence by oxygen. Probe for structural fluctuations in macromolecules. Biochemistry 1973;12:4161-70. 10.1021/bi00745a020 [DOI] [PMC free article] [PubMed] [Google Scholar]
- 16.Xie MX, Xu XY, Wang YD. Interaction between hesperetin and human serum albumin revealed by spectroscopic methods. Biochim Biophys Acta 2005;1724:215-24. [DOI] [PubMed]
- 17.Főrster T. 10th Spiers Memorial Lecture. Transfer mechanisms of electronic excitation. Discussions of the Faraday Society 1959;27:7-17. 10.1039/DF9592700007 [DOI] [Google Scholar]
- 18.Sun W, Jiao K. Linear sweep voltammetric determination of protein based on its interaction with Alizarin Red S. Talanta 2002;56:1073-80. 10.1016/S0039-9140(01)00628-2 [DOI] [PubMed] [Google Scholar]
- 19.Heller DP, Greenstock CL. Fluorescence lifetime analysis of DNA intercalated ethidium bromide and quenching by free dye. Biophys Chem 1994;50:305-12. 10.1016/0301-4622(93)E0101-A [DOI] [PubMed] [Google Scholar]
- 20.Cui FL, Fan J, Ma DL, et al. A study of the interaction between a new reagent and serum albumin by fluorescence spectroscopy. Anal Lett 2003;36:2151-66. 10.1081/AL-120023708 [DOI] [Google Scholar]
- 21.Förster T. Delocalized Excitation and Excitation Transfer. Florida, Tallahassee: Florida State University, 1965:Bulletin (18). [Google Scholar]
- 22.Albrecht C, Lakowicz JR: Principles of fluorescence spectroscopy. Anal Bioanal Chem 2008;390:1223-24. 10.1007/s00216-007-1822-x [DOI] [Google Scholar]
- 23.Tang J, Luan F, Chen X. Binding analysis of glycyrrhetinic acid to human serum albumin: fluorescence spectroscopy, FTIR, and molecular modeling. Bioorg Med Chem 2006;14:3210-17. 10.1016/j.bmc.2005.12.034 [DOI] [PubMed] [Google Scholar]
- 24.Pace C N, Vajdos F, Fee L, et al. How to measure and predict the molar absorption coefficient of a protein. Protein Sci 1995;4:2411-23. 10.1002/pro.5560041120 [DOI] [PMC free article] [PubMed] [Google Scholar]
- 25.Ross PD, Subramanian S. Thermodynamics of protein association reactions: forces contributing to stability. Biochemistry 1981;20:3096-102. 10.1021/bi00514a017 [DOI] [PubMed] [Google Scholar]
- 26.Tian J, Liu J, Hu Z, et al. Interaction of wogonin with bovine serum albumin. Bioorg Med Chem 2005;13:4124-9. 10.1016/j.bmc.2005.02.065 [DOI] [PubMed] [Google Scholar]
- 27.Miller JN. Recent advances in molecular luminescence analysis. Proc Anal Div Chem Soc 1979;16:203-8. [Google Scholar]
- 28.Lu Y, Cui F, Fan J, et al. Interaction of human serum albumin with N-(4-ethoxyphenyl)-N′-(4-antipyrinyl) thiourea using spectroscopies and molecular modeling method. J Lumines 2009;129:734-40. 10.1016/j.jlumin.2009.02.005 [DOI] [Google Scholar]
- 29.Norde W, Giacomelli CE. BSA structural changes during homomolecular exchange between the adsorbed and the dissolved states. J Biotechnol 2000;79:259-68. 10.1016/S0168-1656(00)00242-X [DOI] [PubMed] [Google Scholar]
- 30.Greenfield N, Fasman GD. Computed circular dichroism spectra for the evaluation of protein conformation. Biochemistry 1969;8:4108-16. 10.1021/bi00838a031 [DOI] [PubMed] [Google Scholar]


