Immune thrombocytopenia (ITP) is an autoimmune disease characterized by a low platelet count caused by accelerated platelet destruction and/or impaired platelet production. Chronic ITP is defined as ITP lasting for more than 12 months.1 T-cell abnormalities are implicated in ITP pathogenesis. Clonal T-cell receptor (TCR) patterns have been observed in ITP patients, with higher prevalence in non-responders to splenectomy and rituximab.2,3 Recently, incorporation of next-generation sequencing technologies has allowed identification of specific peptide sequence of complementarity-determining region 3 (CDR3) of TCRβ subunit (encoded by TRB gene).4 Using this method, post-treatment polyclonal TRB repertoire was observed in 90% of responders to rituximab-dexamethasone therapy, and in 50% of non-responders or relapsers.5 How the TRB repertoires associate with eltrombopag treatment response remains unknown.
Eltrombopag, a thrombopoietin receptor agonist (TPO-RA), has proven efficacy in ITP patients. Besides stimulating platelet production to compensate pathogenic platelet destruction, eltrombopag has demonstrated immune-modulatory effects: increased regulatory B-cell numbers,6 improved regulatory T-cell function,7 and reduced phagocytic capacity of monocyte-derived macrophages on opsonized platelets.8 Moreover, a fraction of responders showed sustained treatment-free platelet responses after discontinuation of eltrombopag.9 Here, we describe longitudinal effects of eltrombopag in eltrombopag responders and non-responders using whole blood transcriptome analysis. Moreover, through TRB repertoire profiling, we identified an association of clonal T-cell populations with non-response to eltrombopag in patients with chronic ITP. This study provides the first insights over time into blood transcriptome and clonal T-cell correlates of response and non-response to eltrombopag therapy.
Nineteen patients with chronic ITP who received eltrombopag as monotherapy during sample collections were included. The response criteria are modified from the International Working Group guidelines (Online Supplementary Appendix).1 Responders (R, n=12) and non-responders (NR, n=7) were similar in age (R: 43.08±24.43 years, NR: 46.86±24.06 years); duration of ITP (R: 12.42±9.75 years, NR: 13.14±10.62 years); number of previous treatments (R: 4.91±2.81, NR: 6.43±4.01); and pretreatment platelet count (R: 16±9.14×10⁹/L, NR: 30±19.44 x10⁹/L). Patient information and sample usage for assays of this study are summarized in Online Supplementary Table S1. Stratification based on the number of prior treatments or disease duration did not reveal associations with eltrombopag response (Online Supplementary Table S2).
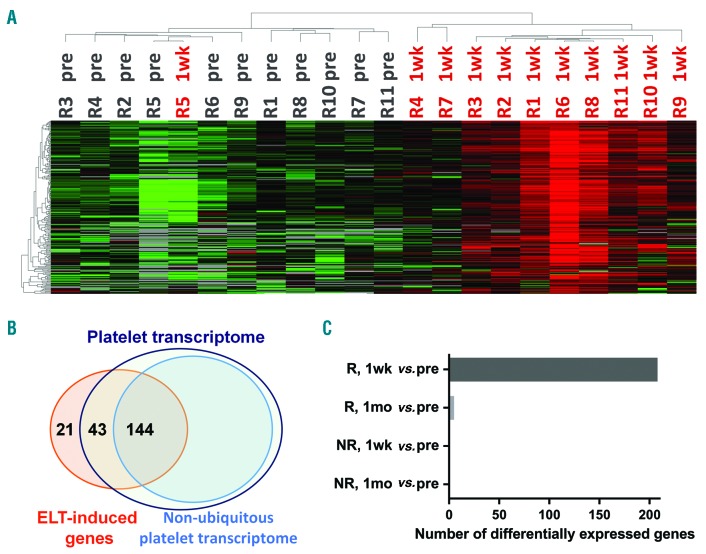
To assess the impact of eltrombopag on gene expression, we performed 3SEQ (3′-end sequencing for expression quantification) analysis10,11 on globin-depleted blood RNA samples. Paired analysis of the Significance Analysis of Microarrays-Seq (SAMseq) algorithm was used to obtain differentially expressed genes. Compared with pretreatment point, responders demonstrated an induction of 208 genes at the 1-week time point (Online Supplementary Table S3), which distinguished these two sample points by unsupervised hierarchical clustering (Figure 1A).
Figure 1.
Profiles of eltrombopag (ELT)-induced genes. (A) Heat map of ELT-induced genes at pretreatment (pre) and 1-week (1wk) time points in responders (R) with unsupervised clustering. Red to green colors represent relative high to low expression levels of individual genes; gray indicates below detection level. (B) Venn diagram of over-lapping genes between ELT-induced genes obtained in this study and published platelet transcriptome.12 (C) Numbers of differentially expressed genes between various samples. NR: non-responders; 1mo: 1-month.
Consistent with the role of eltrombopag on platelet production, 90% (187 of 208) of the eltrombopag-induced genes are present in the platelet transcriptome,12 including platelet-specific genes (e.g., ITGA2B, NRGN, PF4, and PPBP) (Figure 1B and Online Supplementary Table S3).
Based on Ingenuity Pathways Analysis (IPA), these eltrombopag-induced genes were linked with decreased bleeding time and decreased thrombocytopenia (Online Supplementary Table S4), and were associated with platelet-related pathways: cellular effects of sildenafil, extrinsic prothrombin activation pathway, clathrin-mediated endocytosis signaling, and integrin signaling (Online Supplementary Table S5). In addition, the upstream transcriptional regulators of eltrombopag-induced genes (Online Supplementary Table S6) included: GATA1 and THPO which are important and specific regulators for hematopoiesis and megakaryopoiesis, VIPAS39, which regulates platelet α-granule genes, and TGFB1, which is abundant in platelet granules and has multiple functions according to the specific cellular environment.
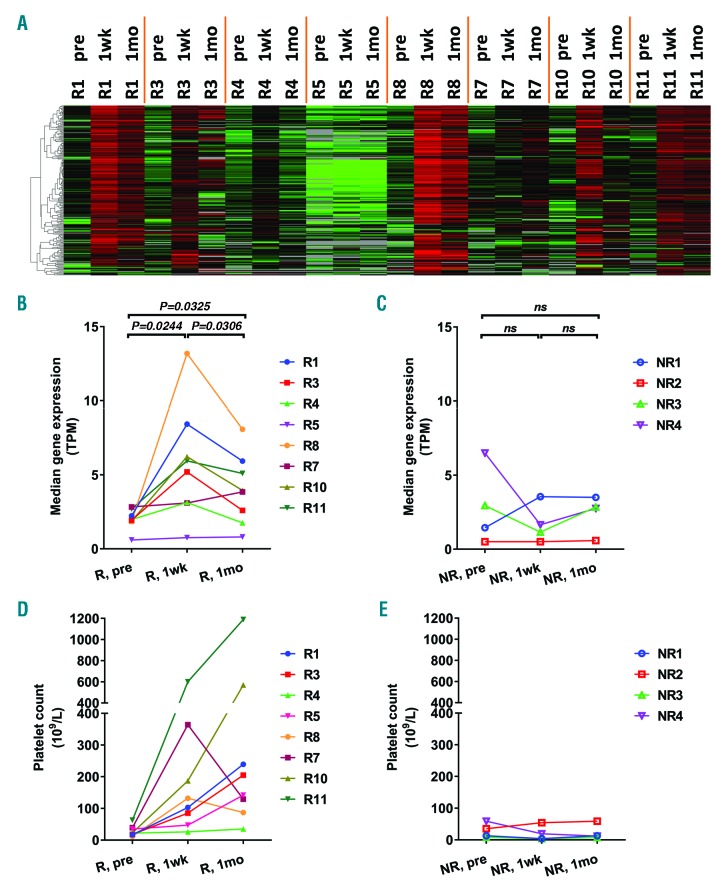
Surprisingly, despite continued eltrombopag treatment and further increases in platelet counts, only five genes remained induced at the 1-month time point in responders: E2F1, PF4V1, CRYM, GLOD5, and NGFRAP1 (Figure 1C and Online Supplementary Table S3). We therefore evaluated the longitudinal expression pattern of the 208 eltrombopag-induced genes in patients who had sequencing data available for all three time points (pretreatment, 1-week, and 1-month). Responders shared a common trend of these genes: the lowest expression at pretreatment followed by the highest expression at the 1-week time point, which then decreased at the 1-month time point to a level which was, however, still higher than that at the pretreatment time point (Figure 2A). This trend is shown in Figure 2B by quantifying the overall expression of eltrombopag-induced genes of each individual. The differences between any two sample points were statistically significant. In contrast to gene expression pattern with a peak at 1-week, most responders showed continuous platelet count increase (Figure 2D). Of note, three responders had intravenous immunoglobulin (IVIG) treatment days before pretreatment sample collection (Online Supplementary Table S1), and their pre-IVIG (baseline) platelet counts are plotted in Figure 2D. Despite the transient increase in platelet count induced by IVIG, these patients displayed a similar gene expression response to eltrombopag therapy (Figure 1A and 2A and B).
Figure 2.
Sequential expression of eltrombopag (ELT)-induced genes. (A) Heat map of ELT-induced genes in responders (R) at pretreatment (pre), 1-week (1wk), and 1-month (1mo) time points. Median expression levels of ELT-induced genes (B and C) and platelet count (D and E) at various time points were plotted for responders (R) and non-responders (NR). Three responders had intravenous immunoglobulin (IVIG) treatment 4-8 days before pretreatment sample collection, and their baseline platelet count prior to IVIG (R10, R11) or ELT (R7) treatment were plotted (D). Differences between time points were assessed by paired Student t-test. TPM: transcripts per kilobase million; ns: not significant.
Collectivelly, we observed a novel longitudinal effect of eltrombopag therapy over time in responders. The tapered expression after the initial induction of eltrombopag-induced genes in the context of continuous platelet response suggests different stages of eltrombopag response. At the 1-week time point, responders demonstrated the highest expression of platelet genes (Figure 1A and 2A and B) in parallel with platelet count increase (Figure 2D). As RNA in anucleate platelets is inherited from megakaryocytes and undergoes time-dependent decay, and the amount of platelet RNA is positively correlated with the number of newly formed platelets,13 this first stage likely reflects eltrombopag-induced production of young, RNA-rich platelets that support the initial platelet response. Subsequently, going towards the second stage (1-month point), platelet-gene expression decreased compared with the 1-week time point while platelet counts continued to increase. This observation may be due to a reduction in platelet destruction allowing accumulation of platelets and a net increase in platelet number despite less intense platelet production. Consistent with this hypothesis, we observed a reduction in platelet count-normalized platelet-specific genes expression at 1-month compared with the pretreatment and 1-week time points (Online Supplementary Figure S1).
TGFB1 was identified as one of the upstream regulators of eltrombopag-induced genes. Its encoded protein TGFβ1 is abundant in platelets, and is elevated in circulation in responders to TPO-RA with improved regulatory T-cell function7 and reduced phagocytic activity of macrophages.8 Moreover, TGFβ1 has also been shown to inhibit megakaryopoiesis in healthy people14 and in ITP patients.15 These make TGFB1 a plausible mediator, not only to mitigate platelet immune destruction, but also to slow megakaryopoiesis after initial induction of platelet production, which helps to restore platelet homeostasis in patients responding to eltrombopag. In addition, the initial increase in platelets in eltrombopag responders could dilute out existing antiplatelet autoantibodies in these patients, thereby decreasing platelet destruction and further supporting a platelet count response not directly attributable to eltrombopag.
No differential gene expression was detected in non-responders at the 1-week or 1-month time points compared with that at the pretreatment time point (Figure 1C). Non-responders did not demonstrate significant changes in eltrombopag-induced genes (Figure 2C) or platelet count (Figure 2E). Patients were tested for mutations in MPL, the TPO receptor. No mutations were observed, consistent with an intact ligand-receptor axis.
Next-generation sequencing-based TRB repertoire analysis4 was performed in ten patients (5 R and 5 NR, based on availability of blood genomic DNA), at two separate time points. The total number of TRB sequences (1.25±0.8×10⁶ vs. 0.99±0.57×10⁶) and unique CDR3 sequences detected (12.24±0.45×10³ vs. 10.00±0.45×10³) were similar between samples from responders (n=10) and non-responders (n=10). No associations between response and gene usage of variable-diversity-joining segments of TRB were observed.
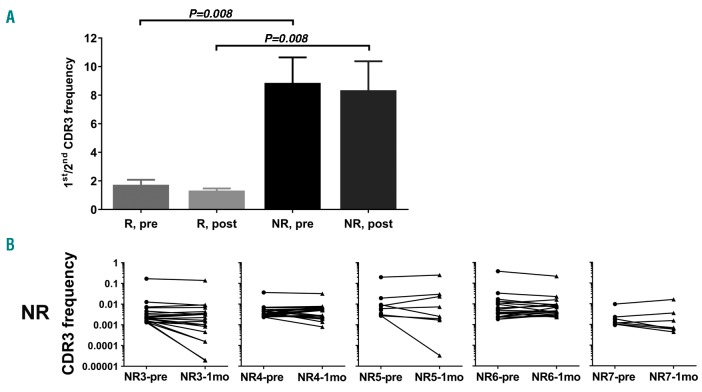
Clonality was assessed by the ratio of the first over the second most common CDR3 sequences in each patient at both time points (Figure 3A). The ratio of non-responders is significantly higher than that of the responders at both the pretreatment (8.86±4.00 vs. 1.73±0.79; P=0.008) and the post treatment (8.35±4.54 vs. 1.32±0.34; P=0.008) time points. Moreover, the top clones in non-responders remain unchanged after one month of eltrombopag treatment (Figure 3B), indicating a selected clonal expansion of T cells expressing a dominant TRB CDR3 in non-responders, which persisted with eltrombopag treatment. Whether these clones are active against platelets and megakaryocytes or represent a dysfunctional autoimmune system resistant to treatment remains to be clarified.
Figure 3.
Clonal TRB and non-response to eltrombopag (ELT). (A) Comparison of ratios of the 1st/2nd TRB CDR3 frequencies in responders (R) and non-responders (NR) at pretreatment (pre) and post-treatment (post) time points. Mean and standard error were plotted. Statistical difference was assessed by Mann-Whitney U test. (B) Frequencies of the top 20 TRB CDR3 clonotypes of individual non-responders (NR). Frequencies of the same clone were linked to show how these changed. 1mo: 1-month.
In contrast to eltrombopag responders, non-responders did not exhibit eltrombopag-induced genes in blood, despite an intact eltrombopag-MPL axis. Possible explanations for this observation include immune responses either directed against megakaryocytes and/or interfering with platelet production, or profound platelet destruction off-setting eltrombopag effect and preventing platelet accumulation in the circulation. In one study, macrophages from non-responders to eltrombopag displayed a significantly higher phagocytic capacity than that from responders.8 In the light of these results, more aggressive, immunosuppressive interventions might be considered for management of eltrombopag-resistant ITP in a clinical trial setting.
In summary, using unbiased genetic approaches to study a cohort of heavily-pretreated chronic ITP patients, we revealed novel sequential effects of eltrombopag which may help to restore platelet homeostasis in responders, and identified an association of TRB clonal populations and non-response to eltrombopag. These findings provide unique insights into the mechanism of eltrombopag response and suggest potential treatment options in patients with eltrombopag-resistant ITP.
Acknowledgements
The authors would like to thank Naznin Haq and Margaret Morrissey for collecting patient information related to this study. Authors thank Stanford Center for Genomics and Personalized Medicine for performing Illumina HiSeq sequencing.
Footnotes
Funding: this study was supported in part by research fund from the GlaxoSmithKline to JLZ (investigator initiated grant, CID number: 259950) and JBB; and from the Children’s Cancer and Blood Foundation to JBB.
Information on authorship, contributions, and financial & other disclosures was provided by the authors and is available with the online version of this article at www.haematologica.org.
References
- 1.Rodeghiero F, Stasi R, Gernsheimer T, et al. Standardization of terminology, definitions and outcome criteria in immune thrombocytopenic purpura of adults and children: report from an international working group. Blood.2009;113(11):2386–2393. [DOI] [PubMed] [Google Scholar]
- 2.Fogarty PF, Rick ME, Zeng W, Risitano AM, Dunbar CE, Bussel JB. T cell receptor VB repertoire diversity in patients with immune thrombocytopenia following splenectomy. Clin Exp Immunol.2003;133(3):461–466. [DOI] [PMC free article] [PubMed] [Google Scholar]
- 3.Stasi R, Del Poeta G, Stipa E, et al. Response to B-cell depleting therapy with rituximab reverts the abnormalities of T-cell subsets in patients with idiopathic thrombocytopenic purpura. Blood.2007;110(8):2924–2930. [DOI] [PubMed] [Google Scholar]
- 4.Xu L, You X, Zheng P, et al. Methodologic considerations in the application of next-generation sequencing of human TRB repertoires for clinical use. J Mol Diagn.2017;19(1):72–83. [DOI] [PMC free article] [PubMed] [Google Scholar]
- 5.Chapin J, Lee CS, Zhang H, Zehnder JL, Bussel JB. Gender and duration of disease differentiate responses to rituximab-dexamethasone therapy in adults with immune thrombocytopenia. Am J Hematol.2016;91(9):907–911. [DOI] [PubMed] [Google Scholar]
- 6.Li X, Zhong H, Bao W, et al. Defective regulatory B-cell compartment in patients with immune thrombocytopenia. Blood.2012;120(16):3318–3325. [DOI] [PMC free article] [PubMed] [Google Scholar]
- 7.Bao W, Bussel JB, Heck S, et al. Improved regulatory T-cell activity in patients with chronic immune thrombocytopenia treated with thrombopoietic agents. Blood.2010;116(22):4639–4645. [DOI] [PMC free article] [PubMed] [Google Scholar]
- 8.Liu XG, Liu S, Feng Q, et al. Thrombopoietin receptor agonists shift the balance of Fcγ receptors toward inhibitory receptor IIb on monocytes in ITP. Blood.2016;128(6):852–861. [DOI] [PubMed] [Google Scholar]
- 9.González-López TJ, Pascual C, Álvarez-Román MT, et al. Successful discontinuation of eltrombopag after complete remission in patients with primary immune thrombocytopenia. Am J Hematol.2015;90(3):E40–43. [DOI] [PubMed] [Google Scholar]
- 10.Beck AH, Weng Z, Witten DM, et al. 3′-end sequencing for expression quantification (3SEQ) from archival tumor samples. PLoS One.2010;5(1):e8768. [DOI] [PMC free article] [PubMed] [Google Scholar]
- 11.Guo X, Zhu SX, Brunner AL, van de Rijn M, West RB. Next generation sequencing-based expression profiling identifies signatures from benign stromal proliferations that define stromal components of breast cancer. Breast Cancer Res.2013;15(6):R117. [DOI] [PMC free article] [PubMed] [Google Scholar]
- 12.Rowley JW, Oler AJ, Tolley ND, et al. Genome-wide RNA-seq analysis of human and mouse platelet transcriptomes. Blood.2011;118(14):e101–111. [DOI] [PMC free article] [PubMed] [Google Scholar]
- 13.Angénieux C, Maître B, Eckly A, Lanza F, Gachet C, de la Salle H. Time-dependent decay of mRNA and ribosomal RNA during platelet aging and its correlation with translation activity. PLoS One.2016;11(1):e0148064. [DOI] [PMC free article] [PubMed] [Google Scholar]
- 14.Kuter DJ, Gminski DM, Rosenberg RD. Transforming growth factor beta inhibits megakaryocyte growth and endomitosis. Blood.1992;79(3):619–626. [PubMed] [Google Scholar]
- 15.Sakamaki S, Hirayama Y, Matsunaga T, et al. Transforming growth factor-beta1 (TGF-beta1) induces thrombopoietin from bone marrow stromal cells, which stimulates the expression of TGF-beta receptor on megakaryocytes and, in turn, renders them susceptible to suppression by TGF-beta itself with high specificity. Blood.1999;94(6):1961–1970. [PubMed] [Google Scholar]


