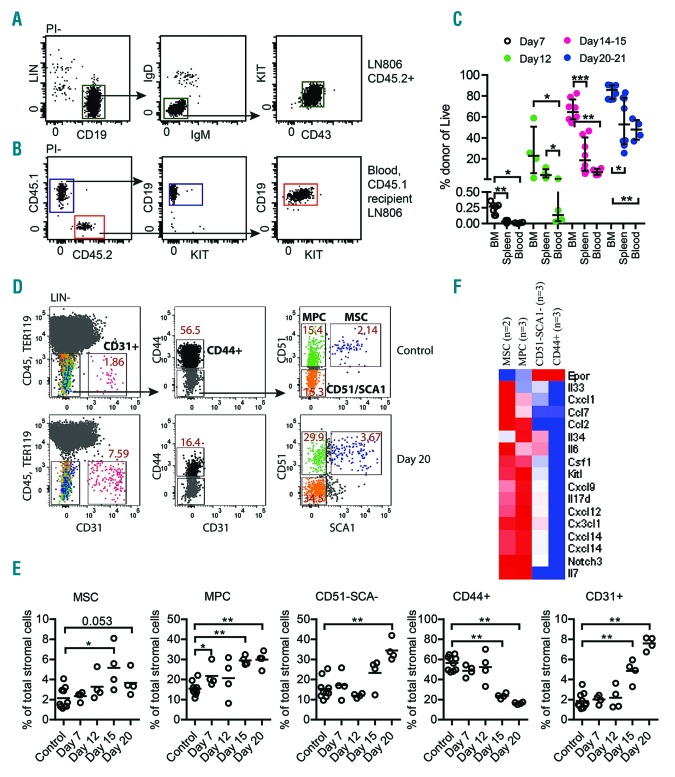
Many of the clinical manifestations of leukemia, including infections, anemia and hemorrhage, reflect a progressive disruption of normal blood cell development.1 The impairment in blood cell production may be a consequence of direct displacement of normal progenitors, however, it is becoming increasingly clear that the development of leukemia impacts the bone marrow (BM) micro-environment, crucial for the regulation of normal hematopoiesis.2–6 To explore the effect of B-lineage acute lymphoblastic leukemia (B-ALL) progression on the BM microenvironment, we transplanted 100.000 primary tumor cells (Figure 1A) from the lymph node (LN) of a leukemic Cd45.2+/+Ebf1+/−Pax5+/− mouse7,8 to wild-type (Wt)Cd45.2 mice mice by tail vein injection. This procedure was performed without pre-conditioning allowing us to investigate the impact of leukemia progression on a steady state BM (Figure 1B). Seven days after transplantation we detected low levels of leukemic cells in the BM while few if any CD45.2+ cells could be detected in the spleen or blood (Figure 1C). Twelve days after transplantation about 20% of the CD45+ cells in the BM and about 10% of the cells in spleen were of tumor origin while the levels in the peripheral blood remained low. Two to three days later, about 60% of the CD45+ cells in the BM represented tumor cells while we observed a lower average leukemia load in the spleen and blood. At 20-21 days after transplantation, the BM contained almost 90% leukemia cells while about 50% of the CD45.2+ cells in the spleen and blood represented tumor cells. Despite the rapid expansion of leukemia cells, the total BM cell number remained constant (Online Supplementary Figure S1A) while the spleen size and cell numbers increased (Online Supplementary Figure S1B). Hence, beyond day 15, the increase in the absolute numbers of tumor cells was largely restricted to the peripheral sites. However, even at this late stage of the disease (20-21 days after transplantation) we detected comparable ratios of cycling tumor cells in the BM, LN and spleen (Online Supplementary Figure S1C-D). Further RNA sequence analysis of sorted tumor cells did not provide any support for the theory that the anatomical location has a major impact on the gene expression patterns in the tumor cells (Online Supplementary Figure S1E).
Figure 1.
Dynamic analysis of leukemic B-cell progenitors shows sequential engraftment to bone marrow and peripheral tissues. (A) Gating strategy for sorting CD19+IgD–IgM–KIT+CD43+ (tumor) pro-B cells from lymph nodes of mouse (here #806) that suffered spontaneous leukemic disease progression. (B) Gating strategy of CD19+ blood cells analyzed in a 12-16 weeks old CD45.1 Wt recipient transplanted with 100.000 LN806 CD45.2 tumor cells. (C) Graph showing the engraftment levels in different tissues at indicated time points after initial intravenous injection of 100.000 LN806 pro-B tumor cells. The presence of leukemia cells in bone marrow, spleen and blood was analyzed in each individual mouse.(n=27 transplanted mice in total). Each dot represents one mouse and the statistical analysis was performed in GraphPad Prism using the Mann Whitney test, P*≤0.05, P**≤0.01, P***≤0.001. (D) Representative flow plot of the gating strategy used to analyze and sort CD45–TER119–CD31–CD44–CD51+SCA1+ mesenchymal stem cells (MSC), CD45–TER119–CD31–CD44–CD51+SCA1– mesenchymal progenitor cells (MPC), CD45–TER119–CD31–CD44–CD51–SCA1− (CD51–SCA–) cells, CD45–TER119–CD31–CD44+ (CD44+) mature stroma cells and CD45-TER119–CD31+ endothelial cells (CD31+). The upper panel shows a control animal and the lower panel shows bone marrow from a mouse 20 days after the intravenous transplant of B-ALL cells from a leukemic mouse 806. The average percentages of each population out of the total Lin–CD45–TER119– population are indicated in the flow plots. (E) Graphs showing the relative change in stroma populations on indicated time points after transplantation. Total of animals at each time point is: controls n=10, day 7 n=4, day 12 n=4, day 15 n=4, day 20 n=4. Each dot represents one mouse and the statistical analysis was performed in GraphPad Prism using the Mann Whitney test, P*≤0.05, P**≤0.01. (F) Heat map visualizing the RNA expression of a set of genes encoding cytokines in MSC, MPC, CD51–SCA1– and CD44+ Wt stroma populations. For each cell type, a mean expression of the samples is shown.
To unravel potential alterations in the non-hematopoietic compartments in the BM during leukemia progression we explored the presence of specific stroma cell populations at defined timepoints after transplantation. While we detected minor changes in the relative presence of phenotypic mesenchymal stem cells (MSC) (Figure 1D, E),9,10 we detected a progressive increase in the fraction of mesenchymal progenitor cells (MPC) and CD51–SCA– cells. In contrast, we noted a significant reduction in the fraction of CD44+ mature stroma cells.11 Furthermore we detected an increased fraction of CD31+ endothelial cells already 15 days after transplantation possibly reflecting changes in the vascular composition and functionality as previously reported for acute myeloid leukemia (AML).12 To better understand the function of the defined stroma cell populations we performed RNA sequencing of normal freshly isolated sorted stroma cells ex vivo (Online Supplementary Table S1). The MSC and MPC expressed higher levels of several cytokines including KitL, Angiopoetin like 1, Spp1, Cxcl12 and Il7 (Figure 1F, Online Supplementary Table S1). Hence, disease progression is associated with increased fractions of CD44– cells expressing higher levels of hematopoietic growth factors,11 likely reflecting a functional adaptation to a more hematopoiesis supporting BM microenvironment.
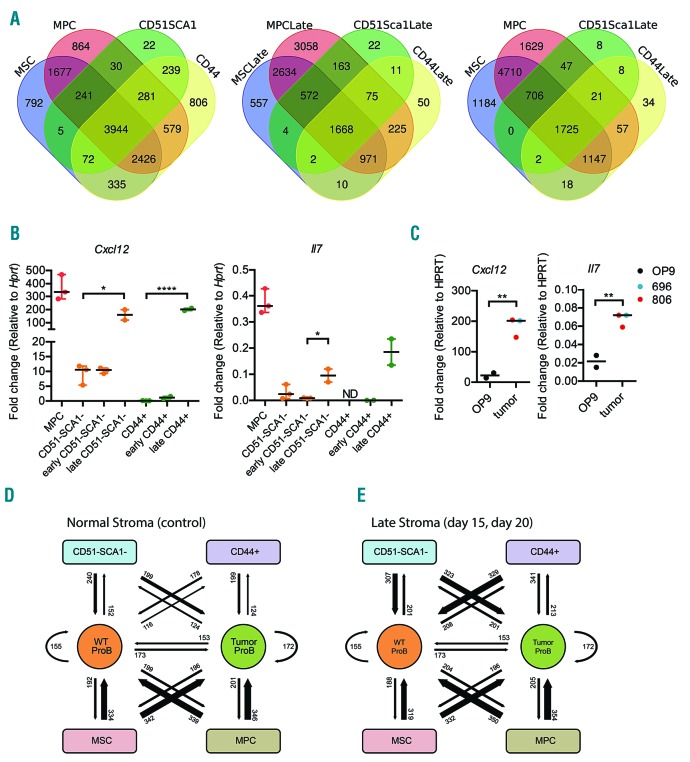
It has been reported that myeloid leukemia causes the non-hematopoietic cells in the BM to change their molecular profile in a manner presumed to generate a more supportive environment for tumor growth.4 In order to analyse if the environmental adaptation in our model for B-ALL involved changes in the molecular features of the different non hematopoietic populations, we performed ex vivo RNA sequencing experiments comparing stromal cells isolated at early (up to 12 days after transplantation) and late (more than 15 days after transplantation) stages of the disease, to the corresponding normal stroma cell populations. This revealed changes in the gene expression patterns of all the populations (Online Supplementary Figure S2A and Online Supplementary Table S1). Analysis of the gene expression patterns in the more immature MSC and MPC compared to CD51–SCA– and CD44+ mature stroma populations (Figure 2A) suggested that 5% (261 out of 4834) of the genes expressed (read MAX ≥ 40) in CD51–SCA– and 12% (1045 out of 8682) of the genes expressed in the CD44+ cells were unique for mature cells. At the late stage of the disease, the fraction of unique genes expressed in mature cells were reduced to 1% and 2% respectively. The higher similarity with the immature cells was also evident when the gene expression patterns were compared with MSC and MPC unexposed to leukemic cells. This suggests that mature stroma cells become more similar to progenitor cells at the late stages of leukemic disease, a conclusion supported by principal component analysis (PCA) (Online Supplementary Figure S2B). The changes in the gene expression pattern included increased levels of mRNA encoding Cxcl12 and Il7 as verified by Q-RT-PCR (Figure 2B). In line with the observation that the tumors obtained from Ebf1+/−Pax5+/− mice are highly homogenous7 (Online Supplementary Figure S1E), two independently generated tumors induced expression of Il7 and Cxcl12 in stroma cells in vitro as determined by Q-PCR (Figure 2C). In contrast to the observations made in the BM, no induction of the Il7 message was found in either hematopoietic or non-hematopoietic cell populations from spleens of leukemic mice (Online Supplementary Figure S2E).
Figure 2.
Phenotypic and molecular alterations of bone marrow stromal cell populations following engraftment of leukemic pro-B cells (A) Venn diagrams displaying differences in gene expression patterns in MSC, MPC as well as CD51−SCA− and CD44+ cells in non-transplanted or leukemic mice in late stage disease (Late). To be classified as expressed in any given cell type the gene was expressed with a read MAX ≥ 40 in at least two replicates. (B) Graphs displaying Q-PCR data from stroma populations sorted from bone marrow. The figure indicates the fold expression of Cxcl12 and Il7 relative to Hprt in each population and one dot represents an independent sample analyzed by Q-PCR in triplicate. ND: non detectable. Statistical analysis was performed in GraphPad Prism using unpaired t-test, P* ≤0.05, P****≤0.0001. (C) Q-PCR data analyzing the expression of Il7 and Cxcl12 mRNA in control OP9 stroma cells or in cells co-cultured for five days with B-ALL cells harvested from two different (696, 806) Ebf1+/−Pax5+/− mice. Statistical analysis was performed in GraphPad Prism using unpaired t-test, P**≤0.01, D-E) The panels display schematic views of the theoretical receptor-ligand interactions (represented by a number and an arrow of the relative thickness) between Wt stroma populations and Wt pro-B cells, or Wt stroma populations and tumor pro-B cells in healthy (D) or leukemic mice (E).
To explore the cellular communication in a holistic manner we developed an in silico approach based on the expression of matching receptor ligand pairs in the stroma- and B- cell populations as determined by RNA sequencing (Figure 2D-E, Online Supplementary Figure S2C, D and Online Supplementary Table S2). Normal MSC and MPC expressed mRNA encoding approximately 340 ligands matching receptors expressed in normal pro-B or B-ALL cells while the ability of CD51–SCA– and CD44+ cells to communicate was more limited. Interestingly, we noted a similar discrepancy in the ability of the stroma cells to recognize ligands secreted by the pro-B cells. The genetic re-programming of stroma cells in advanced stages of disease had a limited impact on the ability of MSC and MPC to communicate with either normal or transformed pro-B cells (Figure 2D-E, Online Supplementary Figure S2C-D and Online Supplementary Table S2). In contrast the putative communication pathways for signaling from CD51–SCA1– cells or CD44+ stroma cells to B-ALL cells increased from 199 to 323 and 341 respectively. Hence, the progression of B-ALL impacts the BM microenvironment both with regard to the cellular composition and molecular features of defined stroma cell populations.
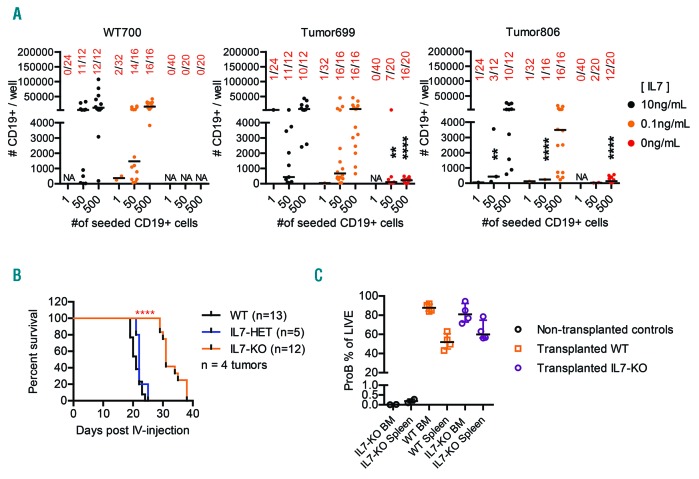
To resolve if the production of pro-B cell growth factors could impact leukemia growth and disease progression, we incubated normal pro-B cells and two independently generated primary B-ALL samples from Ebf1+/−Pax5+/− mice (Online Supplementary Figure S3A) with OP9 stroma cells in the presence or absence of IL7, KITL or FL (Online Supplementary Figure S3B). While both normal and malignant cells expanded about 50-fold under all conditions including IL7, few of the test cultures of normal cells contained any B-cell progenitors 10 days after seeding in absence of IL7 (Figure 3A, Online Supplementary Figure S3B). Even though the expansion of malignant cells was reduced 10-15 fold in the absence of exogenously added IL7, we detected pro-B cells with an upregulated expression of the IL7 receptor (Online Supplementary Figure S3C) in the majority of the cultures established from transformed B-cell progenitors (Figure 3A, Online Supplementary Figure S3B). Despite a background production of cytokines, including IL7, by the stroma cells or the tumors that may impact the growth and survival of the cells, the rather high cloning frequency of the trans-formed cells even in the absence of exogenously added IL7 indicates that this cytokine mainly controls proliferation.
Figure 3.
Interleukin-7 deficiency in BM microenvironment impedes progression of B-ALL progression in vivo. (A) Graphs displaying the result of a 10 day in vitro OP9 stroma co-culture of sorted bone marrow Pro-B (LIN-CD19+IgM–IgDCD43+KIT+) from one Wt (700) and two leukemic (699, 806) mice. The numbers on the x-axis are the number of pro-B cells initially sorted per well, while the numbers on y-axis are the total number of CD19+ cells present in the well at the time of analysis, based on counted events by flow cytometry during a fixed time of sample acquisition. The numbers in red are the number of positive wells/total number of seeded wells. The colors of the data dots indicate the concentration of IL7 during cultivation. (B) Kaplan-Meier curves describing the survival of 12-16 weeks old Wt (black line) and IL7-deficient (orange line) mice after intravenous injection with 100,000 sorted pro-B cells from lymph nodes of leukemic Pax5+/−Ebf1+/− mice. A drop in the curve represents euthanasia due to clinical manifestation of leukemia (palpable accessory axillary or subiliac lymph nodes). The overall log-rank (Mantel-Cox test) P value was calculated in GraphPad Prism, P****≤0.0001. The data is the result of a total of three separate experiments, using four different tumors (292, 1103, 697, 686). Each tumor was transplanted to both Wt and IL7-deficient recipients in the same experiment, Wt n=13, IL7−/− n=12. C). Graph showing the percentrage of Pro-B cells of total live cells in the bone marrow and spleen, of Wt and IL7−/− mice at the time of euthanasia.
To explore the role of IL7 in tumor progression we transplanted four independently generated primary B-ALL from Ebf1+/−Pax5+/− mice to Il7−/− and Wt control mice (Figure 3B). The majority of the transplanted Wt mice had developed clear symptoms of leukemia (palpable axillary- or subiliac- LN) within 24 days after transplantation while the transplanted Il7−/− mice did not show the same signs of disease until 29 to 38 days after transplantation. At the time of developed disease, the tumor burden was similar [not significant (NS) in the Mann Whitney test] in the BM and spleen from Wt and Il7−/− mice (Figure 3C). The absence of IL7 did not result in any phenotypic changes of the tumor cells arguing against the dependence of the observed differentiation block on IL7 signaling (Online Supplementary Figure S4).
This suggested a functional role for IL7 in the progression of B-ALL and supports the idea that the increased production of B-cell growth factors may represent a relevant adaption to stimulate B-ALL growth in vivo. We also detected signs of an inflammatory process in BM, including upregulation of Il6 expression is in the mature stroma cell populations (Online Supplementary Table S1). Interestingly, the tumor cells express high levels of Lta message (Online Supplementary Table S2) that may support an inflammatory process in the micro environment.
Even though it is difficult to estimate the relevance of a defined animal model for a human disease, subclinical stages of leukemia are currently not easily detectable in humans. Our model is based on the partial deletion of two transcription factors that are frequently involved in the formation of leukemia in humans13–15 and the transplantation of cells to animals with a normal functional hematopoietic system. We therefore believe that even though the role of individual cytokines and growth factors may vary dependent on the mutational landscape of the tumor, the general principle of environmental adaptation is likely to be relevant also for the human disease. Hence, these data increase our understanding of the molecular and cellular mechanisms associated with B-ALL progression and provide information that may be further explored to target human leukemia.
Acknowledgements
We thank Liselotte Lenner and Linda Bergström for expert technical assistance.
Footnotes
Funding: this work was supported by grants from the Swedish Cancer Society, the Swedish Childhood Cancer Foundation, the Swedish Research Council, including a strategic grant to the Stem Therapy program at Lund University, Knut and Alice Wallenberg’s Foundation, A donation from Henry Hallberg and Lund as well as Linköping Universities.
Information on authorship, contributions, and financial & other disclosures was provided by the authors and is available with the online version of this article at www.haematologica.org.
References
- 1.Hunger SP, Mullighan CG. Acute Lymphoblastic leukemia in children. N Engl J Med.2015;373(16):1541–1552. [DOI] [PubMed] [Google Scholar]
- 2.Hoggatt J, Kfoury Y, Scadden DT. Hematopoietic stem cell niche in health and disease. Annu Rev Pathol.2016;11:555–581. [DOI] [PubMed] [Google Scholar]
- 3.Boulais PE, Frenette PS. Making sense of hematopoietic stem cell niches. Blood.2015;125(17):2621–2629. [DOI] [PMC free article] [PubMed] [Google Scholar]
- 4.Schepers K, Pietras EM, Reynaud D, et al. Myeloproliferative neoplasia remodels the endosteal bone marrow niche into a self-reinforcing leukemic niche. Cell Stem Cell.2013;13(3):285–299. [DOI] [PMC free article] [PubMed] [Google Scholar]
- 5.Cheung LC, Tickner J, Hughes AM, et al. New therapeutic opportunities from dissecting the pre-B leukemia bone marrow microenvironment. Leukemia.2018;32(11):2326–2338. [DOI] [PMC free article] [PubMed] [Google Scholar]
- 6.Colmone A, Amorim M, Pontier AL, Wang S, Jablonski E, Sipkins DA. Leukemic cells create bone marrow niches that disrupt the behavior of normal hematopoietic progenitor cells. Science.2008;322(5909):1861–1865. [DOI] [PubMed] [Google Scholar]
- 7.Prasad MA, Ungerback J, Ahsberg J, et al. Ebf1 heterozygosity results in increased DNA damage in pro-B cells and their synergistic transformation by Pax5 haploinsufficiency. Blood.2015;125(26):4052–4059. [DOI] [PMC free article] [PubMed] [Google Scholar]
- 8.Somasundaram R, Ahsberg J, Okuyama K, et al. Clonal conversion of B lymphoid leukemia reveals cross-lineage transfer of malignant states. Genes Dev.2016;30(22):2486–2499. [DOI] [PMC free article] [PubMed] [Google Scholar]
- 9.Xiao P, Dolinska M, Sandhow L, et al. Sipa1 deficiency-induced bone marrow niche alterations lead to the initiation of myeloproliferative neoplasm. Blood Adv.2018;2(5):534–548. [DOI] [PMC free article] [PubMed] [Google Scholar]
- 10.Xiao P, Sandhow L, Heshmati Y, et al. Distinct roles of mesenchymal stem and progenitor cells during the development of acute myeloid leukemia in mice. Blood Adv.2018;2(12):1480–1494. [DOI] [PMC free article] [PubMed] [Google Scholar]
- 11.Qian H, Le Blanc K, Sigvardsson M. Primary mesenchymal stem and progenitor cells from bone marrow lack expression of CD44 protein. J Biol Chem.2012;287(31):25795–25807. [DOI] [PMC free article] [PubMed] [Google Scholar]
- 12.Passaro D, Di Tullio A, Abarrategi A, et al. Increased vascular permeability in the bone marrow microenvironment contributes to disease progression and drug response in acute myeloid leukemia. Cancer Cell.2017;32(3):324–341.e6. [DOI] [PMC free article] [PubMed] [Google Scholar]
- 13.Mullighan CG, Goorha S, Radtke I, et al. Genome-wide analysis of genetic alterations in acute lymphoblastic leukaemia. Nature.2007;446(7137):758–764. [DOI] [PubMed] [Google Scholar]
- 14.Kuiper RP, Schoenmakers EF, van Reijmersdal SV, et al. High-resolution genomic profiling of childhood ALL reveals novel recurrent genetic lesions affecting pathways involved in lymphocyte differentiation and cell cycle progression. Leukemia.2007;21(6):1258–1266. [DOI] [PubMed] [Google Scholar]
- 15.Somasundaram R, Prasad MA, Ungerback J, Sigvardsson M. Transcription factor networks in B-cell differentiation link development to acute lymphoid leukemia. Blood.2015;126(2):144–152. [DOI] [PMC free article] [PubMed] [Google Scholar]


