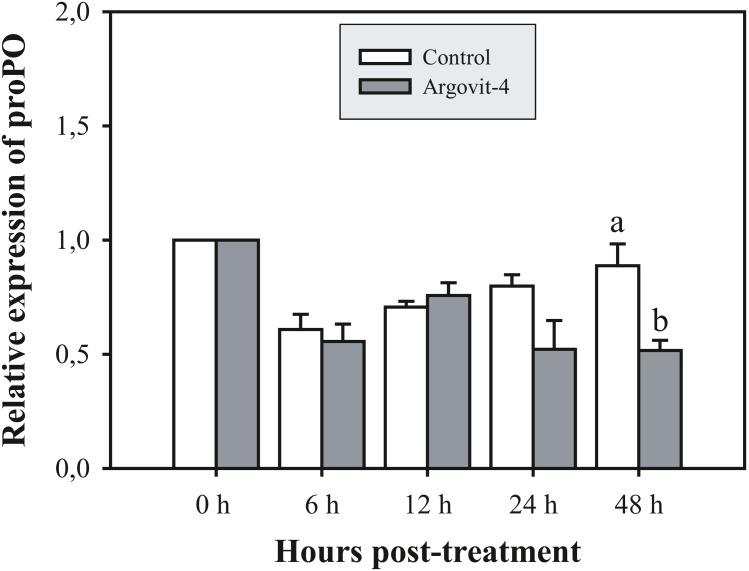
Figure 6. Relative expression of proPO gene.
The graphic show the RT-qPCR of the relative expression of proPO gene with no significant differences between AgNP treatment (black box) and control (white box) only at 48 hrs. The data of the statistical analysis are represented in mean ± standard error (Analysis test in text).

