Abstract
UHMK1 is a nuclear serine/threonine kinase recently implicated in carcinogenesis. However, the functions and action mechanisms of UHMK1 in the pathogenesis of human gastric cancer (GC) are unclear. Here, we observed that UHMK1 was markedly upregulated in GC. UHMK1 silencing strongly inhibited GC aggressiveness. Interestingly, UHMK1‐induced GC progression was mediated primarily via enhancing de novo purine synthesis because inhibiting purine synthesis reversed the effects of UHMK1 overexpression. Mechanistically, UHMK1 activated ATF4, an important transcription factor in nucleotide synthesis, by phosphorylating NCOA3 at Ser (S) 1062 and Thr (T) 1067. This event significantly enhanced the binding of NCOA3 to ATF4 and the expression of purine metabolism‐associated target genes. Conversely, deficient phosphorylation of NCOA3 at S1062/T1067 significantly abrogated the function of UHMK1 in GC development. Clinically, Helicobacter pylori and GC‐associated UHMK1 mutation induced NCOA3‐S1062/T1067 phosphorylation and enhanced the activity of ATF4 and UHMK1. Importantly, the level of UHMK1 was significantly correlated with the level of phospho‐NCOA3 (S1062/T1067) in human GC specimens. Collectively, these results show that the UHMK1‐activated de novo purine synthesis pathway significantly promotes GC development.
Keywords: ATF4, gastric cancer, NCOA3, purine metabolism, UHMK1
Subject Categories: Cancer, Metabolism
Nuclear serine/threonine kinase UHMK1 mutations enhance gastric cancer by activating de novo purine synthesis.

Introduction
Gastric cancer (GC) has been indicated to be one of the deadliest malignancies. Helicobacter pylori (H. pylori) infection, dietary habits, and other environmental risk agents contribute greatly to GC development (Wroblewski et al, 2010). Although surgical resection is a primary therapeutic option for GC patients, the 5‐year survival rate remains approximately 30.6% but is only 5.2% for patients with advanced stages (Yusefi et al, 2018). Therefore, a better understanding of molecular aberrations involved in GC pathogenesis is necessary to improve the clinical outcomes of GC patients.
U2AF homology motif kinase 1 (UHMK1) is a ubiquitously expressed nuclear serine (Ser, S)/threonine (Thr, T) kinase (Francone et al, 2010). It was initially identified to regulate the function of stathmin (Barbutti et al, 2017). Since then, UHMK1 has been indicated to bind a range of proteins, such as eEF1A, FAM64, cyclin‐dependent kinase inhibitor (CDKI), p27KIP1, SF3b155, and CPEB1, suggesting the varied roles of UHMK1 in different cellular processes (Manceau et al, 2008; Cambray et al, 2009). Although UHMK1 dysregulation or mutation has been recently indicated to be a high‐penetrant factor in different types of human tumors, such as pancreatic and ovarian cancer (Katchman et al, 2017; Grant et al, 2018; Wang et al, 2018), its effect and action mechanisms in most cancers including GC still were uncovered.
Tumor cells reprogram glucose metabolism by switching from oxidative phosphorylation (OXPHOS) to a process termed the Warburg effect (Song et al, 2014). However, emerging evidence indicates that dysregulated purine metabolism is implicated in tumors (Nishimura et al, 2019). This finding is not surprising, because many metabolites from the Warburg effect or pentose phosphate pathway (PPP) are essential carbon sources for purine biosynthesis (Hong et al, 2014). Several kinases and transcription factors (TFs), for example, mechanistic target of rapamycin kinase (mTOR), activating transcription factor 4 (ATF4), microphthalmia‐associated transcription factor (MITF), and c‐Myc, dictate cancer‐dependent purine biosynthesis (Ben‐Sahra et al, 2016; Karigane et al, 2016). We recently reported that dual‐specificity tyrosine‐(Y)‐phosphorylation‐regulated kinase 3 (Dyrk3) inhibited liver cancer by downregulating purine synthesis (Ma et al, 2019). However, the effect of purine metabolism on GC is not clear.
Herein, by analyzing data from The Cancer Genome Atlas (TCGA) and Oncomine database, we found that genomic DNA of UHMK1 was frequently amplified in GC. Therefore, we further investigated the role and mechanism of UHMK1 in GC. We found that upregulation of UHMK1 suggested poor prognosis of GC patients. We demonstrated that UHMK1 functioned as an oncogene mainly by promoting the purine synthesis pathway in GC. Therefore, UHMK1‐enhanced nucleotide synthesis might be an important therapeutic target in GC.
Results
High‐level UHMK1 expression is strongly correlated with GC aggressiveness
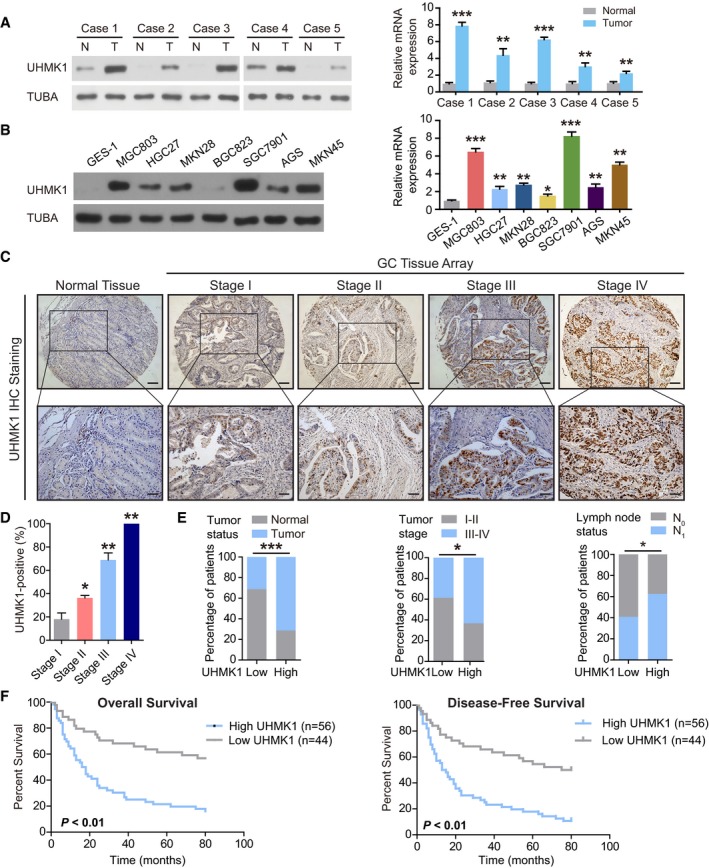
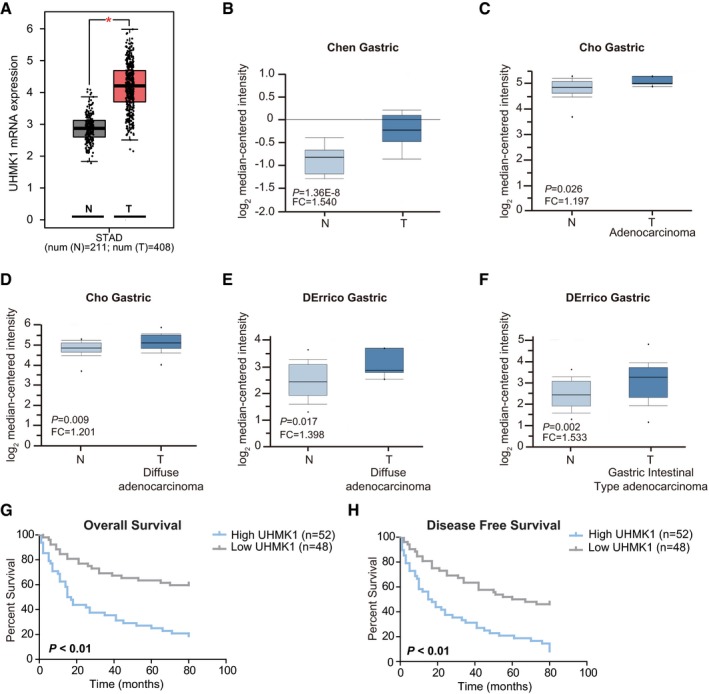
We first examined the functions of UHMK1 in GC by investigating the relative levels of UHMK1 in five paired GC patient tissues and corresponding normal tissues. The amount of UHMK1 was significantly increased in GC tissues compared with control tissues (Fig 1A). In addition, the amount of UHMK1 in most GC cell lines was often higher than that in the GES‐1 cell line, a normal gastric epithelial cell line (Fig 1B). Similar results were found in other studies of GC in TCGA and Oncomine datasets (Fig EV1A–F). The tissue array analysis results indicated that compared to normal tissues, GC tissues presented increased expression levels of UHMK1 (Fig 1C) and that the percentage of cells with UHMK1 expression in patients with stage I, II, III, and IV GC was 18.2, 36.4, 69, and 100, respectively (Fig 1D), further implying that the level of UHMK1 is strongly correlated with GC malignancy. Analysis of 100 patients with GC confirmed that the level of UHMK1 was strongly associated with tumor status, stage, and lymph node metastasis (Fig 1E and Appendix Table S1). Kaplan–Meier analysis of two independent cohorts indicated that GC patients with higher amounts of UHMK1 presented shorter disease‐free survival (DFS) and overall survival (OS) times (Figs 1F and EV1G and H). Multivariate analyses identified UHMK1 as an independent prognostic factor in GC (Appendix Table S2). Collectively, our data reveal that UHMK1 may promote the pathogenesis of GC.
Figure 1. High expression of UHMK1 predicts poor prognosis of GC patients.
-
AUHMK1 levels in tumor tissues (T) and corresponding nontumor tissues (N) from five GC patients were analyzed using Western blotting and qRT–PCR. The relative mRNA expression of UHMK1 was presented as mean ± standard deviation from three replicates. Pairwise two‐tailed statistical significance was assessed by Student's t‐test.
-
BImmunoblotting and qRT–PCR were used to measure the levels of UHMK1 in GES‐1 and GC cell lines. The relative mRNA expression of UHMK1 was presented as mean ± standard deviation from three replicates. Pairwise two‐tailed statistical significance was assessed by Student's t‐test.
-
CIHC analysis of UHMK1 expression in a GC patient tissue array (n = 102). Representative images are shown. Scale bars = 100 μm.
-
DThe IHC signals were scored using the Allred score as described in Material and Methods. Data were shown as mean ± standard deviation from three independent experiments.
-
EUHMK1 expression in 100 GC patients was analyzed based on the following parameters: tumor stage, tumor status, and lymph node invasion status. Fisher's test was applied to calculate the exact P value.
-
FPatients with GC were stratified by the UHMK1 level (n = 100); OS and DFS were assessed by Kaplan–Meier analysis.
Figure EV1. TCGA and Oncomine analysis of UHMK1 expression in GC patients.
-
ATCGA analyzing the levels of UHMK1 in GC patients. *P < 0.05. The central line stands for the median expression of UHMK1. Upper line stands for upper limit (Upper quartile +1.5 interquartile range). Lower line stands for lower limit (lower quartile –1.5 interquartile range).
-
B–FAnalysis of UHMK1 expression from Oncomine database. The central line stands for the median expression of UHMK1. Upper line stands for upper limit (Upper quartile +1.5 interquartile range). Lower line stands for lower limit (lower quartile –1.5 interquartile range) (three biological replicates).
-
G, HKaplan–Meier analysis from the second independent cohort of GC patients indicated that patients with higher levels of UHMK1 had shorter OS (G) and DFS (H). Survival curves were plotted according to Kaplan–Meier method, with the log‐rank test applied for comparison.
UHMK1 knockdown strongly inhibits the proliferation and invasion of GC cells, possibly via metabolic pathway reprogramming
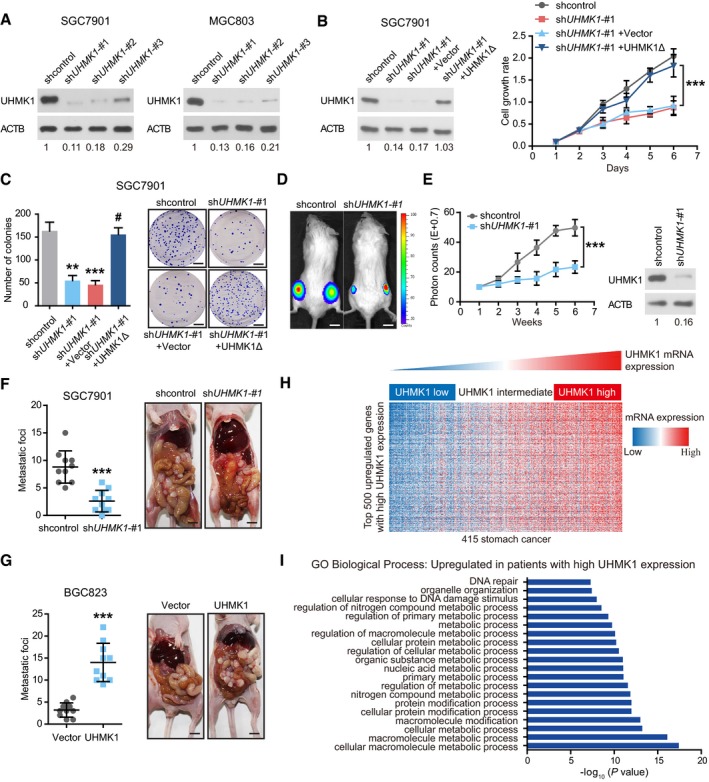
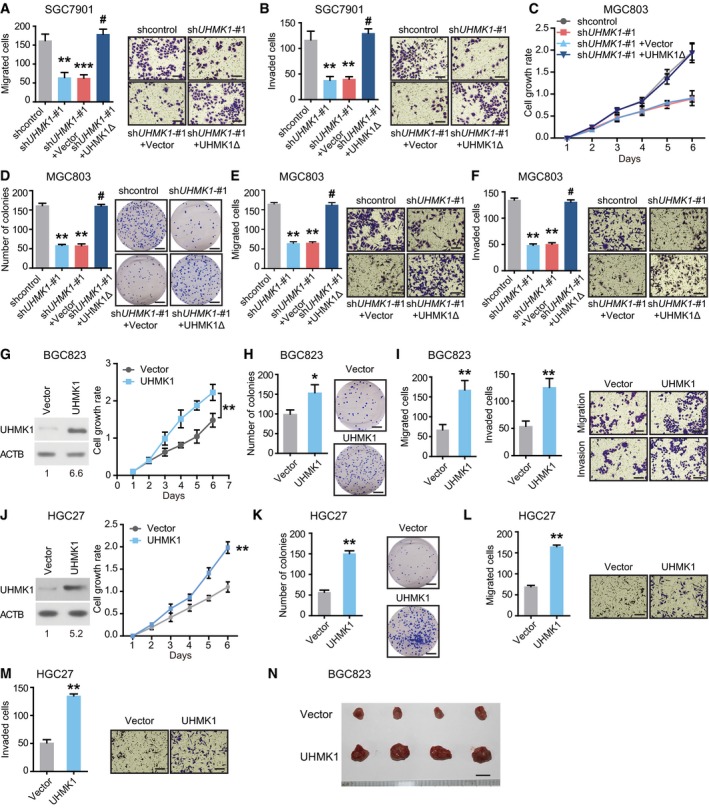
To elucidate the functions of UHMK1 in GC, three lentivirus‐mediated UHMK1‐specific short hairpin RNAs (shRNAs) were transfected to knock down endogenous UHMK1 in two GC cell lines. shUHMK1‐#1 and shUHMK1‐#2, with high inhibition rates, were selected for further experiments (Fig 2A). UHMK1 deficiency significantly reduced GC cell proliferation, colony formation, migration, and invasion relative to the corresponding levels in negative control cells (Figs 2B and C, and EV2A–F). However, reintroduction of a shRNA‐resistant UHMK1 construct, UHMK1Δ, significantly reversed these phenotypes in SGC7901‐shUHMK1‐#1 or MGC803‐shUHMK1‐#1 cells (Figs 2B and C, and EV2A–F). Consistent with this result, UHMK1 overexpression in BGC823 and HGC27 cells markedly promoted their proliferative and invasive abilities (Fig EV2G–M).
Figure 2. UHMK1 knockdown strongly suppresses the proliferative and invasive abilities of GC cells, possibly via metabolic pathway reprogramming.
-
A–C(A) GC cells (SGC7901 and MGC803) were transfected with (A) shUHMK1‐#1, shUHMK1‐#2, shUHMK1‐#3, or control shRNA lentiviral vector or (B) with a shRNA‐resistant expression construct, UHMK1Δ. Western blotting was used to measure the levels of UHMK1. NIH ImageJ software was used to quantify the band intensity. Western blotting assay was conducted for three replicates. (B and C) SGC7901 cells were transfected with or without shUHMK1‐#1 or the shRNA‐resistant expression construct UHMK1Δ. CCK‐8 and colony formation assays were conducted. Scale bars = 5 mm.
-
D, EThe volumes of subcutaneous gastric tumors derived from SGC7901 cells in NOD/SCID mice were determined at different time points. Tumors and representative bioluminescence images are also shown. UHMK1 silencing in the mouse model was confirmed by Western blotting (three biological replicates). Data were presented as mean ± standard deviation from shcontrol and shUHMK1‐#1 mice (n = 10 mice/group). Unpaired two‐tailed statistical significance was assessed by Student's t‐test. Scale bars = 1 cm.
-
F, GUHMK1 silencing (F) and overexpression (G) affected GC cell abdominal metastasis. The quantitative number of metastatic nodules (left panel) in nude mice (n = 10 mice/group). Representative images of abdominal metastases are also shown (right panel). Scale bars = 1 cm.
-
HHeatmap of the top 500 genes upregulated in GC patients with high UHMK1 expression.
-
IGene ontology enrichment analysis was used to analyze the top 20 enriched biological processes among GC patients with high UHMK1 expression.
Figure EV2. UHMK1 knockdown strongly suppresses GC cell proliferation and invasion.
-
A, BSGC7901 cells were infected with or without shUHMK1‐#1, or a shRNA‐resistant expression construct, UHMK1Δ. We performed Transwell assays to measure GC cell migration and invasion, respectively. (Left panel) The quantitative number of migrated or invaded cells in shcontrol, shUHMK1‐#1, shUHMK1‐#1+Vector, and shUHMK1‐#1+UHMK1Δ group. Data were presented as mean ± standard deviation from three replicates. Two‐tailed statistical significance was assessed by Student's t‐test. (Right panel) Representative images of migrated or invaded cells in each group are shown. Scale bars = 100 μm.
-
CMGC803 cells were transfected with or without shUHMK1‐#1, or UHMK1Δ. CCK‐8 assay was conducted to explore the biological function of UHMK1 on cell growth. The growth rate was evaluated from Day 1 to Day 6. Data were presented as mean ± standard deviation from three replicates. Two‐tailed statistical significance was assessed by Student's t‐test.
-
D–FMGC803 cells were transfected with or without shUHMK1‐#1 or UHMK1Δ. Colony formation and Transwell assays were used to measure GC cell proliferation, invasion, and migration, respectively. (Left panel) The quantitative number of colonies, migrated or invaded cells in shcontrol, shUHMK1‐#1, shUHMK1‐#1+Vector, and shUHMK1‐#1+UHMK1Δ group. Data were presented as mean ± standard deviation from three replicates. (Right panel) Representative images of colonies, migrated or invaded cells in each group are shown. Scale bars = 100 μm.
-
GWestern blotting was performed to analyze UHMK1 expression in BGC823 cells transfected with or without UHMK1. CCK‐8 assay was conducted to explore the biological function of UHMK1 on cell growth. The growth rate was evaluated from Day 1 to Day 6. Data were presented as mean ± standard deviation from three replicates. Two‐tailed statistical significance was assessed by Student's t‐test.
-
H, IBGC823 cells were transfected with or without UHMK1. Colony formation and Transwell assays were used to measure GC cell proliferation, invasion, and migration, respectively. (Left panel) The quantitative number of colonies, migrated or invaded cells in Vector and UHMK1 group. Data were presented as mean ± standard deviation from three replicates. (Right panel) Representative images of colonies, migrated or invaded cells in each group are shown. Scale bars = 100 μm.
-
JWestern blotting was performed to analyze UHMK1 expression in HGC27 cells transfected with or without UHMK1. CCK‐8 assay was conducted to explore the biological function of UHMK1 on cell growth. The growth rate was evaluated from Day 1 to Day 6. Data were presented as mean ± standard deviation from three replicates. Two‐tailed statistical significance was assessed by Student's t‐test.
-
K–MHGC27 cells were transfected with or without UHMK1. Colony formation and Transwell assays were used to measure GC cell proliferation, invasion, and migration, respectively. (Left panel) The quantitative number of colonies, migrated or invaded cells in Vector and UHMK1 group. Data were presented as mean ± standard deviation from three replicates. (Right panel) Representative images of colonies, migrated or invaded cells in each group are shown. Scale bars = 100 μm.
-
NNOD/SCID mice (n = 10 per group) were injected subcutaneously with 1.5 × 10⁶ BGC823‐vector and BGC823‐UHMK1 into opposite flanks. At indicated time points, the xenograft tumors were collected and presented. Scale bars = 5 mm.
In vivo, knockdown of UHMK1 significantly decreased GC tumorigenesis and the number of abdominal metastatic nodules compared to these parameters in control mice (Fig 2D–F). However, UHMK1 overexpression significantly promoted GC growth and increased the number of metastatic nodules (Figs EV2N and 2G).
To further uncover the function of UHMK1 in GC, we assessed the transcriptomes of GC patients in TCGA with varying levels of UHMK1 expression. And the top 500 differentially expressed genes were analyzed in UHMK1high versus UHMK1low patients (Fig 2H and Appendix Table S3). Gene ontology enrichment analysis indicated that high UHMK1 expression in GC patients might be associated mainly with tumor metabolism (Fig 2I). In summary, UHMK1 upregulation significantly promotes GC growth and metastasis possibly via metabolic pathway reprogramming in tumors.
UHMK1 upregulation promotes the invasion and proliferation of GC cells by promoting the de novo purine synthesis pathway
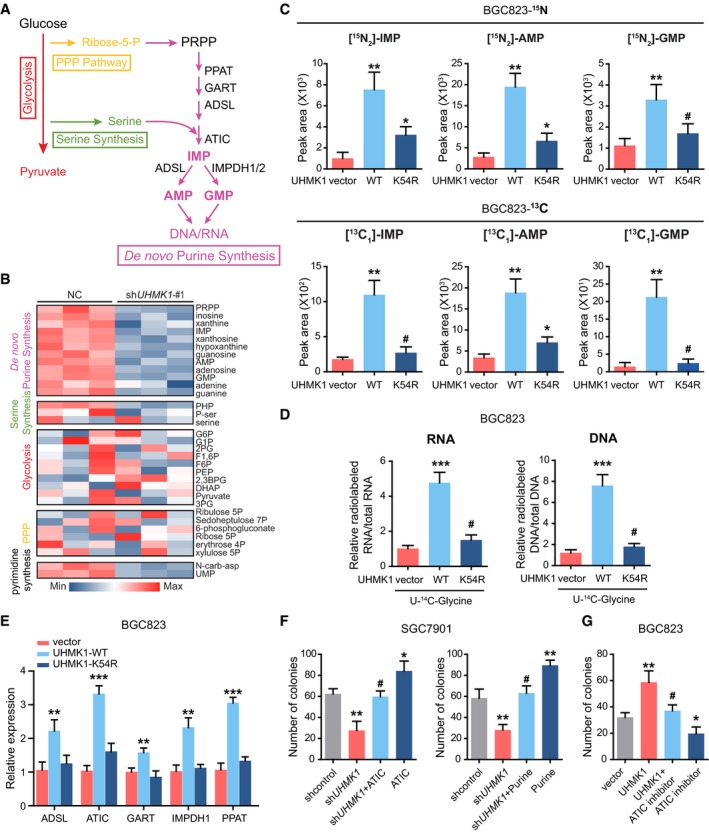
To examine whether UHMK1 reprograms GC‐associated metabolic pathways, mass spectrometry (MS) was performed to assemble the collect metabolic profiles of SGC7901 cells with or without UHMK1 knockdown. Interestingly, UHMK1 silencing significantly reduced the intracellular pools of purine intermediates and a moderate decrease in pyrimidine metabolites (Appendix Table S4 and Fig 3A and B). Thus, silencing UHMK1 in GC cells primarily inhibits purine biosynthesis.
Figure 3. UHMK1 upregulation significantly increases the proliferative and invasive abilities of GC cells by reprogramming purine metabolism.
-
ASchematic representation of the main metabolic pathways.
-
BLC‐MS/MS was used to examine the metabolites in SGC7901 cells with or without UHMK1 knockdown. The data are shown in the heatmap.
-
C(Upper panel) LC‐MS/MS analysis was performed to measure 15N‐glutamine‐labeled purine synthesis intermediates in BGC823 cells transfected with or without the WT‐UHMK1 or UHMK1‐K54R constructs. (Lower panel) LC‐MS/MS was used to analyze metabolites labeled with 13C‐glycine in BGC823 cells transfected with or without the WT‐UHMK1 or UHMK1‐K54R constructs (three biological replicates).
-
DRNA and DNA with incorporated 14C‐glycine in BGC823 cells transfected with or without the WT‐UHMK1 or UHMK1‐K54R constructs were examined using LC‐MS/MS (three biological replicates).
-
EqRT–PCR assays were used to analyze the effects of WT‐UHMK1 or UHMK1‐K54R on the genes controlling purine metabolism. Data were presented as mean ± standard deviation from three replicates. Unpaired two‐tailed statistical significance was assessed by Student's t‐test.
-
FUHMK1 silencing significantly decreased SGC7901 cell proliferation, while ATIC overexpression or purine supplementation markedly reversed this inhibition. Data were presented as mean ± standard deviation from three replicates. Unpaired two‐tailed statistical significance was assessed by Student's t‐test.
-
GTreatment with the ATIC inhibitor significantly reversed the proliferation of BGC823 cells induced by UHMK1 overexpression. Data were presented as mean ± standard deviation from three replicates. Unpaired two‐tailed statistical significance was assessed by Student's t‐test.
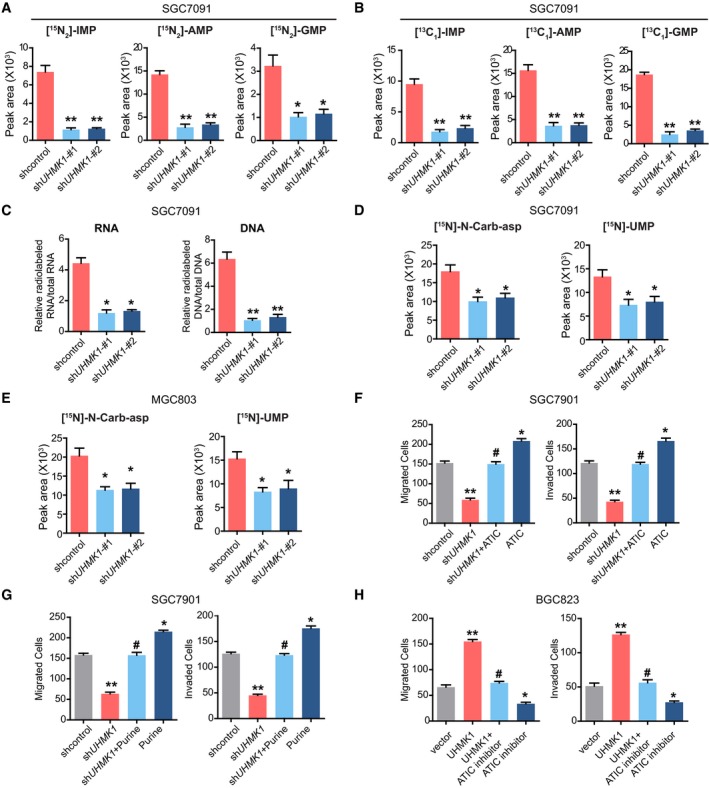
We then used stable isotope‐labeled glutamine (amide‐15N) to investigate the effect of UHMK1 on purine metabolism (Dayie & Thakur, 2010). Overexpression of wild‐type (WT) UHMK1 but not the kinase‐dead UHMK1‐K54R mutant in BGC823 cells obviously increased the amounts of 15N‐purine intermediates (IMP, AMP, and GMP) (Fig 3C upper panel), suggesting that the kinase activity of UHMK1 was required for this effect of UHMK1. Additionally, silencing UHMK1 in SGC7901 cells produced the opposite effect (Fig EV3A). Second, similar findings were observed when the flux of 13C‐glycine into purine intermediates was analyzed (Fig 3C lower panel and Fig EV3B). Third, overexpression of WT‐UHMK1 but not the UHMK1‐K54R mutant significantly enhanced the levels of 14C‐glycine‐labeled RNA and DNA in BGC823 cell line (Fig 3D), while knockdown of UHMK1 had the opposite effect (Fig EV3C). Fourth, overexpression of WT‐UHMK1 but not the UHMK1‐K54R mutant significantly upregulated the critical enzymes essential for activating the de novo purine synthesis pathway (Fig 3E). We also measured 15N‐carbamoyl‐L‐aspartate following 15N‐glutamine labeling to quantify the effects of UHMK1 on pyrimidine synthesis (Fig EV3D and E). Interestingly, we observed modest but significant decreases in pyrimidine synthesis. The changes were less dramatic than for purine synthesis. Together, these data strongly demonstrate that UHMK1 mainly activates purine synthesis in GC.
Figure EV3. Silencing UHMK1 in GC cells primarily inhibits the de novo purine synthesis pathway.
-
ALC‐MS/MS analysis was performed to measure 15N‐glutamine‐labeled intermediates of purine synthesis in SGC7901 cells with or without shUHMK1‐#1 and shUHMK1‐#2 constructs (three biological replicates).
-
BLC‐MS/MS was used to analyze metabolites labeled with 13C‐glycine in SGC7901 cells with or without shUHMK1‐#1 and shUHMK1‐#2 constructs (three biological replicates).
-
CLC‐MS/MS was used to measure the levels of RNA and DNA with 14C‐glycine in SGC7901 cells with or without shUHMK1‐#1 and shUHMK1‐#2 constructs (three biological replicates).
-
DLC‐MS/MS analysis was performed to measure 15N‐glutamine‐labeled intermediates of pyrimidine synthesis in SGC7901 cells with or without shUHMK1‐#1 and shUHMK1‐#2 constructs (three biological replicates).
-
ELC‐MS/MS analysis was performed to measure 15N‐glutamine‐labeled intermediates of pyrimidine synthesis in MGC803 cells with or without shUHMK1‐#1 and shUHMK1‐#2 constructs (three biological replicates).
-
F, G(F) The effect of ATIC overexpression or purine addition (G) on SGC7901 cells with UHMK1 knockdown (three biological replicates).
-
HATIC inhibitor significantly reverted the migration and invasion of BGC823 cells induced by UHMK1 overexpression (three biological replicates).
Next, we investigated the physiological significance of de novo purine synthesis in UHMK1‐mediated GC progression. As shown in Figs 3F and EV3F and G, although UHMK1 silencing strongly inhibited the proliferative and invasive abilities of SGC7901 cells, supplementation of purine or overexpression of ATIC (a critical enzyme in the purine synthesis pathway) significantly rescued these defects in GC cells. Conversely, treatment with an ATIC inhibitor significantly reversed the proliferation, migration, and invasion of BGC823 cells induced by UHMK1 overexpression (Figs 3G and EV3H).
Taken together, our data indicate that UHMK1 promotes GC development at least partially by reprogramming de novo purine metabolism.
ATF4 activation mediates UHMK1‐enhanced purine biosynthesis and GC progression
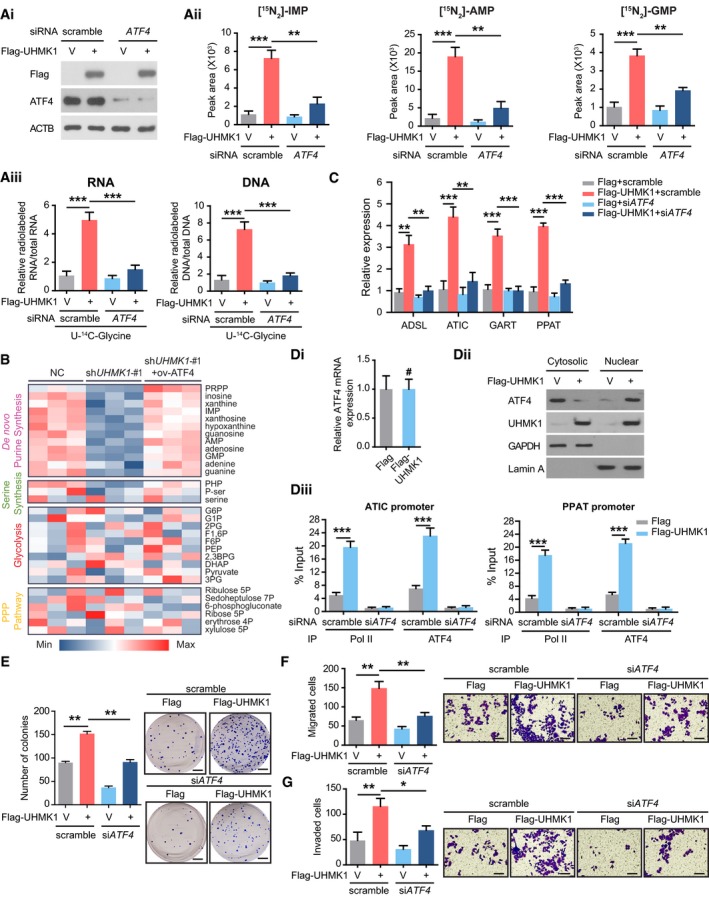
Given that c‐Myc, MITF, and ATF4 dictate the de novo purine synthesis pathway (Ben‐Sahra et al, 2016; Karigane et al, 2016), we hypothesized that they might also mediate the effects of UHMK1 on GC. Interestingly, we first confirmed the expression of ATF4 and UHMK1 in BGC823 cells and further found that knockdown of ATF4 but not MITF or c‐Myc significantly reversed the UHMK1‐driven increase in the purine metabolic intermediates in BGC823 cells (Fig 4Ai–Aiii and Appendix Fig S1). Conversely, reintroduction of ATF4 reversed the shUHMK1‐mediated effects on purine metabolism (Fig 4B). In addition, knockdown of ATF4 significantly suppressed the upregulation in the expression levels of rate‐limiting genes in the de novo purine synthesis pathway in BGC823 cells overexpressing UHMK1 (Fig 4C). Although UHMK1 overexpression did not change the protein or mRNA levels of ATF4 (Fig 4Di and Dii), it not only enhanced ATF4 nuclear translocation but also recruited greater amounts of Pol II and ATF4 to the promoters of ATIC and PPAT (Fig 4Dii and Diii), suggesting that UHMK1 overexpression promotes purine synthesis by enhancing the transcriptional activity of ATF4.
Figure 4. ATF4 activation mediates UHMK1‐enhanced purine biosynthesis and GC progression.
-
A(Ai) Western blot analysis was used to confirm UHMK1 overexpression and ATF4 knockdown in BGC823 cells. (Aii) Silencing ATF4 significantly decreased the levels of the indicated metabolites in BGC823 cells overexpressing UHMK1 (three biological replicates). (Aiii) Silencing ATF4 significantly decreased the levels of RNA and DNA containing U‐14C‐glycine in BGC823 cells overexpressing UHMK1 (three biological replicates)
-
BLC‐MS/MS was used to examine the metabolites in SGC7901 cells with or without UHMK1 knockdown or ATF4 reintroduction. The data are shown in the heatmap.
-
CSilencing ATF4 significantly decreased the levels of the indicated genes in BGC823 cells overexpressing UHMK1. Data were presented as mean ± standard deviation from three replicates. Unpaired two‐tailed statistical significance was assessed by Student's t‐test.
-
D(Di) qRT–PCR was used to measure the expression of ATF4 in BGC823 cells overexpressing UHMK1. (Dii) UHMK1 overexpression enhanced the nuclear translocation of ATF4 in BGC823 cells. (Diii) ChIP assays on the ATIC and PPAT promoters were performed in BGC823 cells with the indicated antibody. Data were presented as mean ± standard deviation from three replicates. Unpaired two‐tailed statistical significance was assessed by Student's t‐test.
-
ESilencing ATF4 markedly decreased the proliferation of BGC823 cells overexpressing UHMK1. (Left panel) The quantitative number of colonies formed in scramble+Flag, scramble+Flag‐UHMK1, siATF4+Flag, and siATF4+Flag‐UHMK1 group. Data were presented as mean ± standard deviation from three replicates. Unpaired two‐tailed statistical significance was assessed by Student's t‐test. (Right panel) Representative images of colonies are shown. Scale bars = 5 mm.
-
FSilencing ATF4 markedly decreased the migration of BGC823 cells with UHMK1 overexpression. (Left panel) The quantitative number of migrated cells in scramble+Flag, scramble+Flag‐UHMK1, siATF4+Flag, and siATF4+Flag‐UHMK1 group. Data were presented as mean ± standard deviation from three replicates. Unpaired two‐tailed statistical significance was assessed by Student's t‐test. (Right panel) Representative images of migrated cells in each group are shown. Scale bars = 100 μm.
-
GSilencing ATF4 markedly decreased the invasion of UHMK1 overexpressing BGC823 cells. (Left panel) The quantitative number of invaded cells in scramble+Flag, scramble+Flag‐UHMK1, siATF4+Flag, and siATF4+Flag‐UHMK1 group. Data were presented as mean ± standard deviation from three replicates. Unpaired two‐tailed statistical significance was assessed by Student's t‐test. (Right panel) Representative images of invaded cells in each group are shown. Scale bars = 100 μm.
Functionally, silencing ATF4 significantly reversed UHMK1‐induced BGC823 cell proliferation, migration, and invasion (Fig 4E–G). Therefore, we concluded that ATF4 is an essential effector downstream of UHMK1 in GC.
UHMK1 interacts with and phosphorylates nuclear receptor coactivator (NCOA3) at S1062/T1067
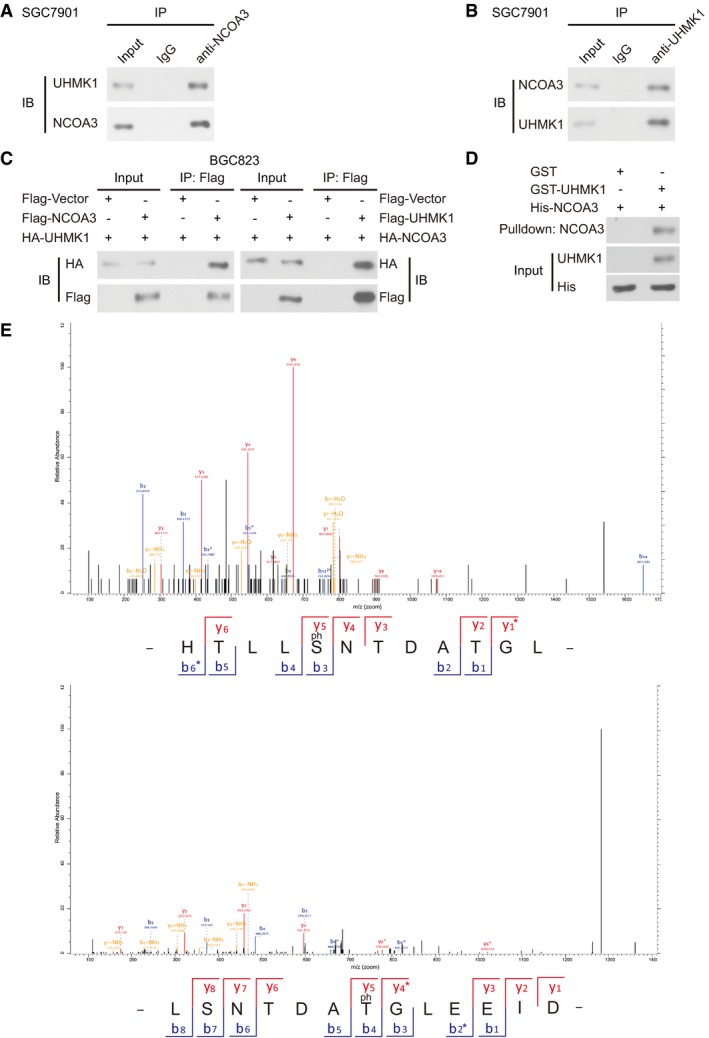
To explore the mechanism by which UHMK1 enhances the transcriptional activation of ATF4, we used tandem mass spectrometry (MS/MS) to analyze the UHMK1 immunocomplex isolated from HEK293T cells. These proteomic data were deposited in a public database PRIDE (Appendix Table S5). We then focused on NCOA3, a critical coactivator of ATF4 (Gupta et al, 2016), which was present in the immunocomplex (Appendix Table S6). The reciprocal immunoprecipitation in cultured BGC823 cells and pull‐down assay further validated their physical interaction, respectively (Appendix Fig S2). We reasoned that NCOA3 might be a direct effector downstream of UHMK1. In support of this idea, endogenous UHMK1 was found in endogenous NCOA3 immunocomplexes in SGC7901 cells (Fig EV4A and B). The result of co‐IP assays confirmed that exogenous UHMK1 interacted with co‐transfected NCOA3 in BGC823 cells (Fig EV4C). In addition, GST‐UHMK1 was found to be especially effective at pulling down His‐NCOA3 (Fig EV4D).
Figure EV4. UHMK1 interacts with and phosphorylates NCOA3 at S1062/T1067.
-
A, BThe endogenous binding between UHMK1 and NCOA3 in SGC7901 cells.
-
CCo‐IP assays were performed in BGC823 cells with indicated plasmids and antibodies.
-
DGST pull‐down assays.
-
EMS analysis identified that UHMK1 phosphorylated NCOA3 at S1062/T1067 in BGC823 cells.
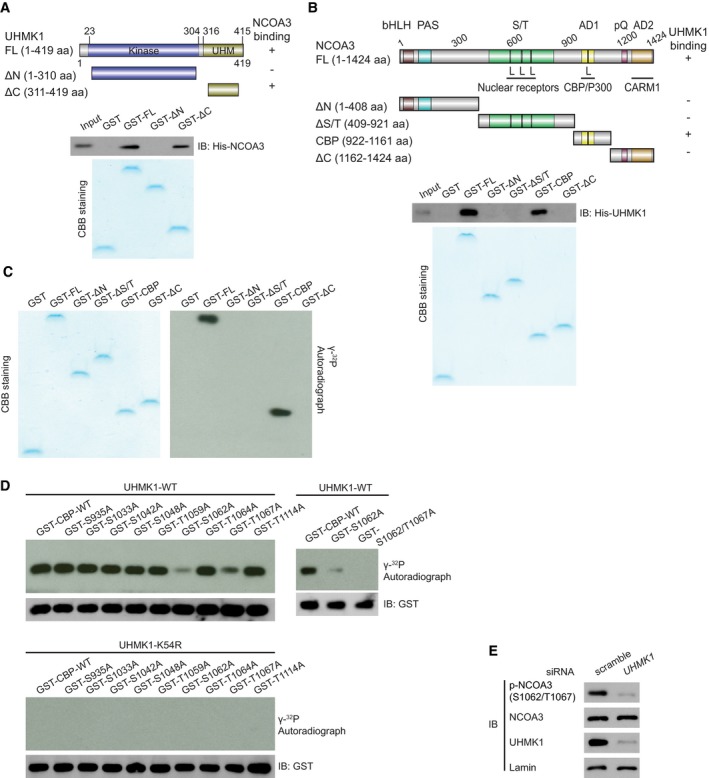
Moreover, we observed that the C‐terminal domain of UHMK1, which contains a U2AF homology motif (UHM), was essential for the interaction with NCOA3 (Fig 5A). However, His‐UHMK1 interacted mainly with the 922–1,161 aa fragment of NCOA3, a CBP‐containing domain (CBP) (Fig 5B). These findings indicate that UHMK1 directly binds NCOA3.
Figure 5. UHMK1 interacts with and phosphorylates NCOA3 at S1062/T1067.
-
AGST‐UHMK1 full length (FL), GST‐UHMK1 ΔN (N‐terminal truncated, 1–310aa), and GST‐UHMK1 ΔC (C‐terminal truncated, 311‐419aa) were constructed (upper panel). GST‐labeled FL, ΔN, and ΔC protein fragments were incubated with His‐NCOA3. Pull‐down, Coomassie blue staining, and Western blotting were performed (lower panel).
-
BGST‐NCOA3 full length (FL), GST‐NCOA3 ΔN (1–408aa), GST‐NCOA3 ΔS/T (409–921aa), GST‐NCOA3 CBP (922–1,161aa), and GST‐NCOA3 ΔC (1,162–1,424aa) were constructed (upper panel). Pull‐down assay with GST‐NCOA3 FL or its protein fragments (ΔN, ΔS/T, CBP, and ΔC) and His‐UHMK1 were performed (lower panel).
-
CWe performed an in vitro kinase assay by incubating purified NCOA3 FL or its protein fragments with purified UHMK1 kinase. These proteins were visualized using Coomassie blue staining. The phosphorylation of the substrates is shown in the autoradiograph.
-
DWT‐UHMK1 or kinase‐dead UHMK1‐K54R protein was mixed with GST‐CBP‐WT or the indicated mutant, and in vitro kinase assays were performed.
-
ESilencing UHMK1 in SGC7901 cells via UHMK1‐siRNA. NCOA3 phosphorylation at S1062/T1067 was measured with a special Ab that recognizes phosphorylated NCOA3‐S1062/T1067.
To determine whether UHMK1 can phosphorylate NCOA3, different GST‐NCOA3 protein fragments were used as substrates in in vitro kinase reactions. UHMK1 phosphorylated mainly the GST‐NCOA3‐CBP fragment (Fig 5C). Although the PhosphoSitePlus database predicted that 9 Ser or Thr residues within the CBP region of NCOA3 are phosphorylated, only mutation of both S1062 and T1067 to alanine (A) completely abolished the phosphorylation of the CBP domain by UHMK1 (Fig 5D). The MS/MS analysis results further confirmed that UHMK1 phosphorylated NCOA3 at S1062/T1067 in BGC823 cells overexpressing UHMK1 (Fig EV4E).
To easily show the importance of UHMK1 in mediating NCOA3 phosphorylation at S1062/T1067 in vivo, we produced a phospho‐specific antibody (Ab) against the S1062/T1067 residues. Two experiments were performed to validate this new phospho‐S1062/T1067 NCOA3 antibody (Appendix Fig S3). Using this antibody, we found that knockdown of endogenous UHMK1 in SGC7901 cells significantly suppressed NCOA3 phosphorylation at S1062/T1067 (Fig 5E), and this antibody did not recognize the S1062E/T1067E and S1062A/T1062A mutants (Appendix Fig S3). Collectively, our data indicate that UHMK1 directly phosphorylates NCOA3 at S1062/T1067.
UHMK1‐dependent phosphorylation of NCOA3 at S1062/T1067 promotes GC progression by activating purine synthesis
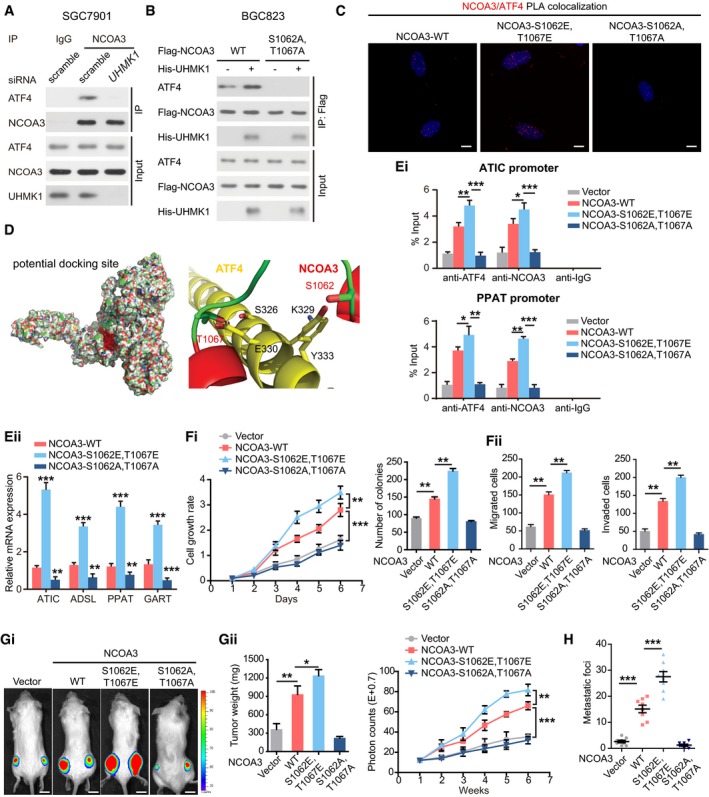
We then examined the physiological significance of NCOA3 phosphorylation by UHMK1 at S1062/T1067. The data in Fig 6A indicate that UHMK1 knockdown in SGC7901 cells strongly impaired the interaction of NCOA3 with ATF4. However, overexpression of UHMK1 in BGC823 cells promoted the binding of ATF4 to WT‐NCOA3 but not to the NCOA3‐S1062A/T1067A mutant (Fig 6B). These findings were further confirmed via a proximity ligation assay (PLA) (Fig 6C). Computational modeling of the structures predicted by ZDOCK software showed that phosphorylation of both S1062 and T1067 was essential for the direct binding of NCOA3 to ATF4 (Fig 6D; Li et al, 2007).
Figure 6. UHMK1‐dependent phosphorylation of NCOA3 at S1062/T1067 promotes GC progression by promoting the de novo purine synthesis pathway.
-
AKnockdown of UHMK1 blocked NCOA3 binding to ATF4. SGC7901 cells were treated as indicated. Co‐IP was carried out with mouse immunoglobulin G (IgG) or anti‐NCOA3 antibody. Then, Western blotting was performed.
-
BBGC823 cells were transfected with Flag‐NCOA3 or NCOA3‐S1062A/T1067A with or without His‐tagged UHMK1. Co‐IP was performed using an anti‐Flag antibody.
-
CProximity ligation assay of the interaction between different NCOA3 proteins and ATF4 in BGC823 cells. Confocal images were acquired with a Nikon A1 microscope and the Nikon Elements software suite. Maximum projection images are shown (original magnification ×120). Scale bars = 20 μm.
-
DComputational molecular docking analysis to investigate the molecular mechanism by which NCOA3‐S1062/T1067 phosphorylation is involved in the interaction of NCOA3 binding to ATF4. Based on the predictions of ZDOCK software, S1062 and T1067 of NCOA3 are located in the interface between ATF4 and NCOA3, and S1062/T1067 phosphorylation greatly enhances the binding affinity of NCOA3 for ATF4 by increasing NCOA3 hydrophilicity.
-
E(Ei) ChIP data from BGC823 cells are presented as indicated. (Eii) NCOA3‐S1062/T1067 phosphorylation by UHMK1 enhanced the expression of critical genes as indicated (three biological replicates).
-
F(Fi and Fii) The effects of WT‐NCOA3 and the NCOA3‐S1062A/T1067A, and NCOA3‐S1062E/T1067E mutants on BGC823 cell proliferation, invasion, and migration (three biological replicates).
-
G, HThe effects of WT‐NCOA3, and the NCOA3‐S1062A/T1067A, and NCOA3‐S1062E/T1067E mutants on GC growth and metastasis in the mouse model (n = 10 mice/group). Scale bars = 1 cm.
Consistent with these findings, exogenous expression of the NCOA3‐S1062E/T1067E but not the NCOA3‐S1062A/T1067A mutant significantly promoted the binding of the NCOA3/ATF4 complex to the promoters of critical metabolic genes in the purine pathway (Fig 6Ei), consequently enhancing their expression (Fig 6Eii).
Interestingly, both WT‐NCOA3 and NCOA3‐S1062E/T1067E, phosphomimetic construct, significantly enhanced GC aggressiveness in nude mice, while the NCOA3‐S1062A/T1067A construct exhibited the opposite effect (Fig 6F–H).
Therefore, we propose that NCOA3‐S1062/T1067 phosphorylation promotes GC progression by activating purine synthesis.
ATF4 enhances UHMK1 transcription in GC cells
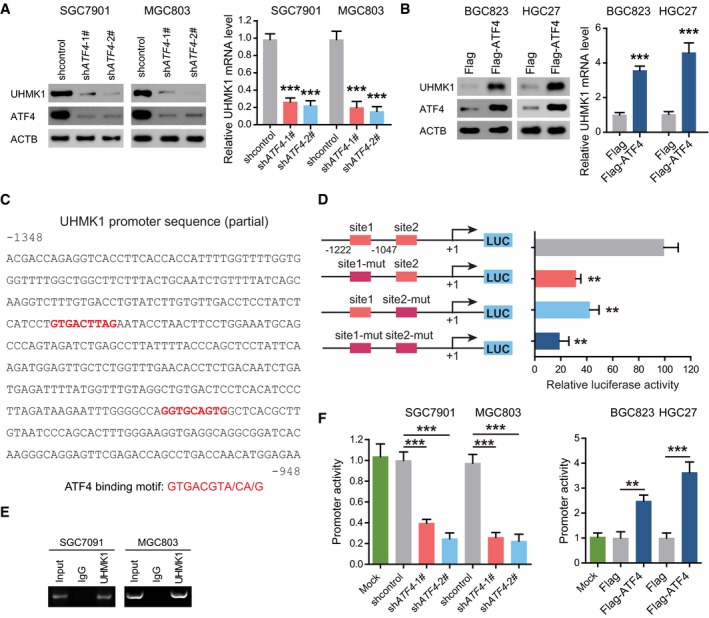
To determine whether ATF4 acts upstream of UHMK1 in GC, we treated SGC7901 and MGC803 cells with ATF4 siRNA. Interestingly, knockdown of ATF4 significantly decreased the protein and mRNA levels of UHMK1 (Fig 7A). However, overexpression of ATF4 had the opposite effects in BGC823 and HGC27 cells (Fig 7B).
Figure 7. ATF4 directly activates the transcription of the UHMK1 promoter in GC.
-
ASGC7901 and MGC803 cells were transfected with ATF4 shRNA or shcontrol. Western blottings and qRT–PCR were used to analyze the expression of UHMK1. Data were presented as mean ± standard deviation from three replicates. Unpaired two‐tailed statistical significance was assessed by Student's t‐test.
-
BOverexpression of ATF4 enhanced the expression of UHMK1 in BGC823 and HGC27 cells. Data were presented as mean ± standard deviation from three replicates. Unpaired two‐tailed statistical significance was assessed by Student's t‐test.
-
CThe nucleotide sequences showing the −1,348/−948 region in the human UHMK1 gene. The red text indicates the candidate ATF4 binding sites.
-
DThe effect of ATF4 on the activity of the WT‐UHMK1 promoter and its mutations, as evaluated by using luciferase reporter assays.
-
EChIP assays were used to examine the binding of ATF4 to the UHMK1 promoter in SGC7901 and MGC803 cells. Input DNA and nonspecific IgG were included as controls.
-
FATF4 deficiency and overexpression regulated the activity of the UHMK1 promoter in GC cells.
Sequence analysis of the UHMK1 promoter indicated two putative ATF4 binding motifs (Fig 7C). After mutation of these two sites, the activity of UHMK1‐luciferase reporters was significantly decreased (Fig 7D). Thus, ATF4 transcriptionally activates the UHMK1 promoter via these motifs.
The results of chromatin immunoprecipitation (ChIP) assays further showed ATF4 recruitment to the UHMK1 promoter in GC cell lines (Fig 7E). Consistent with this finding, increasing ATF4 expression in BGC823 and HGC27 cells enhanced UHMK1 promoter activity, while ATF4 knockdown in SGC7091 and MGC803 cells had the opposite effect (Fig 7F). Therefore, ATF4 promotes UHMK1 transcription in GC, thus forming a positive feedback loop.
Helicobacter pylori infection and GC‐associated UHMK1 mutation significantly enhance UHMK1 activity and NCOA3 phosphorylation at S1062/T1067 in GC
Since ATF4 activation was found to be significantly associated with H. pylori‐positive GC (Diaz et al, 2018), we examined whether H. pylori infection affected UHMK1 expression, NCOA3 phosphorylation at S1062/T1067, and ATF4 transcriptional activity in GC.
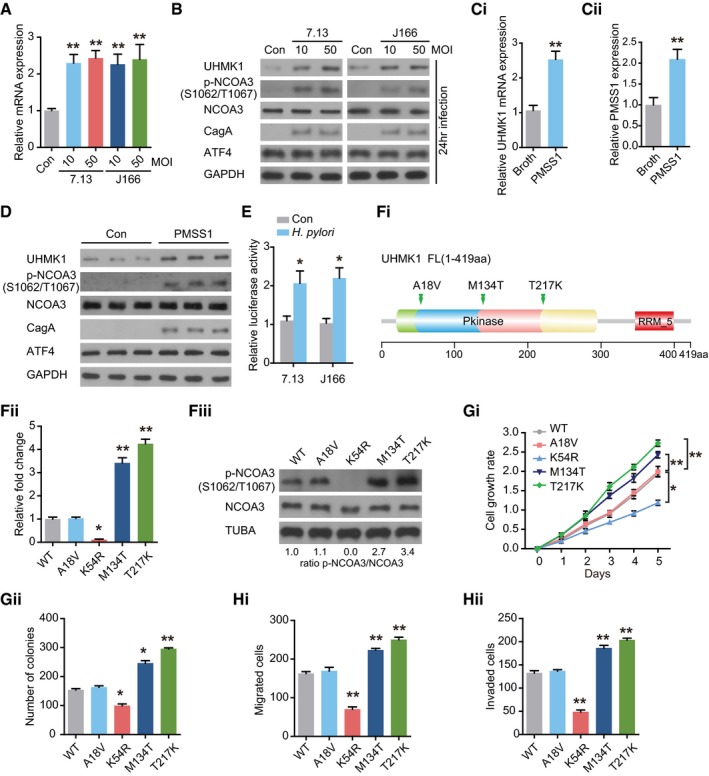
Interestingly, in BGC823 cells treated with or without J166 or 7.13 (two Cag + H. pylori strains) (Soutto et al, 2015), the expression of UHMK1 mRNA and protein was significantly upregulated (Fig 8A and B). When the Cag + H. pylori strain PMSS1 or Brucella broth (as the negative control) was used to challenge mice (Noto et al, 2019), PMSS1 infection significantly enhanced the levels of UHMK1 mRNA and protein compared to those in control mice (Fig 8C and D). Moreover, H. pylori infection significantly enhanced NCOA3 phosphorylation at S1062/T1067 but did not markedly affect the total levels of NCOA3 and ATF4 (Fig 8B and D).
Figure 8. H. pylori infection and GC‐associated UHMK1 mutation significantly enhance UHMK1 activity, NCOA3 phosphorylation at S1062/T1067, and ATF4 activity in GC.
-
AqRT–PCR was performed to analyze UHMK1 expression in BGC823 cells infected with or without H. pylori CagA + strains 7.13 and J166. MOI, multiplicity of infection. Data were presented as mean ± standard deviation from three replicates.
-
BImmunoblotting of UHMK1, NCOA3 phosphorylated at S1062/T1067, NCOA3, and ATF4 in the samples from (A).
-
CPMSS1, a H. pylori strain, was used to challenge mice orogastrically, with Brucella broth as the control. qRT–PCR was performed to measure UHMK1 (Ci) and PMSS1(Cii) expression in gastric tissues. Data were presented as mean ± standard deviation from three replicates.
-
DImmunoblotting of UHMK1, NCOA3 phosphorylated at S1062/T1067, NCOA3, and ATF4 in the samples from (C).
-
EAn ATF4 luciferase reporter assay was carried out in BGC823 cells with or without H. pylori infection. Data were presented as mean ± standard deviation from three replicates.
-
F(Fi) The domain architecture of UHMK1 and the positions of human GC‐associated mutations. (Fii and Fiii) IP kinase assay. Briefly, UHMK1 from HEK293 cells expressing WT‐UHMK1 or its mutants was immunoprecipitated with anti‐HA antibodies. The immunoprecipitated proteins were mixed with a synthetic peptide of the CATS protein (a known substrate of UHMK1) and [32P] ATP. A phosphocellulose paper assay was used to measure kinase activity. The results were normalized to a value of 1.0 for WT‐UHMK1(three biological replicates).
-
GThe effects of human GC‐associated UHMK1 mutations on the proliferation and colony formation of GC cells (three biological replicates).
-
HThe effects of human GC‐associated UHMK1 mutations on GC cell invasion and migration (three biological replicates).
We also evaluated whether H. pylori challenge affected the transcriptional activity of ATF4. As shown in Fig 8E, significant induction of ATF4 transcriptional activity was observed in BGC823 cells infected with H. pylori strain J166 or 7.13.
Although TCGA data analysis identified three somatic missense mutations of UHMK1 in human GC (Fig 8Fi), the functions of these mutations were not elucidated. As shown in Fig 8Fii, the M134T and T217K mutations, which are located in the kinase domain, greatly increased the activity of UHMK1, while the A18V mutation produced no obvious effect. The M134T and T217K mutations also upregulated NCOA3 phosphorylation at S1062/T1067 (Fig 8Fiii). Importantly, the M134T and T217K mutations strongly promoted GC cell proliferation and invasion (Fig 8G and H).
Taken together, these results indicate that H. pylori infection and GC‐associated UHMK1 mutations significantly enhance UHMK1 activity, NCOA3 phosphorylation at S1062/T1067, and ATF4 activity in GC cells both in vitro and in vivo.
Clinical correlations of UHMK1 with p‐NCOA3 (S1062/T1067) and ATIC in GC patients’ tissues
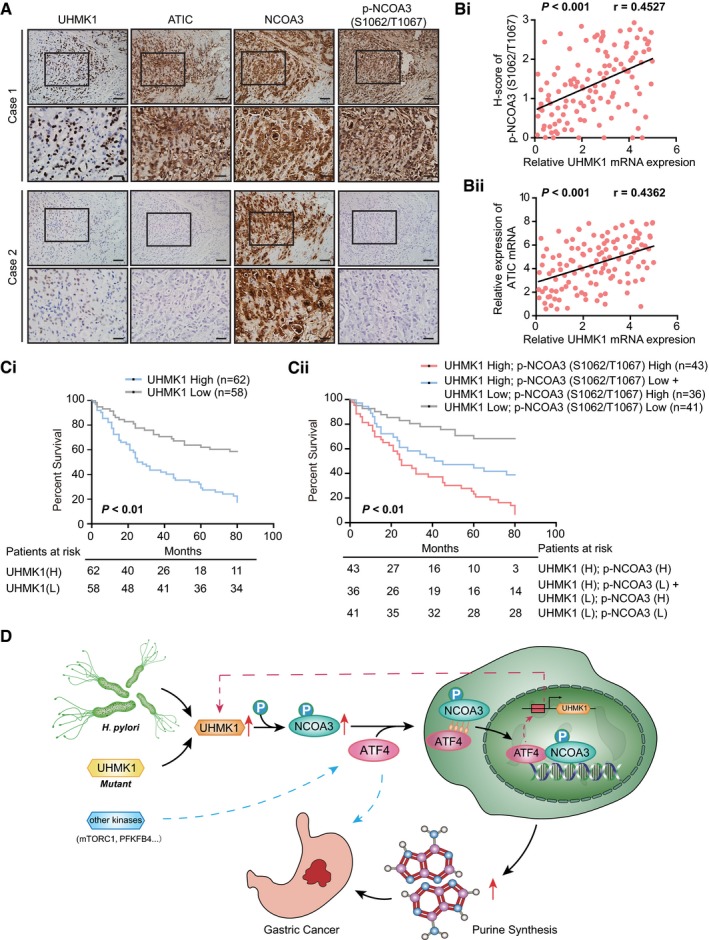
To further reveal the clinical significance of our data, we examined the correlations of UHMK1 with p‐NCOA3 (S1062/T1067) and ATIC in 120 GC patient samples. The results of immunohistochemistry (IHC) assays indicated significant positive correlations between these markers (Figs 9A and EV5, Appendix Tables S7 and S8). These findings were further validated using Pearson's correlation analysis (Fig 9Bi and Bii). The Kaplan–Meier data indicated that a high level of UHMK1 or p‐NCOA3 (S1062/T1067) in GC was markedly associated with poor OS (Fig 9C). Collectively, these findings suggest that targeting the UHMK1/NCOA3/ATF4 axis might be critical in the treatment of GC (Fig 9D).
Figure 9. Clinical correlations of UHMK1 with p‐NCOA3 (S1062/T1067) and ATIC in human GC samples.
-
AImages showing UHMK1, p‐NCOA3 (S1062/T1067), and ATIC protein expression in two human GC specimens. Scale bars = 100 μm.
-
BPearson's correlation analysis about of the levels of UHMK1, p‐NCOA3 (S1062/T1067), and ATIC proteins in patients with GC (n = 120) by IHC.
-
C(Ci) OS data from GC patients stratified by the level of UHMK1. (Cii) Combination of UHMK1 and p‐NCOA3 (S1062/T1067) expression predicts more exact OS of GC patients. Survival curves were plotted according to Kaplan–Meier method, with the log‐rank test applied for comparison.
-
DSchematic depicting the function of UHMK1 in GC. H. pylori‐induced upregulation of UHMK1 or human GC‐associated UHMK1 mutation enhances the level of NCOA3 phosphorylation at S1062/T1067; this event greatly increases the association of NCOA3 with ATF4, which activates the de novo purine biosynthesis pathway and promotes the development of GC. Interestingly, activated ATF4 transcriptionally upregulated UHMK1 expression.
Figure EV5. Clinical correlations between UHMK1, p‐NCOA3 (S1062/T1067), and ATIC in human GC specimens.
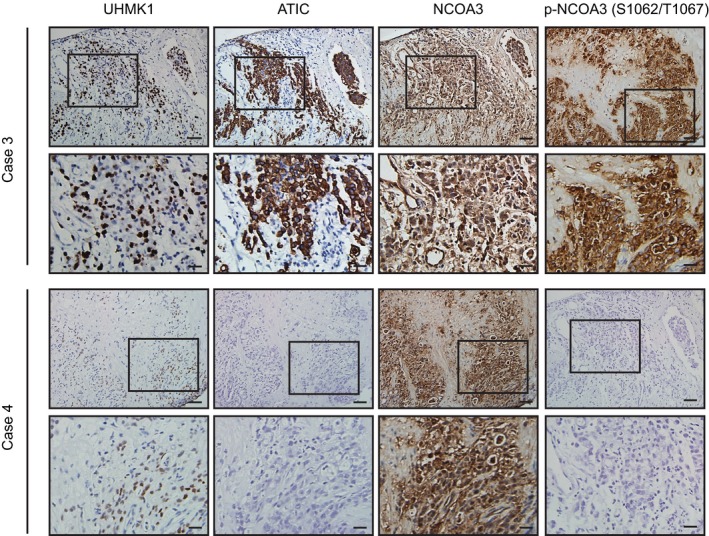
Representative pictures showing UHMK1, p‐NCOA3 (S1062/T1067), and ATIC protein expression in two human GC specimens using continuous slides. Scale bars = 100 μm.
Discussion
This report, for the first time, elucidated an important role of the UHMK1 kinase in the reprogramming of GC metabolism. We demonstrated that (i) UHMK1 is significantly upregulated in GC tissues compared to normal control tissues, and silencing UHMK1 in GC cells strongly inhibits tumor aggressiveness; (ii) the roles of UHMK1 in GC are mediated at least partially via activation of the de novo purine synthesis pathway; (iii) this action of UHMK1 requires ATF4 and its key coactivator NCOA3; (iv) UHMK1 directly phosphorylates NCOA3 at S1062 and T1067, thereby increasing its binding to ATF4 and the expression of purine metabolism‐associated target genes; (v) H. pylori infection and human GC‐associated UHMK1 mutations (M134T and T217K) induce NCOA3‐S1062/T1067 phosphorylation and enhance UHMK1 activity; and (vi) the level of UHMK1 is significantly correlated with the level of phospho‐NCOA3 (S1062/T1067) and ATIC in human GC specimens. Together, our data elucidate a previously unrecognized mechanism that is operational in GC, thus paving a path to identify novel GC therapies.
In contrast to the extensive knowledge about the PI3K/AKT and MAPK kinase signaling pathways (Matsuoka & Yashiro, 2014), very little is known about UHMK1, its upstream activators, and its the downstream targets, let alone its action mechanisms in carcinogenesis. Although all three known substrates of UHMK1 (p27KIP1, FAM64A, and SF1) have been shown to be involved in carcinogenesis and UHMK1 positively modulates cell cycle progression in untransformed cells (Boehm et al, 2002; Manceau et al, 2008; Cambray et al, 2009), the functions of UHMK1 in GC development are unclear. Here, we demonstrated that UHMK1 upregulation in advanced GC significantly promotes its growth and dissemination, strongly indicating that UHMK1 functions as an oncogene and should be considered as a candidate therapeutic target in this deadly and invasive disease.
Metabolite analysis has recently become an active area of investigation because it may facilitate the understanding of metabolic dysregulation in cancer and the function of cancer‐related genes in disease processes (Sullivan et al, 2016). One consideration in this study is that MS/MS‐based profiling of metabolites might be a very good tool to uncover the molecular mechanisms of UHMK1 in GC progression. Indeed, via this method, this study revealed a new function of UHMK1 in promoting purine metabolism, not glycolysis and the PPP pathway, in GC cells. Our data and other reports indicate that metabolomics is a powerful technology currently used not only to discover diagnostic cancer biomarkers in the clinic, but also to clarify functional pathways involved in cancer (Burton & Ma, 2019). In accordance with the above idea, NCOA3 was identified as a novel substrate of UHMK1, and ATF4 but not c‐Myc or MITF was identified as its downstream effector in GC. Therefore, our findings uncover a previously unrecognized molecular mechanism of UHMK1 in GC development. Although our results indicate the critical role of this UHMK1‐NCOA3‐ATF4 axis in GC, the ATF4 knockdown has effects independent of UHMK1. For example, ATF4 knockdown inhibits glycolysis and serine metabolism besides purine synthesis (Yoshizawa et al, 2009; Selvarajah et al, 2019). On the other hand, the previous studies indicate that not all of ATF4 effects are due to UHMK1's modulation of ATF4. Other kinases such as mTORC1 and 6‐phosphofructo‐2‐kinase/fructose‐2,6‐biphosphatase 4 (PFKFB4) have been shown to activate ATF4 (Ben‐Sahra et al, 2016; Dasgupta et al, 2018).
Notably, there have been a number of recent advances in approaches utilizing small‐molecule inhibitors of purine metabolism‐related kinases for treating cancer. For example, the selective cytotoxicity of inhibitors of GART and IMPDH, two core enzymes in de novo purine synthesis, has been clinically tested in acute lymphoblastic leukemia (ALL) (Li et al, 2015). Additional enzymes in the purine metabolic pathway might be suitable targets for the treatment of chemoresistant ALL (Bouzar et al, 2009). Our studies in GC further support this idea. In this context, these inhibitors could also impact the prevention or treatment of GC. Therefore, targeting of the purinosome might be an important future research direction.
The results outlined in this paper parallel those in a previous report, indicating that the NCOA3/ATF4 complex plays a critical role in the purine metabolism in breast cancer (Dasgupta et al, 2018). In that report, the authors propose that PFKFB4 phosphorylates NCOA3 at S857, resulting in upregulation of ATF4 transcriptional activity (Dasgupta et al, 2018). However, we clearly demonstrated that in GC, an alternate kinase, UHMK1, is involved in the functional enhancement of NCOA3. Our observations are not unexpected, because several domains of NCOA3 can bind to various proteins and multiple Ser/Thr sites in NCOA3 have been predicted to be phosphorylated by different kinases. Here, we identified UHMK1 as a new kinase of NCOA3 via phosphorylation of S1062/T1067. Although further study is required to clarify the differences in the applicability of these mechanisms in various tumors, targeting S1062/T1067 phosphorylation may be an effective therapeutic approach for GC with UHMK1 overexpression. This conclusion is further supported by the following data: (i) H. pylori infection induced NCOA3‐S1062/T1067 phosphorylation and enhanced the promoter activity of UHMK1 via ATF4; and (ii) GC‐associated UHMK1 mutation promoted its binding to NCOA3 and its activity. Of course, we did not rule out the possibility that PFKFB4 might also contribute to GC. But this was beyond the scope of this work.
By analyzing the public Oncomine database, we found that the DNA level of UHMK1 is also frequently increased in liver cancer (Appendix Fig S4). Based on our findings in GC, it is tempting to speculate that the UHMK1‐enhanced purine synthesis pathway might similarly be involved in hepatoma carcinogenesis. If so, these results support the idea that UHMK1 does not selectively promote GC but may universally affect cancers of the digestive system. Future studies should explore the potential therapeutic benefit of targeting UHMK1 in diverse tumor types.
In summary, this study provides strong evidence that UHMK1 contributes to purine metabolism reprogramming in GC by regulating the NCOA3/ATF4 axis, suggesting that UHMK1 might be a potential biomarker and attractive therapeutic target for GC.
Materials and Methods
Cell culture, reagents, and antibodies
HEK293T, gastric epithelium cells (GES‐1 as control), and gastric cancer (GC) cells (MKN28, BGC823, HGC27, MGC803, MKN45, and SGC7901) were provided by American Type Culture Collection and passed as described (Yusefi et al, 2018; Zhu et al, 2019). 13C‐glycine, 15N‐glutamine, fetal bovine serum (FBS), and protease inhibitor cocktail were obtained from Santa Cruz. 14C‐Glycine was from PerkinElmer. Lipofectamine 2000, PBS, antibiotics, and DMEM were purchased from Invitrogen. Tween‐20 and X‐film were provided by Sigma. Site‐Directed Mutagenesis Kit (Agilent) was from QuikChange II. Anti‐Flag M2‐conjugated agarose was from Sigma. Anti‐UHMK1 (Santa Cruz Biotechnology, sc‐393605), PRPS2 (Abcam #ab55918), NCOA3 (Santa Cruz Biotechnology, #sc25742), ADSL (GeneTex #GTX84956), ATF4 (Santa Cruz Biotechnology #sc390063), GAPDH (Abcam #ab9485), IMPDH1 (Abcam #ab33039), Actin (Abcam #ab8226), PPAT (Abcam #ab204366), c‐Myc (Abcam #ab39688), ATIC (Zymed Laboratories Inc., #410100), MITF (Abcam #ab20663), GART (Proteintech #13659‐1‐AP), Lamin A (Abcam #ab26300), PPAT (Proteintech #15401‐1‐AP), secondary antibodies (Bio‐Rad, #1706515 and #1706516), and pS1062/T1067‐NCOA3‐specific antibody were made by this laboratory using the similar methods as described previously (Hong et al, 2018).
ShRNA, siRNA, and plasmids
For shRNA transfection, 6‐well plates were used to culture MGC803 and SGC7901 cells overnight prior to transfection (about 2 × 10⁵ cells/well). As previously reported (Hong et al, 2014), they were transduced through spinoculation with three different shRNAs against UHMK1 (shUHMK1‐#1, shUHMK1‐#2, and shUHMK1‐#3) or shcontrol with lentivirus particles at multiplicity of infection (MOI) about 1. After about two weeks of antibiotic selection (1 μg/ml) later, stable polyclonal GC cell lines with shcontrol or shUHMK1 were established. For siRNA transfection, Lipofectamine 2000 (Invitrogen) was used to perform siRNA transfection for siATF4, siMyc, siMITF, or scramble negative control (Invitrogen) following the protocol. Immunoblots were used to determine the efficiency of knockdown at 2 days after transfection. All siRNAs and shRNA were as follows: shUHMK1‐#1: 5′‐CCAGAAGCAGAAUUGCAAATT‐3′; shUHMK1‐#2: 5′‐GAUGCUUGAUCUUGCACAATT‐3′; shUHMK1‐#3: 5′‐UCUUCCUUAUUGUUGATT‐3′; or shcontrol: 5′‐AATGCTCGCACAGCACAAG‐3′ (Santa Cruz Biotechnologies); and siPPAT: 5′‐GAA AUGGUCUGGAAUGUUU‐3′; siMITF: 5′‐GAAACUUGAUCGACCUCU ACA‐3′ and 5′‐UAGAGGUCGAUCAAGUUUCCA‐3′;siATIC: 5′‐CAGUCUAACUCUGUGUGCUACGCCA‐3′;siATF4: 5′‐CCACGUAUG ACACUUGdTdT‐3′; siMyc: 5′‐TCC GTA CAG CCCTATTTCA‐3′ (Invitrogen); a shRNA‐resistant mutant UHMK1Δ was constructed by making five silent mutations at CDS area (534G > C, 537 T > A, 541 A > T, 551 T > C, and 554 C > A) against UHMK1 shRNA.
Human UHMK1 construct (OriGene, RC214962) was purchased from OriGene. Human ATF4 plasmid was purchased from Addgene Plasmid (Cat: #26114). NCOA3 vector was from Dr. Bingbing Wang at the State University of New Jersey. Mutants or truncated fragments from different genes such as UHMK1 and NCOA3 were constructed as described previously (Song et al, 2018). And sequencing was used to verify the resulting mutants.
The sample collection of GC patients
In this study, tissue samples of all GC patients and corresponding nontumor gastric samples were collected at the Affiliated Hospital, Harbin Medical University, from 2012 to 2017. This study ethical was passed by the Harbin Medical University Institute Research Ethics Committee. And all informed consents were taken from each GC participant. All tumor tissues for RNA isolation and immunohistochemistry (IHC) were histopathologically confirmed by a pathologist. Tumor–node–metastasis (TNM), a cancer staging system, was used to define the histological type and cancer stage according to the American Joint Committee (the 7th edition).
Western blot
GC tissues or cell lines were collected using lysis buffer RIPA (1% deoxycholate, 1.5 mM MgCl2, 50 mM HEPES, 0.1% sodium dodecyl sulfate, 1% Triton X‐100, 150 mM NaCl, 10% glycerol, 1 mM EGTA, and protease inhibitor) (Bio‐Rad). BCA protein reagent (Pierce) was used to measure protein concentration. Denaturing 10% SDS–polyacrylamide gel electrophoresis separated all samples which were then transferred to PVDF membrane. After blocked using TBST containing 5% milk for 1 h, indicated primary antibody was added on PVDF membranes at 4°C overnight. As previously described (Qu et al, 2016), secondary antibody was added and enhanced chemiluminescence (Pierce) were used to visualize blots.
Co‐immunoprecipitation
As described (Qu et al, 2016), the indicated antibodies were added to the 500 μg of pre‐cleared samples and were rotated at 4°C about 8 h. Then, A&G beads (Sigma) were mixed with samples for 3 h. Finally, the immunoprecipitation complexes were subjected to blot analysis.
Polymerase chain reaction
TRIzol (Thermo Fisher Scientific) was purchased to purify indicated RNA from GC cells or GC tissues. Then, random primers and a Reverse Transcription Kit (Invitrogen) were purchased to reversely transcribe total RNA into the complementary DNA (cDNA). Subsequently, RT–PCR was finished by Applied Biosystems. Primers for the respective genes were synthesized by Invitrogen. The relative levels of indicated proteins were analyzed through the 2− ΔΔCt method. The endogenous control is GAPDH. All primer sequences are as follows: UHMK1, 5′‐AGAGAAACCATGGGCAGAAG‐3′ and 5′‐CAAGCCATGAAACAGCATCT‐3′; ATF4, 5′‐TTCTCCAGCGACAAGGCTAAGG‐3′, 5′‐CTCCAACATCCAATCTGTCCCG‐3′; PPAT, 5′‐GCGATTGAAGCACCTGTG GATG‐3′ and 5′‐CGGTTTTTACACAGCACCTCC AC‐3′; ADSL, 5′‐TAGCGACAGGTATAAATTCC‐3′ and 5′‐TCTCCTGCCCTTGCTTTCCT‐3′; GART, 5′‐GGAATCCCAACCGCACAATG‐3′ and 5′‐AGCAGGGAAGTCTGCACTCA‐3′; IMPDH1, 5′‐GTCTGCATCCCCCAACCAAAG‐3′ and 5′‐ACTGCTGCAGGCCGGCTAC‐3′; ATIC, 5’‐CACGCTCGAGTGACAGTG‐3′ and 5’‐TCGGAGCTCTGCATCTCCG‐3′; and GAPDH, 5′‐GCCCAATACGACCAAATCC‐3′ and 5′‐CACCACATCGCTCAGACAC‐3′.
Metabolites assays
LC/MS/MS was used to analyze intracellular metabolites of indicated cells as described previously (Ben‐Sahra et al, 2016). Briefly, glycine‐free DMEM was used to wash indicated cells, and then, cells were added with the same medium containing 400 μM [13C1] for 30 min. For [15N]‐glutamine (amide‐labeled) flux studies, cells were washed once with glutamine‐free DMEM and then incubated in the same medium containing 4 mM 15N‐glutamine for 20 min. Metabolites were extracted using 4 ml 80% methanol on dry ice. After spinning at 4,000× g at 4°C, the insoluble pellets were isolated by 0.5 ml 80% methanol via spinning at 20,000× g at 4°C. An N‐EVAP from Organomation Associates was used to dry the metabolites under nitrogen gas. The 10 μl HPLC grade water was added to resuspended pellets, and then, MS analysis was performed. Finally, AB/Sciex, a MultiQuant v2.0 software, was used to analyze the metabolite SRM transition. The SRMs were used to analyze the incorporation of 15N or 13C incorporation by LC‐MS/MS.
Identifying UHMK1‐binding proteins and NCOA3 phosphorylation sites by mass spectrometry
As described previously (Song et al, 2015), Flag‐tagged UHMK1 was transfected into HEK293T cells, with an empty vector as control. Flag M2 agarose beads (Sigma) were used to pull down the proteins which bind to UHMK1 overnight. The washing buffer (0.2 mM PMSF, 15% glycerol, 1 mM EDTA, 0.05% Nonidet P (NP) 40, 1 mM dithiothreitol (DTT), 150 mM KCl, and 20 mM Tris–HCl) was made to rinse samples, and then, a TBS buffer followed. Finally, the eluted proteins were loaded on SDS–PAGE gels which were cut for MS analysis. NCOA3 phosphorylation sites were identified as described previously (Song et al, 2015).
Cell proliferation assay
Briefly, in normal medium, the Cell Counting Kit‐8 (CCK‐8) solution was added into GC cells in 10% dilution. Then, color conversion was observed. At indicated time points, proliferation rates of GC cells were examined after transfection.
Colony formation
Briefly, 500 indicated cells were seeded in the 6‐well plate. After cultured at 37°C for about 2 weeks, 100% methanol was added into these cells. After discarding the methanol, sufficient trypan blue solution was added for staining. A digital camera was used to count the colonies. All experiments were repeated at least triplicate. The Mann–Whitney U‐test was used for determining statistical significance.
Cell immigration and invasion assays
For invasion assays, Transwell with 8‐μm pore and Matrigel (Corning Co.) were used to measure the invasive ability of GC cell lines. Briefly, indicated 2 × 10⁴ cells per well were seeded into the upper chamber after 48 h of transfection with 100 μl DMEM not containing FBS. Then, 500 μl medium was added to the lower chambers including 10% FBS which acted as a chemoattractant. Twenty‐four hours later, wipe off cells left on the upper membrane with a cotton swab while keeping the cells that had invaded. After fixed in 4% formaldehyde, 1% crystal violet was used to stain the invaded cells. An inverted microscope (Nikon) was used to count ten random visual fields. For migration assay, Transwell with 8‐μm pore insert without Matrigel was used. Similar way to invasion assay was used.
GST pull‐down assay
As previously described (Song et al, 2015), Escherichia coli was used to express GST‐fusion proteins. Then, IPTG induced their expression. Proteins were purified using glutathione Sepharose 4B beads purchased from Sigma. GST‐tagged UHMK1 or NCOA3, and GST (around 10 μg) were cross‐linked by dimethyl pimelimidate dihydrochloride to glutathione Sepharose in reaction buffer (10% glycerol, 1 mm EDTA, 20 mm HEPES; 150 mm KCl, 0.1% Nonidet P (NP) 40), pH 8.0. After eluted with sample buffer, Coomassie staining and Western blot were used to analyze the samples.
Luciferase reporter assays
As described previously (Hong et al, 2014), we cultured HEK293T cells to perform the dual‐luciferase reporter assays. Briefly, using Lipofectamine 2000 overnight after plating, 0.2 μg of the firefly promoter–luciferase reporter constructs (WT‐UHMK1 or UHMK1 mutant promoter) was co‐transfected with indicated plasmids. The control group was PGL‐TK Renilla luciferase plasmid. The activity was monitored via a Dual‐Luciferase System bought from Promega. And the luciferase activity was averaged from three replicates.
Chromatin immunoprecipitation (ChIP)
As described (Qu et al, 2016), the primers which were adopted for ATF4 motif are, respectively, (5′‐CTGTATCTTGTGTTGAC‐3′) and (5′‐GGAAATGCAGCCCAGTA‐3′); (5′‐CTTAGATAAGAATTTGG‐3′) and (5′‐GTAATCCCAGCACTTTG‐3′).
Mice xenograft experiments
In accordance with NIH Guidelines, mice experiments were performed. And the Institutional Animal Committee at Harbin Medical University approved animal protocols. For xenograft model, BGC823‐pLV‐UHMK1 and BGC823‐pLV‐NC or SGC7901‐pLV‐shUHMK1 or SGC7901‐pLV‐shcontrol were bought and implanted into the posterior flank of the nude mouse (n = 10/group). At indicated time, the size and volume of the tumor were calculated as described previously (Hong et al, 2014).
Tissue arrays and immunohistochemical (IHC) staining
GC tissue microarray (TMA) was purchased from Alenabio Company, and IHC staining was performed for UHMK1. As described previously (Qu et al, 2016), IHC staining was evaluated and scored by the scale: 0, 1+, 2+, and 3+, representing no staining, weak, moderate, and strong staining, respectively. The final H‐score was calculated based on the formula reported previously (Hirsch et al, 2003). The indicated protein levels were defined by H‐score; then, low and high expression patient groups were divided.
Immunoprecipitation kinase analysis
As described before (Prieto‐Echagüe et al, 2010), IP kinase assay was done. Briefly, the lysate (1 mg) was mixed with anti‐HA antibody (Santa Cruz). Twenty‐four hours later, protein G‐agarose beads (Santa Cruz) were added. The immunocomplexes were resuspended in buffer containing 1 mm Na3VO4. By using the phosphocellulose paper assay, the immunoprecipitated UHMK1 activity was examined as follows. One synthetic peptide (1 mM) derived from the CATS protein phosphorylation site (a known substrate of UHMK1) was added as a substrate in the mixture (0.4 mM ATP, 10 mM MgCl2, 1 mm Na3VO4, 20 mM Tris, and [γ32P]ATP) pH 7.4. After 30 min at 30°C, 10% trichloroacetic acid terminated the reaction. Then, the mixtures were loaded as a dot on the p81 phosphocellulose paper. Scintillation counting was used to determinate incorporation of 32P into peptide.
TCGA and oncomine data
Whole‐genome RNA sequencing (RNA‐seq) data about the gastric cancer TCGA dataset were downloaded by website: https://xenabrowser.net. The patients with unavailable survival data were excluded. The relevant clinical characteristics, including age, gender, pathologic TNM, disease stage, survival time, and censor, were obtained from TCGA dataset. Samples in three groups were stratified according to their UHMK1 gene levels (low, intermediate, high). The 25th and 75th percentiles were used as cutoff. Benjamini–Hochberg procedure was used to calculate the false discovery rate and top 500 upregulated genes were chosen for gene ontology analysis by https://biit.cs.ut.ee/gprofiler/gost.
A web‐based data mining platform and cancer microarray database, Oncomine data about UHMK1 analysis in GC were also downloaded from the public websites. The expression pattern was plotted using GraphPad Prism 7 software.
GC metastasis model
For GC metastasis assays, the abdominal cavities of 4‐ to 6‐week‐old male BALB/c nu/nu were injected with about 1 × 10⁶ cells with BGC823‐pLV‐UHMK1 or BGC823‐pLV‐NC or SGC7901‐pLV‐shUHMK1 or SGC7901‐pLV‐shcontrol. At indicated times, peritoneal metastatic tumors were counted, imaged, and presented.
In vitro kinase
1 μg recombinant UHMK1 protein and purified WT‐NCOA3 or its mutant proteins were mixed with 1× reaction buffer containing 10 μM ATP and 0.2 mM Na3VO4 and 10 μCi [γ‐32P] ATP. The reaction proceeded at 30°C for 15 min. Then, the mixtures were separated and incorporated [γ‐32P] radioisotope was detected by imaging plate‐autoradiography system.
Infection of cell lines or mice with H. pylori
The Cag + H. pylori strains used in this project were as followed: wild‐type (WT) 7.13, J166, and PMSS1 which is a rodent‐adapted bacteria. As previously described (Zhu et al, 2017), for passage in vitro, trypticase soy agar plates were used to culture these strains with 5% sheep blood (Invitrogen). Then, at 37°C with 5% CO2, Brucella broth (Invitrogen) was used to culture H. pylori bacteria with 10% FBS (Sigma) about 18 h. For in vitro studies, gastric epithelial cells were infected with H. pylori strains by using a multiplicity of infection (MOI) of 50:1.
For mice, Brucella broth orogastrically challenged C57BL/6 mice (n = 10/group) with or without WT PMSS1 H. pylori bacteria (109 CFU per mouse). About 8 weeks later postchallenge, all mice were euthanized. Then, whole gastric tissues were collected, and real‐time polymerase chain reaction (PCR) and immunoblots were preformed (Noto et al, 2013).
Statistics
The Student's t‐test was used to analyze the results from two groups. As comparing data from the groups greater than two, we used one‐way ANOVA. To analyze the growth curves, we used two‐way ANOVA. Pearson's correlation analysis was used to elucidate the correlation of two proteins. Program for GraphPad Prism 5, R software package (version 3.0.0), and Social Sciences software 20.0 (SPSS) was used. Determining Kaplan–Meier data needed the log‐rank test. Data were reported through mean ± SD, at least carried out in triplicate. Statistical value (*P < 0.05) was significant. **P < 0.01 or ***P < 0.001 was very significant, while # marked no significance.
Author contributions
XF and XH designed and evaluated the concept of this study; XF, DM, JZ, YS, YZ, QZ, FM, XL, MZ, YL, YX, XQ, and KZ acquired data; ZZ, FM, HZ, YZ, and XL analyzed and interpreted data; XF, XH, and ZZ drafted the manuscript, which was critiqued by all authors; ZZ was responsible for study supervision of the study and critical revision of the manuscript for important intellectual content.
Conflict of interest
The authors declare that they have no conflict of interest.
Supporting information
Appendix
Expanded View Figures PDF
Review Process File
Acknowledgements
The authors would like to thank the Cancer Institute of New Jersey for providing the supports of the entire research team. This work was supported by National Natural Science Foundation of China (No. 81702387, No. 81702744), Natural Science Foundation of Fujian Province (No. 2017J01368, No. 2017J01369), Training Program for Young Talents of Fujian Health System (No. 2016‐ZQN‐85), Fujian Provincial Funds for Distinguished Young Scientists (No. 2018D0016), and Fujian Health Education Joint Research Project (WKJ2016‐2‐17). The funders had no role in study design, data collection and analysis, decision to publish, or preparation of the manuscript. The authors also thank Shanghai Tongshu Biotechnology Co., Ltd. for technical support.
The EMBO Journal (2020) 39: e102541
Contributor Information
Kaiguang Zhang, Email: zhangkaiguang@ustc.edu.cn.
Xuehui Hong, Email: hongxu@xmu.edu.cn, Email: hxh5717@163.com.
Zhiyong Zhang, Email: zhangz2@rwjms.rutgers.edu, Email: zhiyongzhng3@gmail.com.
Data availability
The mass spectrometry raw data included from this publication have been deposited to the ProteomeXchange Consortium (http://www.proteomexchange.org/) via the PRIDE partner repository and assigned the identifier PRIDE: PXD015693.
References
- Barbutti I, Machado‐Neto JA, Arfelli VC, de Melo Campos P, Traina F, Olalla Saad ST, Froehlich Archangelo L (2017) The U2AF homology motif kinase 1 (UHMK1) is upregulated upon hematopoietic cell differentiation. Biochim Biophys Acta Mol Basis Dis 1864: 959–966 [DOI] [PubMed] [Google Scholar]
- Ben‐Sahra I, Hoxhaj G, Ricoult SJH, Asara JM, Manning BD (2016) mTORC1 induces purine synthesis through control of the mitochondrial tetrahydrofolate cycle. Science 351: 728–733 [DOI] [PMC free article] [PubMed] [Google Scholar]
- Boehm M, Yoshimoto T, Crook MF, Nallamshetty S, True A, Nabel GJ, Nabel EG (2002) A growth factor‐dependent nuclear kinase phosphorylates p27Kip1 and regulates cell cycle progression. EMBO J 21: 3390–3401 [DOI] [PMC free article] [PubMed] [Google Scholar]
- Bouzar AB, Boxus M, Defoiche J, Berchem G, Macallan D, Pettengell R, Willis F, Burny A, Lagneaux L, Bron D et al (2009) Valproate synergizes with purine nucleoside analogues to induce apoptosis of B‐chronic lymphocytic leukaemia cells. Br J Haematol 144: 41–52 [DOI] [PubMed] [Google Scholar]
- Burton C, Ma Y (2019) Current trends in cancer biomarker discovery using urinary metabolomics: achievements and new challenges. Curr Med Chem 26: 5–28 [DOI] [PubMed] [Google Scholar]
- Cambray S, Pedraza N, Rafel M, Gari E, Aldea M, Gallego C (2009) Protein kinase KIS localizes to RNA granules and enhances local translation. Mol Cell Biol 29: 726–735 [DOI] [PMC free article] [PubMed] [Google Scholar]
- Dasgupta S, Rajapakshe K, Zhu B, Nikolai BC, Yi P, Putluri N, Choi JM, Jung SY, Coarfa C, Westbrook TF et al (2018) Metabolic enzyme PFKFB4 activates transcriptional coactivator SRC‐3 to drive breast cancer. Nature 556: 249–254 [DOI] [PMC free article] [PubMed] [Google Scholar]
- Dayie TK, Thakur CS (2010) Site‐specific labeling of nucleotides for making RNA for high resolution NMR studies using an E. coli strain disabled in the oxidative pentose phosphate pathway. J Biomol NMR 47: 19–31 [DOI] [PMC free article] [PubMed] [Google Scholar]
- Diaz P, Valenzuela Valderrama M, Bravo J, Quest AFG (2018) Helicobacter pylori and gastric cancer: adaptive cellular mechanisms involved in disease progression. Front Microbiol 9: 5 [DOI] [PMC free article] [PubMed] [Google Scholar]
- Francone VP, Ifrim MF, Rajagopal C, Leddy CJ, Wang Y, Carson JH, Mains RE, Eipper BA (2010) Signaling from the secretory granule to the nucleus: Uhmk1 and PAM. Mol Endocrinol 24: 1543–1558 [DOI] [PMC free article] [PubMed] [Google Scholar]
- Grant RC, Denroche RE, Borgida A, Virtanen C, Cook N, Smith AL, Connor AA, Wilson JM, Peterson G, Roberts NJ et al (2018) Exome‐wide association study of pancreatic cancer risk. Gastroenterology 154: 719–722 e3 [DOI] [PMC free article] [PubMed] [Google Scholar]
- Gupta A, Hossain MM, Miller N, Kerin M, Callagy G, Gupta S (2016) NCOA3 coactivator is a transcriptional target of XBP1 and regulates PERK‐eIF2alpha‐ CDKI signalling in breast cancer. Oncogene 35: 5860–5871 [DOI] [PMC free article] [PubMed] [Google Scholar]
- Hirsch FR, Varella‐Garcia M, Bunn PA Jr, Di Maria MV, Veve R, Bremmes RM, Barón AE, Zeng C, Franklin WA (2003) Epidermal growth factor receptor in non–small‐cell lung carcinomas: correlation between gene copy number and protein expression and impact on prognosis. J Clin Oncol 21: 3798–3807 [DOI] [PubMed] [Google Scholar]
- Hong X, Song R, Song H, Zheng T, Wang J, Liang Y, Qi S, Lu Z, Song X, Jiang H et al (2014) PTEN antagonises Tcl1/hnRNPK‐mediated G6PD pre‐mRNA splicing which contributes to hepatocarcinogenesis. Gut 63: 1635–1647 [DOI] [PubMed] [Google Scholar]
- Hong X, Huang H, Qiu X, Ding Z, Feng X, Zhu Y, Zhuo H, Hou J, Zhao J, Cai W et al (2018) Targeting posttranslational modifications of RIOK1 inhibits the progression of colorectal and gastric cancers. Elife 7: e29511 [DOI] [PMC free article] [PubMed] [Google Scholar]
- Karigane D, Kobayashi H, Morikawa T, Ootomo Y, Sakai M, Nagamatsu G, Kubota Y, Goda N, Matsumoto M, Nishimura EK et al (2016) p38alpha activates purine metabolism to initiate hematopoietic stem/progenitor cell cycling in response to stress. Cell Stem Cell 19: 192–204 [DOI] [PubMed] [Google Scholar]
- Katchman BA, Chowell D, Wallstrom G, Vitonis AF, LaBaer J, Cramer DW, Anderson KS (2017) Autoantibody biomarkers for the detection of serous ovarian cancer. Gynecol Oncol 146: 129–136 [DOI] [PMC free article] [PubMed] [Google Scholar]
- Li J, Poulikakos PI, Dai Z, Testa JR, Callaway DJ, Bu Z (2007) Protein kinase C phosphorylation disrupts Na+/H+ exchanger regulatory factor 1 autoinhibition and promotes cystic fibrosis transmembrane conductance regulator macromolecular assembly. J Biol Chem 282: 27086–27099 [DOI] [PubMed] [Google Scholar]
- Li B, Li H, Bai Y, Kirschner‐Schwabe R, Yang JJ, Chen Y, Lu G, Tzoneva G, Ma X, Wu T et al (2015) Negative feedback‐defective PRPS1 mutants drive thiopurine resistance in relapsed childhood ALL. Nat Med 21: 563–571 [DOI] [PMC free article] [PubMed] [Google Scholar]
- Ma F, Zhu Y, Liu X, Zhou Q, Hong X, Qu C, Feng X, Zhang Y, Ding Q, Zhao J et al (2019) Dyrk3 loss activates the purine metabolism and promotes hepatocellular carcinoma progression. Hepatology 70: 1785–1803 [DOI] [PubMed] [Google Scholar]
- Manceau V, Kielkopf CL, Sobel A, Maucuer A (2008) Different requirements of the kinase and UHM domains of KIS for its nuclear localization and binding to splicing factors. J Mol Biol 381: 748–762 [DOI] [PMC free article] [PubMed] [Google Scholar]
- Matsuoka T, Yashiro M (2014) The role of PI3K/Akt/mTOR signaling in gastric carcinoma. Cancers 6: 1441–1463 [DOI] [PMC free article] [PubMed] [Google Scholar]
- Nishimura T, Nakata A, Chen X, Nishi K, Meguro‐Horike M, Sasaki S, Kita K, Horike SI, Saitoh K, Kato K et al (2019) Cancer stem‐like properties and gefitinib resistance are dependent on purine synthetic metabolism mediated by the mitochondrial enzyme MTHFD2. Oncogene 38: 2464–2481 [DOI] [PMC free article] [PubMed] [Google Scholar]
- Noto JM, Khizanishvili T, Chaturvedi R, Piazuelo MB, Romero‐Gallo J, Delgado AG, Khurana SS, Sierra JC, Krishna US, Suarez G et al (2013) Helicobacter pylori promotes the expression of Kruppel‐like factor 5, a mediator of carcinogenesis, in vitro and in vivo. PLoS ONE 8: e54344 [DOI] [PMC free article] [PubMed] [Google Scholar]
- Noto JM, Rose KL, Hachey AJ, Delgado AG, Romero‐Gallo J, Wroblewski LE, Schneider BG, Shah SC, Cover TL, Wilson KT et al (2019) Carcinogenic Helicobacter pylori strains selectively dysregulate the in vivo gastric proteome, which may be associated with stomach cancer progression. Mol Cell Proteomics 18: 352–371 [DOI] [PMC free article] [PubMed] [Google Scholar]
- Prieto‐Echagüe V, Gucwa A, Craddock BP, Brown DA, Miller WT (2010) Cancer‐associated mutations activate the nonreceptor tyrosine kinase Ack1. J Biol Chem 285: 10605–10615 [DOI] [PMC free article] [PubMed] [Google Scholar]
- Qu C, He L, Dong L, Zhu Y, Zhao Q, Jiang X, Chang P, Jiang X, Wang L, Zhang Y et al (2016) Salt‐inducible Kinase (SIK1) regulates HCC progression and WNT/beta‐catenin activation. J Hepatol 64: 1076–1089 [DOI] [PubMed] [Google Scholar]
- Selvarajah B, Azuelos I, Platé M, Guillotin D, Forty EJ, Contento G, Woodcock HV, Redding M, Taylor A, Brunori G et al (2019) mTORC1 amplifies the ATF4‐dependent de novo serine‐glycine pathway to supply glycine during TGF‐β1–induced collagen biosynthesis. Sci Signal 12: eaav3048 [DOI] [PMC free article] [PubMed] [Google Scholar]
- Song R, Song H, Liang Y, Yin D, Zhang H, Zheng T, Wang J, Lu Z, Song X, Pei T et al (2014) Reciprocal activation between ATPase inhibitory factor 1 and NF‐kappaB drives hepatocellular carcinoma angiogenesis and metastasis. Hepatology 60: 1659–1673 [DOI] [PubMed] [Google Scholar]
- Song H, Pu J, Wang L, Wu L, Xiao J, Liu Q, Chen J, Zhang M, Liu Y, Ni M et al (2015) ATG16L1 phosphorylation is oppositely regulated by CSNK2/casein kinase 2 and PPP1/protein phosphatase 1 which determines the fate of cardiomyocytes during hypoxia/reoxygenation. Autophagy 11: 1308–1325 [DOI] [PMC free article] [PubMed] [Google Scholar]
- Song H, Feng X, Zhang M, Jin X, Xu X, Wang L, Ding X, Luo Y, Lin F, Wu Q et al (2018) Crosstalk between lysine methylation and phosphorylation of ATG16L1 dictates the apoptosis of hypoxia/reoxygenation‐induced cardiomyocytes. Autophagy 14: 825–844 [DOI] [PMC free article] [PubMed] [Google Scholar]
- Soutto M, Chen Z, Katsha AM, Romero‐Gallo J, Krishna US, Piazuelo MB, Washington MK, Peek RM Jr, Belkhiri A, El‐Rifai WM (2015) Trefoil factor 1 expression suppresses Helicobacter pylori‐induced inflammation in gastric carcinogenesis. Cancer 121: 4348–4358 [DOI] [PMC free article] [PubMed] [Google Scholar]
- Sullivan LB, Gui DY, Vander Heiden MG (2016) Altered metabolite levels in cancer: implications for tumour biology and cancer therapy. Nat Rev Cancer 16: 680–693 [DOI] [PubMed] [Google Scholar]
- Wang H, Zhan M, Yang R, Shi Y, Liu Q, Wang J (2018) Elevated expression of NFE2L3 predicts the poor prognosis of pancreatic cancer patients. Cell Cycle 17: 2164–2174 [DOI] [PMC free article] [PubMed] [Google Scholar]
- Wroblewski LE, Peek RM Jr, Wilson KT (2010) Helicobacter pylori and gastric cancer: factors that modulate disease risk. Clin Microbiol Rev 23: 713–739 [DOI] [PMC free article] [PubMed] [Google Scholar]
- Yoshizawa T, Hinoi E, Jung DY, Kajimura D, Ferron M, Seo J, Graff JM, Kim JK, Karsenty G (2009) The transcription factor ATF4 regulates glucose metabolism in mice through its expression in osteoblasts. J Clin Invest 119: 2807–2817 [DOI] [PMC free article] [PubMed] [Google Scholar]
- Yusefi AR, Bagheri Lankarani K, Bastani P, Radinmanesh M, Kavosi Z (2018) Risk factors for gastric cancer: a systematic review. Asian Pac J Cancer Prev 19: 591–603 [DOI] [PMC free article] [PubMed] [Google Scholar]
- Zhu S, Soutto M, Chen Z, Peng D, Romero‐Gallo J, Krishna US, Belkhiri A, Washington MK, Peek R, El‐Rifai W (2017) Helicobacter pylori‐induced cell death is counteracted by NF‐kappaB‐mediated transcription of DARPP‐32. Gut 66: 761–762 [DOI] [PMC free article] [PubMed] [Google Scholar]
- Zhu Y, Qu C, Hong X, Jia Y, Lin M, Luo Y, Lin F, Xie X, Xie X, Huang J et al (2019) Trabid inhibits hepatocellular carcinoma growth and metastasis by cleaving RNF8‐induced K63 ubiquitination of Twist1. Cell Death Differ 26: 306–320 [DOI] [PMC free article] [PubMed] [Google Scholar]
Associated Data
This section collects any data citations, data availability statements, or supplementary materials included in this article.
Supplementary Materials
Appendix
Expanded View Figures PDF
Review Process File
Data Availability Statement
The mass spectrometry raw data included from this publication have been deposited to the ProteomeXchange Consortium (http://www.proteomexchange.org/) via the PRIDE partner repository and assigned the identifier PRIDE: PXD015693.


