Abstract
Theoretical models allow design of acoustic traps to manipulate objects with radiation force. Here, a model of the acoustic radiation force by an arbitrary beam on a solid object was validated against measurement. The lateral force in water of different acoustic beams was measured and calculated for spheres of different diameter (2-6 wavelengths λ in water) and composition. This is the first effort to validate a general model, to quantify the lateral force on a range of objects, and to electronically steer large or dense objects with a single-sided transducer. Vortex beams and two other beam shapes having a ring-shaped pressure field in the focal plane were synthesized in water by a 1.5-MHz, 256-element focused array. Spherical targets (glass, brass, ceramic, 2-6 mm dia.) were placed on an acoustically transparent plastic plate that was normal to the acoustic beam axis and rigidly attached to the array. Each sphere was trapped in the beam as the array with the attached plate was rotated until the bead fell from the acoustic trap because of gravity. Calculated and measured maximum obtained angles agreed on average to within 22%. The maximum lateral force occurred when the target diameter equaled the beam width; however, objects up to 40% larger than the beam width were trapped. The lateral force was comparable to the gravitation force on spheres up to 90 mg (0.0009 N) at beam powers on the order of 10 W. As a step toward manipulating objects, the beams were used to trap and electronically steer the spheres along a two-dimensional path.
I. INTRODUCTION
The 2018 Nobel Prize in Physics was awarded to Ashkin for his seminal work on optical tweezers [1,2] to trap and to move an object with a beam of light. To create this effect, a laser was focused on a transparent object that refracted the beam such that the net radiation force on the object pushed or pulled the object to a specific point in the beam. While early work used refraction as a primary means to produce trapping, radiation force can also be produced by scattering or absorption of the wave by the object. Optical tweezers have enabled manipulation of living cells [3,4] to measure cell properties and unfold DNA [5], as well as to trap atoms [6,7] in order to, for example, improve the accuracy of atomic clocks [8].
Similar to electromagnetic waves, acoustic waves can apply radiation forces [9–11] to trap and to manipulate objects. Moreover, as radiation force is proportional to the power of the wavefield incident on an object divided by the wave speed [12], radiation forces in acoustics are orders of magnitude larger than in optics. Acoustic traps are versatile; they can be employed in different media, such as air [13–15], and water [16,17] for a variety of applications, such as cell sorting [18,19] and targeted drug delivery [20]. Therefore, there is an increasing interest in understanding and expanding the conditions for which acoustic traps can be employed.
Here, we report the first experimental validation of a general theoretical model for designing acoustic tweezers, the first measurement of the lateral trapping forces from acoustic beams on a range of objects, and the first demonstration of electronically steering an object larger than the wavelength by such forces. Early theoretical work by Gor’kov [21] calculated the acoustic radiation forces on particles much smaller than the wavelength in a standing or travelling wavefield by calculating the scattered field. For small particles, Gor’kov recognized that the monopole and dipole terms that correspond to the compressibility and density of the object could accurately describe the scattered field, which is not the case for larger objects. Small particles have been experimentally trapped and manipulated in the pressure nodes of a standing wave generated by a transducer and a reflector [22–24] or multiple transducers facing each other [14].
Single-sided trapping has also been achieved. In single-sided trapping, multi-element arrays generate and steer acoustic beams by controlling the phasing between the array elements. Many theoretical studies have focused on using vortex beams [25–27], which are replicated experimentally by exciting the array elements with linearly increasing circumferential delays in order to generate an annular pressure field in the focal plane that can surround and trap objects. Calculations show an idealized, non-diffracting, vortex beam is theoretically capable of pushing, pulling [28,29], and trapping rigid [30] and elastic [31,32] spheres. Experimentally, vortex beams have been used to trap and pull small polystyrene spheres (190 μm, 0.3λ) in water while recording their motion to determine the axial radiation forces [17]. Beyond vortex beams, twin and bottle beams have been used experimentally to trap and to move an expanded-polystyrene sphere (1 mm, 0.12λ) in air [15]. Simultaneous traps have also been created by a single source to steer multiple particles independently of each other [33]. However, trapping and manipulation of particles in 3D space by a single-sided source have been limited to particles smaller than a wavelength.
Development and experimental validation of trapping objects equal to or larger than the wavelength have been limited to specific conditions. Successful levitation of a large expanded polystyrene sphere (50 mm, 3.6λ) in air was achieved by creating a standing wave between the sphere and a three-element source [34]. Similar to Ashkin’s work [1,2], a ray acoustics model was developed [35,36] to predict the trapping forces of a focused beam on spheres with a lower sound speed than the surrounding fluid, which is optically equivalent to an object with greater index of refraction than the medium. The model was experimentally tested in the pulling of lipid droplets radially along a transverse focal plate toward the acoustic axis (126 μm, 2.5λ) [37] and polystyrene microspheres (10 μm, 1.3λ) [38] in water. Most recently, successful trapping of a large expanded polystyrene sphere (16 mm, 1.85λ) in air using a vortex beam was demonstrated [39]. Although these studies have shown the feasibility of achieving control of large spheres in specific cases, a more general development and experimental verification of acoustic tweezers to manipulate large particles has not been performed.
Most theoretical solutions have been obtained for radiation forces on spheres in specific beams. The models in short come down to calculating the scattered field and then integrating over this field around the sphere to obtain the radiation forces. The scattered field and corresponding radiation forces have been calculated for idealized fields, such as, plane waves [10,40,41], or non-diffracting beams [42–46] including unfocused vortex beams [28–32]. Sapozhnikov and Bailey published the first modeling algorithm [47] (SB model) that resolved the acoustic radiation forces produced by an arbitrary acoustic field on a spherical elastic object of any size at any location in the field using an angular spectrum approach. Baresch et al. [48] and Jerome et al. [49] have developed similarly capable models. Baresch et al. derived similar solutions using spherical coordinates and reported agreement with the SB model in quantifying the radiation forces on spheres smaller than the wavelength [17]. Jerome et al. used Lagrangian coordinates [49], while the SB model uses Eulerian coordinates, and also reported agreement with SB model.
This paper reports on work to synthesize various acoustic beams in water and to use the SB model and measurement to quantify the lateral acoustic radiation forces on solid spherical targets of different composition and diameter. Furthermore, stable trapping and steering of these large targets is demonstrated towards a more general development of acoustic tweezers.
II. METHODS
A brief summary of the theoretical basis for the SB model is presented. The experimental setup for the measurement and validation of the lateral acoustic radiation forces is described. Lastly, details of the stable trapping and dynamic steering experiment are explained.
A. Theoretical model
In the SB model, the angular spectrum formulation is used to decompose the incident acoustic beam to a sum of plane waves. The net scattered field is found from the summation of the scattering of each plane wave from a spherical object using the classical expression for the spherical harmonic scattering [50,51]. The incident and scattered fields are summed and integrated over a spherical surface that surrounds the object in order to calculate the change in the wave momentum and resulting radiation force.
Wave attenuation and viscous effects are not included here. While attenuation of the acoustic wave can be accounted for in the SB model by using a complex wavevector k, attenuation loss for a plane wave passing a plate of the thickness and composition of the spheres in this study is less than 7% [52]. Viscous losses around targets are also negligible since the viscous boundary layer δ is smaller than λ by approximately four orders of magnitude (δ = 0.46 μm) [11]. While only spheres are used in this study, radiation force may be calculated for a non-spherical object following the same formalism with, for example, a finite element approach [53,54].
Figure 1 shows example calculations, where the axial FAz and lateral FAx components of the acoustic radiation force are calculated for two spheres of one composition but different radii at different radial positions.
FIG. 1.
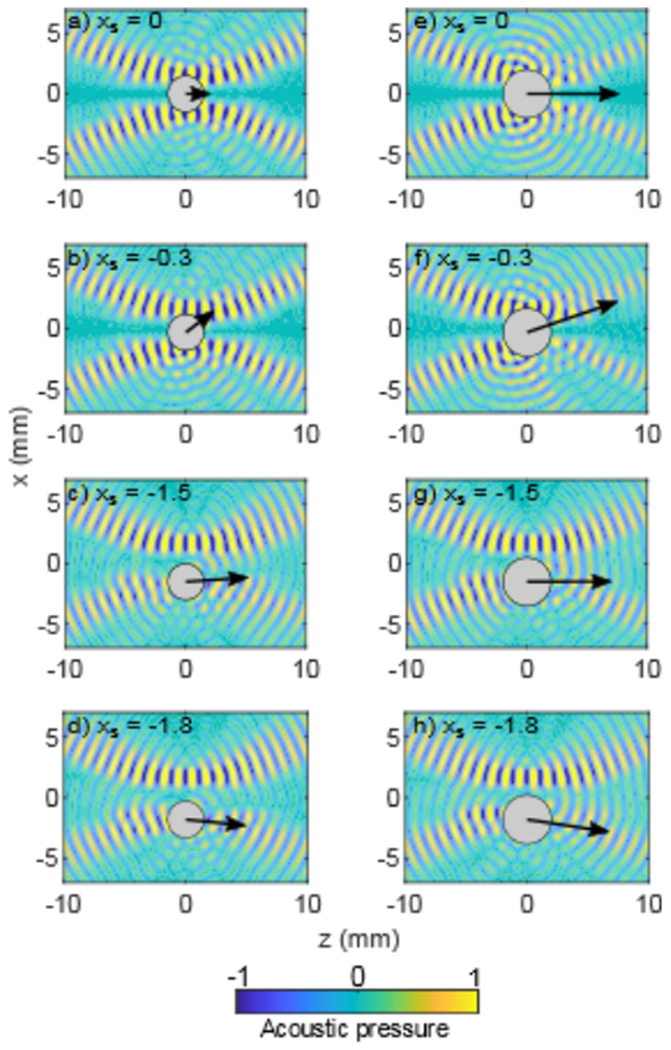
Simulation illustrating the acoustic radiation force from the same vortex beam on 3-mm (a-d) and 4-mm (e-h) diameter solid glass spheres located near the acoustic beam axis. The acoustic wave propagates from left to right in the z direction, and with the color pattern displays the distribution of the instantaneous pressure. The location of the center of the sphere is indicated by xs in mm. The arrow indicates the direction and magnitude of the acoustic radiation force, which comprises x and y components. Depending on the sphere’s radial location, the resulting acoustic force either restores the sphere toward the center of the beam as in (b & f) or pushes the sphere out of the beam as in (d & h).
B. Lateral force measurement
The transducer used in our experiments is a piezocomposite, 1.5-MHz, 256-element, focused array (Imasonic, Voray sur l’Ognon, France) [55] with the elements arranged in 16 spirals of 16 elements each. The diameter of each element is 7 mm with inter-element gaps of 0.5 mm. The transducer has a 12-cm radius of curvature, 15-cm aperture, and 4-cm diameter of the central opening. The face of the transducer is acoustically matched to water through a quarter-wavelength matching layer. The array elements have been electrically matched with inductors at 1.5 MHz and driven using a Verasonics Data Acquisition System (V1, Verasonics, LTD., Kirkland, WA), a research ultrasound engine with a 1200-W external power source (QPX600DP, Aim-TTI, Cambridgeshire, UK). Acoustic holography and a radiation force balance have been used previously to equalize the vibrational output for each element and to characterize the acoustic power and focal pressure of the array [56]. For reference, the maximum acoustic power used in any of our experiments was 12.8 W, the maximum peak pressure was 1.2 MPa, and the maximum spatial peak pulse-averaged intensity was 62 W/cm2.
Three different acoustic beams were generated by varying the phase of each element of the array. The beams were designed to create a null pressure region on the array axis in the focal plane surrounded by a ring or rings of pressure. The beams, named here ‘vortex’, ‘π-radial’, and ‘2π-radial’ beams, were synthesized as shown in Fig. 2. For the vortex beams, the phase increases linearly around the array’s azimuth angle to a maximum delay of 2πM, where M is an integer known as the topological charge. The magnitude of M controls the ring width, and the sign of M controls the wavefront helicity. The π- and 2π-radial beams were synthesized using an iterative angular spectrum approach (IASA) [57,58], where we input the desired ring-shaped pattern in the focal plane, and the IASA algorithm iteratively converged to a phase profile at the source that produced such a pattern, while for this work, maintaining uniform amplitude across the source surface. After a solution was found, the focal pressure distribution was back propagated [59] to determine the phase at the center of each element [56]. Unlike the vortex beams, where the phase changes with the array’s azimuth angle, for the π- and 2π-radial beams, the phase changes strictly in the radial direction. The π-radial beam is shown in the second row of Fig. 2 and has a single π phase shift along the radial direction. The 2π-radial beam is shown in the third row of Fig. 2 and has a two π phase shift along the radial direction.
FIG. 2.
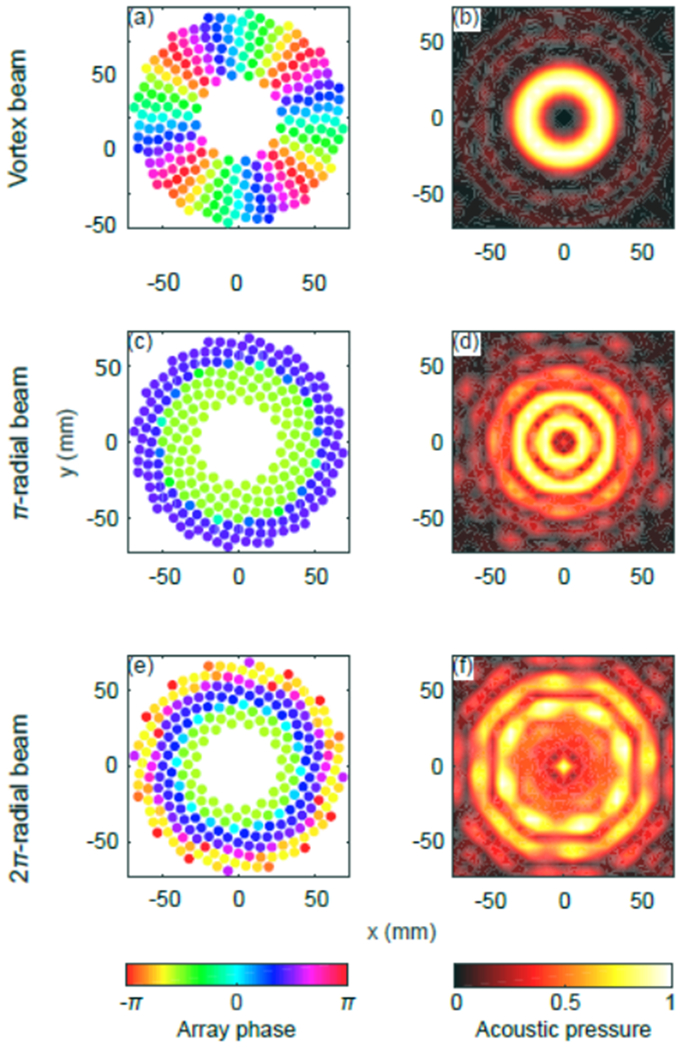
Three acoustic beam shapes used for trapping spherical beads: vortex (a-b), π-radial (c-d) and 2π-radial (e-f) beams. On the left, the phase of each element in the array is shown, and on the right the pressure field created on the transverse plane at the focus is shown. A vortex beam of M = 4 topological charge is shown here for illustration. The array phase of a vortex beam (a) has circumferential variation, while the array phase for the π-radial (c) and 2π-radial (e) beams varies along the radial direction. The normalized focal pressure (b, d, f) distribution in the xy-plane is shown for each case. Each beam creates in the focal plane a null and a ring of pressure with which to trap the sphere in the lateral direction while minimizing the axial radiation force.
The strength of the lateral acoustic radiation force of different beams was measured by placing spherical targets of different size and composition in the center of the beam as shown in Fig. 3. The spherical targets were placed on an acoustically transparent, flat, 6.4-mm, low-density polyethylene (LDPE) plate attached to the array by a frame. The frame-array combination was attached to a rotational stage and rotated slowly about the y-axis at a maximum speed of 1°/s or 4 mm/s. As the angle of rotation and slope of the platform increased, the sphere rolled outward from the beam axis towards a point of a higher lateral acoustic radiation force. The sphere was held off-axis by the total lateral force which included the lateral acoustic force as well as the added friction from a non-zero axial acoustic force FAz into the plate, Fig. 3. Further rotation increased the gravitational component along the plate until it overcame the lateral forces, and the sphere fell from the acoustic trap. The angle of maximum total lateral force θmax, at which the sphere fell, was recorded from measurements to each side and compared to calculations. The forces and θmax are related by the following force balance equation from Fig. 3:
| (1) |
where the component of the buoyant weight Fb of the sphere parallel to the plate pulls the sphere from the trap but is resisted by the friction force Fμ acting with FAx to hold the bead in place. The friction force is the product of the friction coefficient (measured as described below) and the normal force FN which is equal and opposite to the sum of FAz and the normal component of the buoyant weight of the sphere Fb to the plate at angle θ. Additionally, a 10-μm, anti-streaming membrane was placed 2-6 mm (depending on the sphere size) above the target sphere to prevent fluid flow caused by acoustic streaming from affecting the measurement. Additional measurements of the effect of anti-streaming membrane are reported in Appendix A. Additional hydrodynamic forces were negligible at such low rotational speeds. The Stokes drag force for a linear speed of 4 mm/s was calculated to be three orders of magnitude lower than the calculated lateral acoustic force [60] and was therefore neglected in all calculations.
FIG. 3.
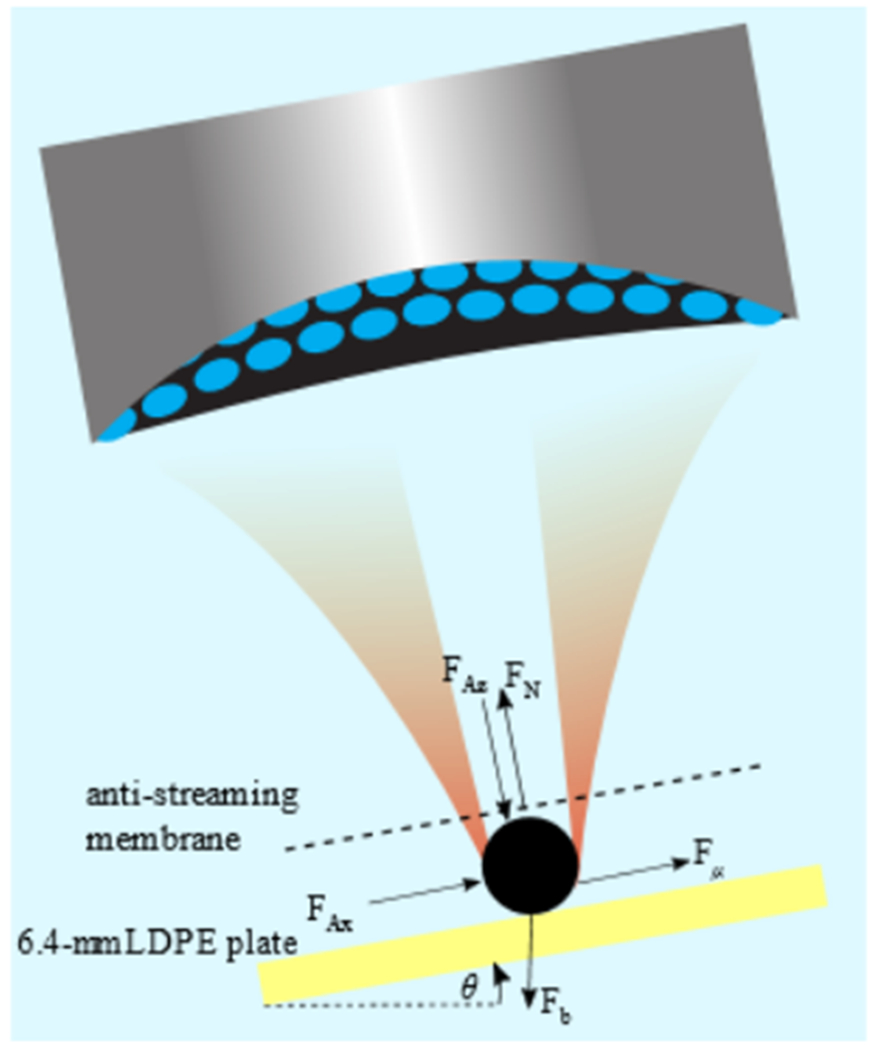
Experimental setup showing the rotation of the frame-array combination until the spherical target rolled off at the angle of maximum total lateral force θmax. The diagram represents the static equilibrium equation used to calculate the lateral acoustic radiation force from the measured angle θmax. The coordinate system rotated with the array such that the x-axis was parallel to the LDPE plate, and the z-axis coincided with the acoustic axis.
Solid spheres made of glass, brass, and ceramic with sizes 2 - 6 mm were tested. The nominal sizes and acoustic properties of the tested spheres are described in Table 1. The material properties in Table 1 were obtained from the suppliers (glass spheres from Propper Manufacturing Co., Inc., brass and ceramic from McMaster-Carr). Table 1 lists the elastic properties for each material type where ρs is the density of the sphere, and cl and ct are the longitudinal and shear wave speed in the material, respectively. For vortex beams, two M values were tested for each sphere with widths most near the beam diameter. However, since the beam width could not be adjusted for the π- and 2π-radial beams, only specific sphere diameters were tested. Since multiple sizes of the spheres were examined and tested under more than one trapping acoustic beam, results are presented as the ratio η of the sphere diameter to beam width which is defined by the diameter of peak intensity within the inner ring of the acoustic field in the transverse focal plane. The value of η varied from 0.7 to 1.4, where a larger η denotes a narrow beam with respect to the sphere’s diameter and vice versa.
Table I:
Physical characteristic of the spheres and the beam shapes used in the experiments.
| Material | Glass | Ceramic | Brass | ||||
|---|---|---|---|---|---|---|---|
| Elastic properties |
ρs = 2500 g/cm3 cl = 5448 m/s ct = 3264 m/s |
ρs = 3290 g/cm3 cl = 10851 m/s ct = 6091 m/s |
ρs = 8530 g/cm3 cl = 4842 m/s ct = 2166 m/s |
||||
| Diameter (mm) | 2 | 3 | 4 | 5 | 6 | 4.8 | |
| Beam shape | 2±, 3±, π-radial | 3±, 4± | 4±, 5±, 2π-radial | 5±, 6±, 2π-radial | 6±, 7± | 4±, 5± | |
The LDPE plate was well-matched to water with a measured power reflection coefficient less than 1% and therefore minimally interfered with the incident acoustic beam. The friction coefficient μ of the three different sphere materials on LDPE was measured by recording the maximum angle θμ at which each sphere fell without any acoustic exposure: the relation was μ = tan θμ. This assumes an idealized friction model where a geometrically perfect non-deformable sphere in contact with a perfectly non-deformable flat surface at a single point of contact will roll with the application of a tangential force, as rolling of the sphere was observed during experiments. The friction coefficient was measured 10 times for every sphere, 5 in each direction. The mean and standard deviation of μ for all spheres with the same composition were measured to be 0.059±0.024, 0.030±0.009, and 0.022 ±0.007 for glass, ceramic, and brass spheres. Using a μ measured for each individual sphere rather than for each composition might have improved precision and accuracy at the loss of generality, but this was not tested.
For each sphere, the acoustic power was varied to ensure that the sphere fell at an angle θmax between 20° and 80°. These variations were aimed to avoid uncertainty in force for smaller angles and null results when the bead did not fall at large angles. The acoustic power of the array was low enough to ensure negligible nonlinear acoustic propagation effects and minimal heating of the plastic. In all settings, the second harmonic amplitude was <1% of the fundamental amplitude. The output was pulsed, and the time-averaged acoustic power was 1.6 - 12.9 W, adjusted by changing the pulsing duty cycle (10-86%). Such low focal pressures relative to the intended use for which this array was designed [55] required that the minimum operating voltage was used, and power was adjusted by controlling the length of pulses to change the duty cycle. Since theory calculates forces from continuous acoustic waves, time-averaged values were used to account for pulsing in the experiment.
An alternating pulsing scheme was used to prevent the spheres trapped by vortex beams from spinning. Vortex beams have an angular momentum component [61–66] caused by their helical wavefront [26,61,67,68]. This angular momentum caused rotational instabilities leading to the ejection of spheres from the trap. Since the radiation force and torque are time-averaged quantities, the torque was eliminated by delivering two consecutive vortex pulses of equal duration with opposite helicity and the same topological charge magnitude (i.e. ± M) [39,69,70], which we denote as M±. The pulse duration was set to 661 μs, which is shorter than the minimum acceleration time, τ = I/8πa3 ρν, needed for a fully absorbing sphere to reach a terminal angular velocity due to drag torque, where I and a are the moment of inertia and radius of the sphere, and ν is the kinematic viscosity of the medium [39,64].
The measured angles and forces were compared to the calculated angles and forces. The angle was measured directly while the forces were calculated from the measured angles using Eq. (1). The axial acoustic radiation force FAz was found from simulation then scaled to match the applied acoustic power of the experiment by multiplying by the ratio of the time-average applied, acoustic power to the theoretical power. The linear relationship between acoustic power and radiation force was examined and verified as reported in Appendix B. The simulated acoustic radiation forces of each measurement were calculated based on the density of and sound speed in water, and the water temperature was maintained within 0.5°C. Reported measured angles were the average of 10 measurements: five rotations of the experiment in the clockwise direction and five in the counter-clockwise direction alternating. Measured data are shown as mean and standard deviation. The discrepancy between the measured and calculated values was determined using the following equation:
| (2) |
where χm and χth are the measured and theoretical quantities of interest.
C. Manipulation of objects
To demonstrate the stable positional control of large solid objects, a 5-mm glass sphere was steered along a preprogrammed, two-dimensional (2D) path on a flat, LDPE sheet positioned perpendicular to the beam axis. To dynamically steer the focus along a desired path, the phase delay on each element of the array was found by calculating the difference between the distance from the element center on the array’s surface and the desired location as referenced to the geometrical focus of the array. The element’s phase ϕ to synthesize and to steer an acoustic trap along a preprogrammed path was defined by superimposing the phase required to synthesize the trap on the phase delay to steer the focus. The 5-mm, glass sphere was trapped by an M± = 6 vortex and steered along a specified path with the preprogrammed phase of each element i defined at location p as follow:
| (3) |
where ϕi is the phase delay on element i, R is the radius of curvature of the array, xij is the xj-coordinate of element i, pj is the j-coordinate of point p along the desired steering path and k is the wave number. The sphere was steered along a 3-leaf polar path represented by the following equation:
| (4) |
where r0 = 13 mm, r is the radial distance in millimeters, and φ is the angular location in radians. The sphere was steered with an average speed of 6 mm/s. A camera was positioned with its viewing axis parallel to the acoustic axis to record the motion. The array was operating at 50% duty cycle with time-averaged acoustic power of 7.5 W. The desired path and the measured path of the sphere centroid were compared, and the difference reported as discrepancy in radial distance as defined in Eq. (2) above.
III. RESULTS AND DISCUSSION
A. Theoretical model
Simulation results for the lateral and axial acoustic radiation forces were used in the validation of the force measurements. Figure 4 shows the calculation of the acoustic radiation forces on a 4-mm, spherical, glass bead at all locations in the focal xy-plane by all three beams. The axial component of the acoustic radiation force FAz reaches a local minimum inside the acoustic ring. There is negligible acoustic radiation force in the y direction along the x-axis because of the averaging of the acoustic forces produced by +M and -M. The solid dot marks the location of the centroid of the sphere when we measure the maximum lateral acoustic force FAx. This location indicates the FAz value used in the friction calculation in Eq. (1). Beyond this location, the sphere falls.
FIG. 4:
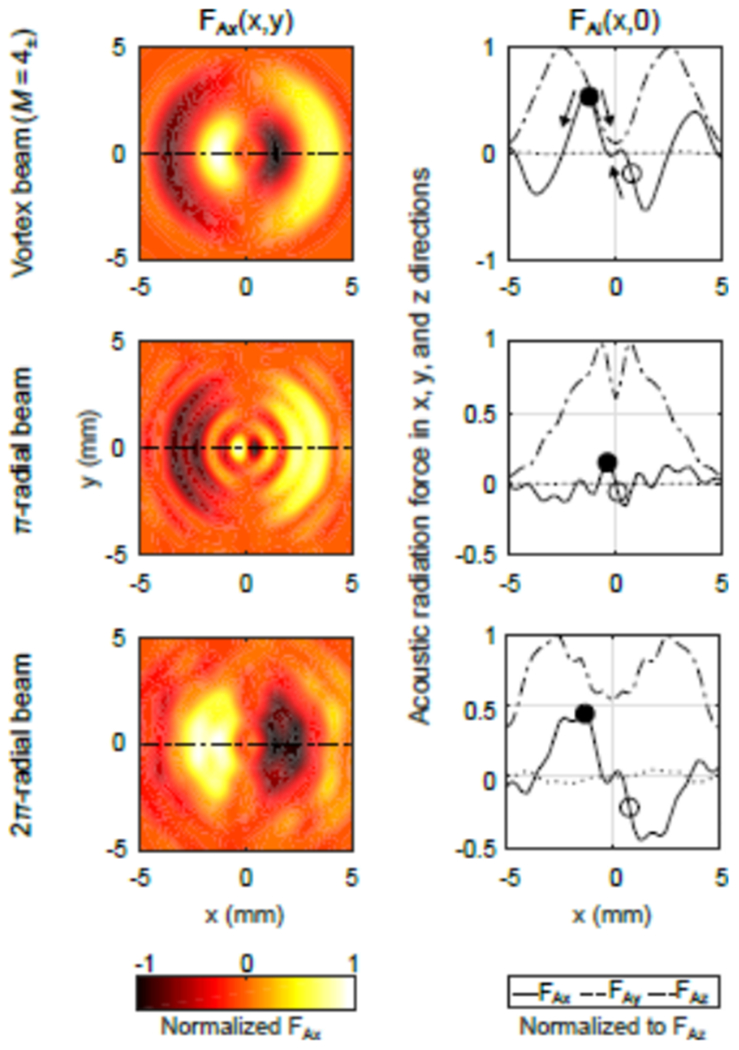
Simulation of the lateral acoustic radiation force FAx normalized to its maximum on a 4-mm glass bead throughout the focal xy-plane for the 3 beams (left column). FAx for a vortex beam (a) is the average of the force produced by alternating M = 4 & −4. Within the visible rings, all beams create a positive FAx (light color) on the left, which pushes the bead to the right, and a negative FAx on the right, which pushes the bead to the left. In the center without any asymmetry in other forces, the net lateral acoustic radiation force holds the sphere in place effectively trapping it. The right column displays the acoustic radiation forces FAx, FAy, and FAz normalized to the maximum FAz value at different sphere locations along the x-axis (the dashed line of the left column). The open and solid dots show centroid positions of the 4-mm sphere within the trap. With the rotation of the array-platform system, because of an increasing effect of gravity with slope, the sphere will roll from the location of the open dot to the location of the solid dot, which is the position of maximum lateral acoustic force that is pushing to the right in this case. Further increase in angle will cause the bead to fall from the trap.
B. Lateral force measurements
Measurements of the angle of maximum total lateral force θmax for the spherical beads of different size and composition were compared to the calculations found from the forces calculated with the SB model and Eq. (1). The plot in Fig. 5 compares calculated and experimental values of data pairs. Good agreement between measured and calculated θmax is found for multiple beams, bead sizes, and bead compositions (Fig. 5). The successful trapping of spheres that are 40% larger than the beam width (η = 1.4) was demonstrated.
FIG. 5.
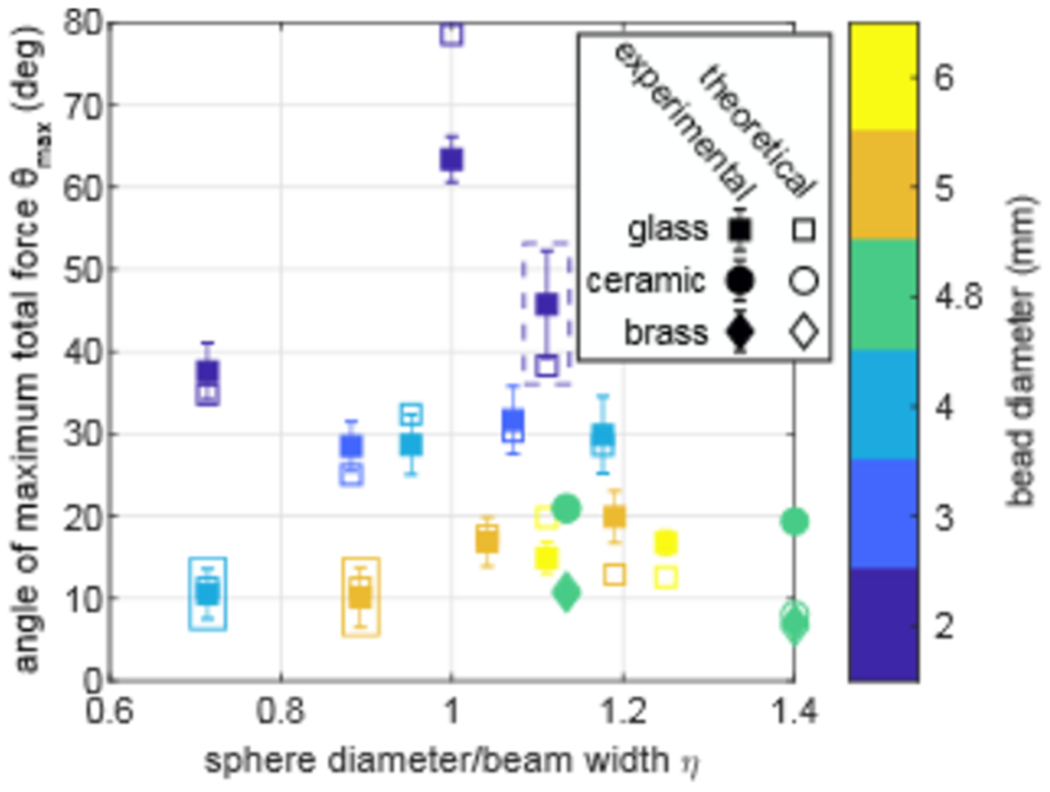
Comparison between the measured and calculated predicted angle θmax versus the ratio of sphere diameter to beam width η. Experimental data are the mean, and error bars show the standard deviation of ten replicate measurements. Close proximity of solid and open marks shows the good agreement between measurement and theory over a range of bead sizes and compositions. Different compositions are denoted by different data point shapes. Data point pairs within the dashed rectangle are for the π-radial beam and within the solid rectangle are for the 2π-radial beam, which both have a fixed beam width. Sphere diameters are shown by color, and M was adjusted to alter the beam width and create the η displayed. Overall calculations with the SB model compare well to measurement for different beams, sphere diameters, and sphere compositions.
Examination of Fig. 5 shows two cases of interest where theory and experiment diverged. First, theoretical prediction for the 2-mm, glass sphere at η = 1.0 was 14° larger than the measured angle. This translates to a discrepancy of 19.34% in θmax or 11.73% in FAx. This case had the lightest sphere, the lowest duty cycle (acoustic power), and the highest angle of 63°. We attribute the large discrepancy to the low duty cycle of 10.5% and hypothesize that the sphere moved between pulses under gravity. Under this condition, the sphere would fall approximately 0.55 mm (greater than half the radius) between pulses, which was sufficient to move the sphere from a stable to unstable position in the beam (see Appendix B for the values of duty cycle and time-averaged power used). Using pulses rather than continuous exposure may have affected other spheres to a lesser degree especially when the beam was narrow compared to the sphere diameter, and the sphere had only a short distance to escape the trap. However, the fact the discrepancy could be greater or less than measurement without any observed trend does not support a general effect of pulsing. The measurement with the 4.8-mm, ceramic sphere at η = 1.4 also diverges from the theoretical prediction and is described in more detail below.
The discrepancies between measurements and theoretical predictions were calculated according to Eq. (2) for each bead composition and size under the acoustic force of a specific beam. Discrepancies in angle θmax are potted versus the theoretical ratio of the total friction force, caused by buoyancy and FAz, to the maximum lateral acoustic force FAx in Fig. 6. Overall the average discrepancy was 21.8±32.4% in θmax and 32.8±58.1% in FAx. There is good agreement between measurement and theory, particularly when the ratio of Fμ/FAx was ≤ 0.6, where the average discrepancy was 10.2±7.2% in θmax and 11.7±8.3% in FAx. A potential source of discrepancy is the uncertainty with friction, which increased discrepancy as friction became a more significant component of the forces. A linear fit to the error has a slope of 76.6% / (Fμ/FAx) but a weak correlation of R2=0.46.
FIG. 6.
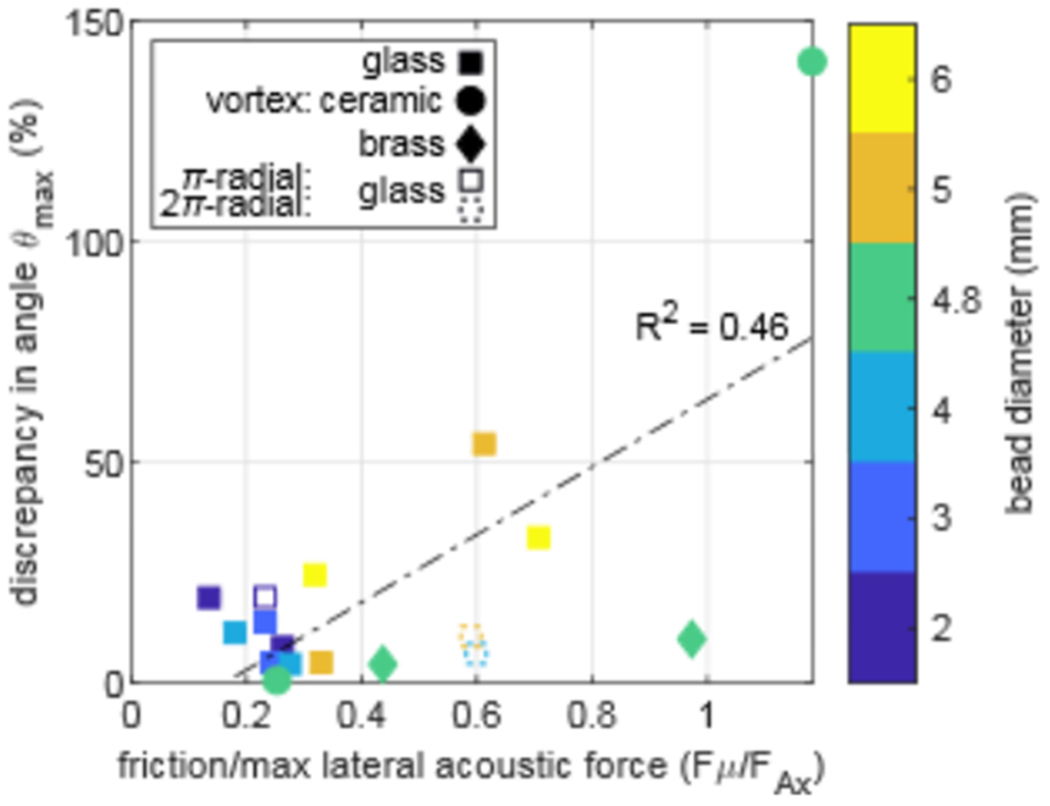
Discrepancy between calculated and measured angles plotted versus the ratio of friction to theoretical maximum lateral acoustic force. The discrepancy in angle is 21.8±32.4% on average, and agreement is good. There appears to be a correlation between the discrepancy, and the friction component suggesting the error in friction is a factor in the discrepancy although the correlation is weak.
The discrepancy between measurement and theory is small considering the uncertainties in μ, medium acoustic properties, sphere size and acoustic properties, and the variance in the acoustic power output of the array. For instance, the variation in the diameters of the spheres per the manufacturers’ specifications was between 5 and 10% for large to small spheres, respectively. The measured variations in water temperature of <1°C had negligible effect on the calculated FAx and θmax. Also, the driving electronics supplies power with a ±2.5% uncertainty in envelope. As discussed above, the simulation assumes a continuous acoustic exposure, and the array was operated by transmitting pulses. Appendix B shows the agreement in acoustic power between the experimental pulsed exposure and the equivalent simulated continuous exposure.
The lateral acoustic radiation force of varying vortex beams (different M±) for a given sphere diameter and composition was calculated directly with the SB model then compared to the lateral force calculated from the measured angle θmax with Eq. (1). Figure 7 shows the ratio of FAx from a 10-W beam to the weight of the sphere with buoyancy neglected, which is sphere mass m times the gravitational acceleration g. Each line connects calculations at discrete M±, while experimental values are shown at two different M± for each sphere. The maximum FAx occurred when the sphere diameter and beam width were equal, regardless of the material. In many cases, a vortex with a very small or large topological charge integer produced no trapping force in simulation, which is indicated by the absence of the continuity of the theoretical lines. At 10-W acoustic power, FAx is close to 3.5 times the weight of a 2-mm, glass sphere (a mass of 46 mg) and is on the order of the weight of the largest spheres in this study. The array and power supply can produce up to 1200 W, and as noted in the Methods, the lowest operating voltage setting was used and adjusted by further reducing the duty cycle. Thus, only a small fraction of the available power of the array was needed to create lateral force equal to the weight of the spheres.
FIG. 7.
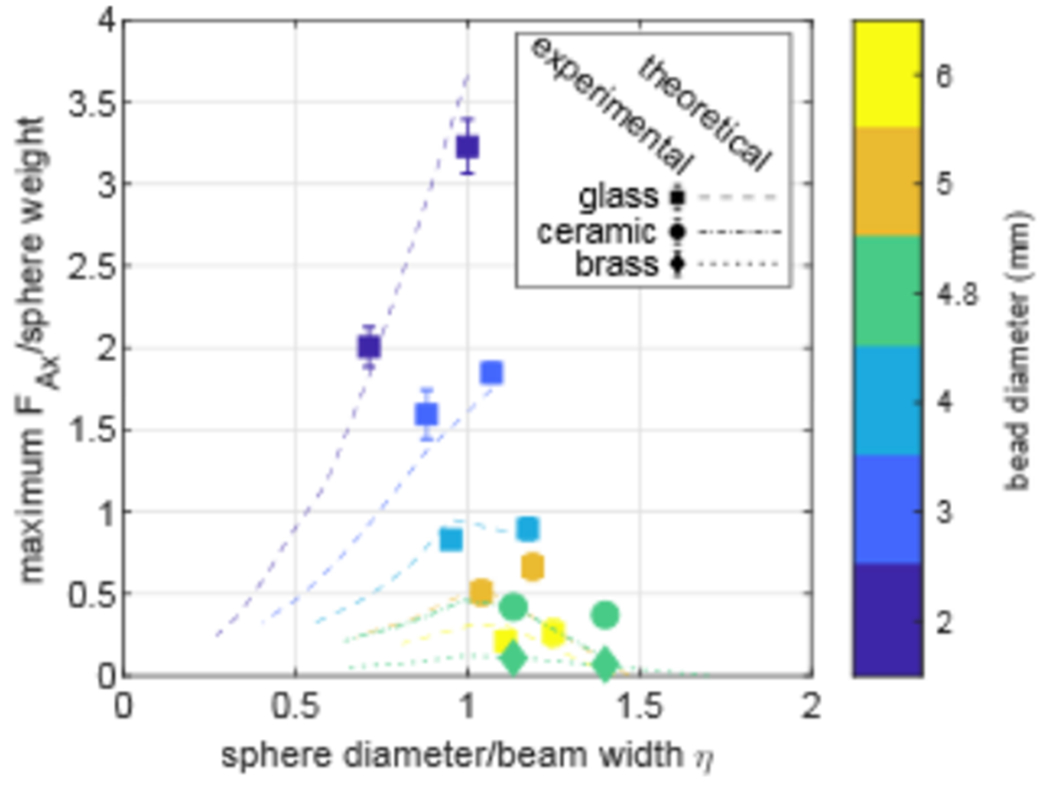
Ratio of maximum lateral acoustic force FAx to sphere weight in a 10-W vortex beam versus the ratio of sphere diameter to beam width η. Theoretical lines connect a few discrete values calculated for discrete values of M and therefore discrete beam widths for a specific sphere diameter and composition. Theoretical lines are also truncated where there was no lateral acoustic radiation force as the sphere was too large. Regardless of the sphere material, the most efficient trapping occurred at η close to 1.
A similar analysis to Figure 7 was carried out for the π-radial and 2π-radial beams at 10 W and shown in Fig. 8. Since these beams have a fixed width, only specific sphere diameters were used in the measurements as opposed to the vortex beams where M was changed to adjust the beam width to the sphere. For calculations in Fig. 8, the sphere diameter varied for each point, while the beam width remained constant. Figure 8 shows the lateral acoustic radiation force versus η. Generally, FAx follows the same trend in Fig. 7 where it is highest near η = 1, and vanishes as the sphere is much smaller or larger compared to beam width; however, because of the multiple ring structure, the behavior is more complex due to contribution from both rings. For the 2π-radial beam, where the inner ring was stronger than the outer ring, the highest acoustic force is centered around η = 1, as was the case for the vortex beam. For π-radial beam, where both rings were equal intensity, we see a bimodal behavior where the sphere was trapped by the ring closest to its diameter. Simulations show that 2.5 and 3 mm glass spheres are in a transition region as they are trapped by both rings, whereas a 2-mm sphere is trapped primarily by the inner ring, and a 3.5-mm sphere is trapped by the outer ring. The Supplemental Movie S1 [71] shows the simulation for the 2.5-mm sphere.
FIG. 8.
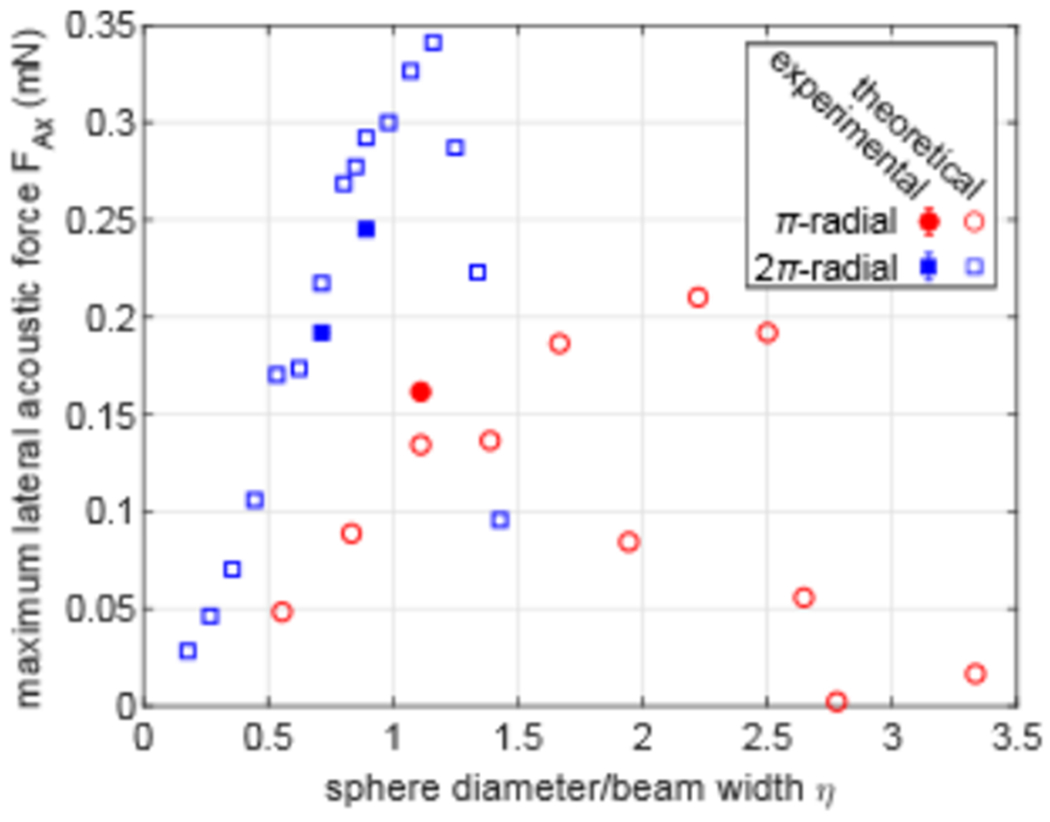
Maximum lateral acoustic force FAx of 10-W π and 2π radially-varying phase beams versus the ratio of the sphere diameter to beam width η. FAx diminishes for small or large η. The π-radial beam rings have the same acoustic intensity, and both can trap spheres as FAx reaches a maximum close to η = 1 and 2. The 2π-radial follows a smoother shape where maximum FAx is centered at η ≈ 1, since the inner ring has higher intensity and is the effective trapping ring.
C. Manipulation of objects
The use of a vortex beam to steer a large solid object was tested. Figure 9(a) shows superimposed select images from the Supplemental Movie S2 [71] of the red, 5-mm, glass sphere moving along the programmed path over a plane perpendicular to the acoustic axis. The measured locations of the center of the sphere from each frame of the movie of one complete path are plotted over the intended path in Fig. 9. Figure 9(c) shows the average discrepancy in radius between the measured and the intended paths at each position along the preprogrammed path. The maximum and overall mean errors from the intended path were 1.41% and 0.20±0.23% corresponding to a maximum and mean absolute difference of 0.58 mm and 0.15±0.010 mm. The largest deviation occurred at the outermost tip of each petal. Two factors may influence the discrepancy here: the tip of the petal caused the highest acceleration because of the curvature of the path, and the beam was weaker and less focused further off axis. Nevertheless, the mean absolute difference along the path was less than 1/5th of a wavelength.
FIG. 9.
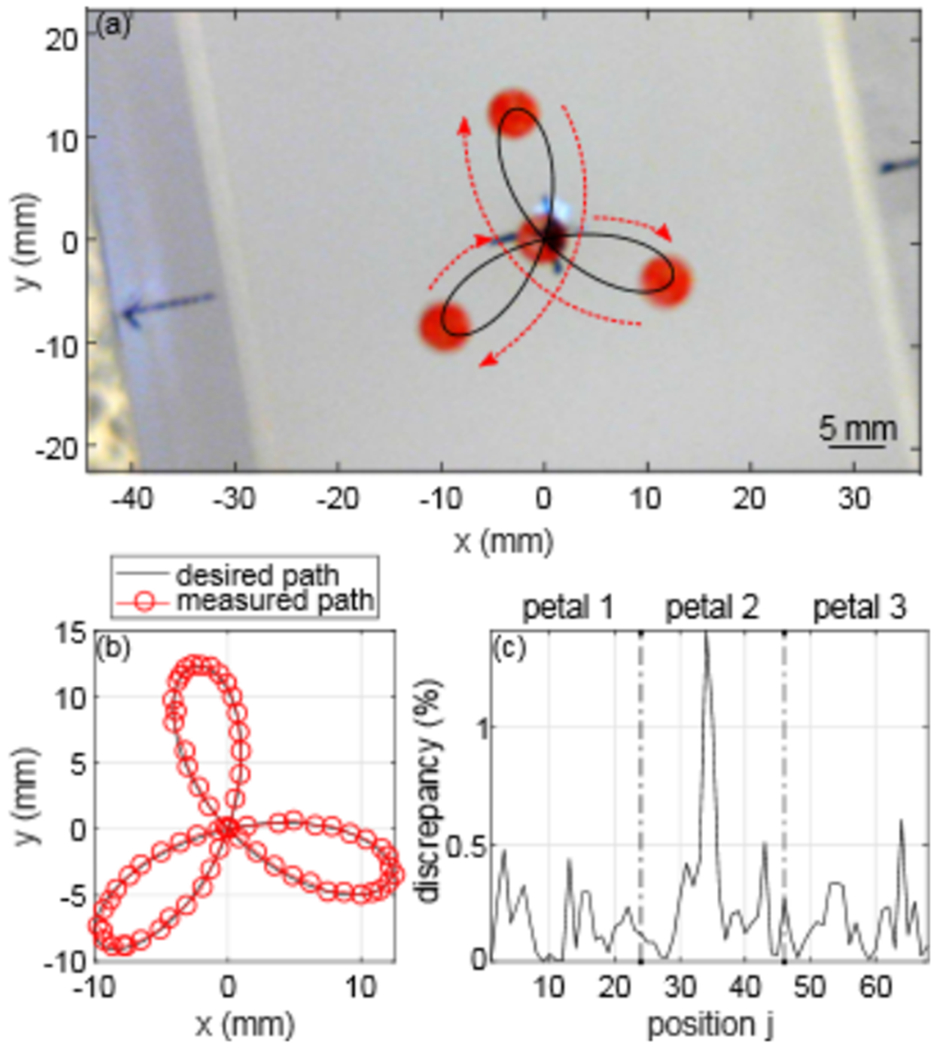
The trapping by an M = 6± vortex beam and dynamic steering of a 5-mm glass sphere (a) over a path defined by Eq. (4), where the bead starts at the center, then moves to the right and follows the red arrows around each petal and back to the center. Good agreement is shown in (b) between the theoretical path (black line) and measured path (shown as open dots drawn around the center of the sphere from every frame of the video). The discrepancy in radius is shown in (c) between the measured and intended motion plotted versus each programmed position of the path as defined in Eq. (4).
IV. CONCLUSTION
In this study, successful lateral trapping of dense elastic spheres ranging in sizes from 2λ to 6λ by different beams was demonstrated in water. The lateral trapping forces of vortex beams and two additional synthesized beams on large objects were measured. Capability of the beams to trap spheres 40% larger than the beam width was achieved by transmitting equal-duration vortex pulses of opposite helicity. An important metric for the trapping strength was defined as the geometric ratio of sphere diameter to beam width η. It was shown that maximum trapping strength occurred, for any sphere composition, when the value of η is close to unity. The lateral acoustic radiation force was on the order of the weight of the spheres used in this study for a 10-W acoustic beam. The measured lateral acoustic radiation forces were compared to the theoretical predictions, and good agreement was shown for different beams, sphere diameters, and sphere compositions. Acoustic steering of spheres on a flat surface was demonstrated in water with high accuracy. Quantitative verification of the theoretical model along with the experimental realization of acoustically induced lateral trapping and steering of objects on the same order of or larger than the wavelength and having arbitrary elastic properties, lays the groundwork for the development of acoustic manipulation of large objects for various physical, biological, and medical applications.
Supplementary Material
ACKNOWLEDGEMENTS
The authors would like to thank our collaborators at the Center for Industrial and Medical Ultrasound at the University of Washington. In particular, we would like to thank Bryan Cunitz for the help programming the Verasonics instrument, and Brian MacConaghy for the help in fabricating parts of the experiment. This work was supported by the National Institutes of Health NIDDK grants P01-DK043881 and K01-DK104854, NIBIB grant R01-EB007643, and RFBR 17-02-00261.
APPENDIX A: ACOUSTIC STREAMING
Acoustic streaming is the fluid motion caused by absorption of the wave momentum by the surrounding fluid. Streaming increases with acoustic power and uninterrupted propagation length through the fluid. The resulting fluid motion can affect the stability of the target and the force measurement. To ensure the accuracy of the force measurements, the influence of acoustic streaming was investigated at low- and high-power levels, and with and without an acoustically transparent barrier in place. A 5-mm, glass bead was trapped by an M = 6± vortex, then the angle of maximum total lateral force was measured for three configurations: no anti-streaming membrane, an elevated membrane positioned 2 cm above the sphere, and an anti-streaming membrane positioned 6 mm above the sphere. The three configurations were tested using low- and high-power levels of 3.3 and 8.7 W by increasing the pulse duration or duty cycle. Figure A1 shows θmax for each power level versus the three membrane configurations. A mean of the variance (ANOVA) test was used to compare the mean in θmax among the configurations at each power level. The test results yielded p-values of 0.89 and 0.93 at power levels of 3.3 and 8.7 W, which indicates there was no statistical difference among the configurations at each power level. Therefore, acoustic streaming had minimal effect on the accuracy of the measurements and the membrane was an unnecessary precaution.
FIG. A1.
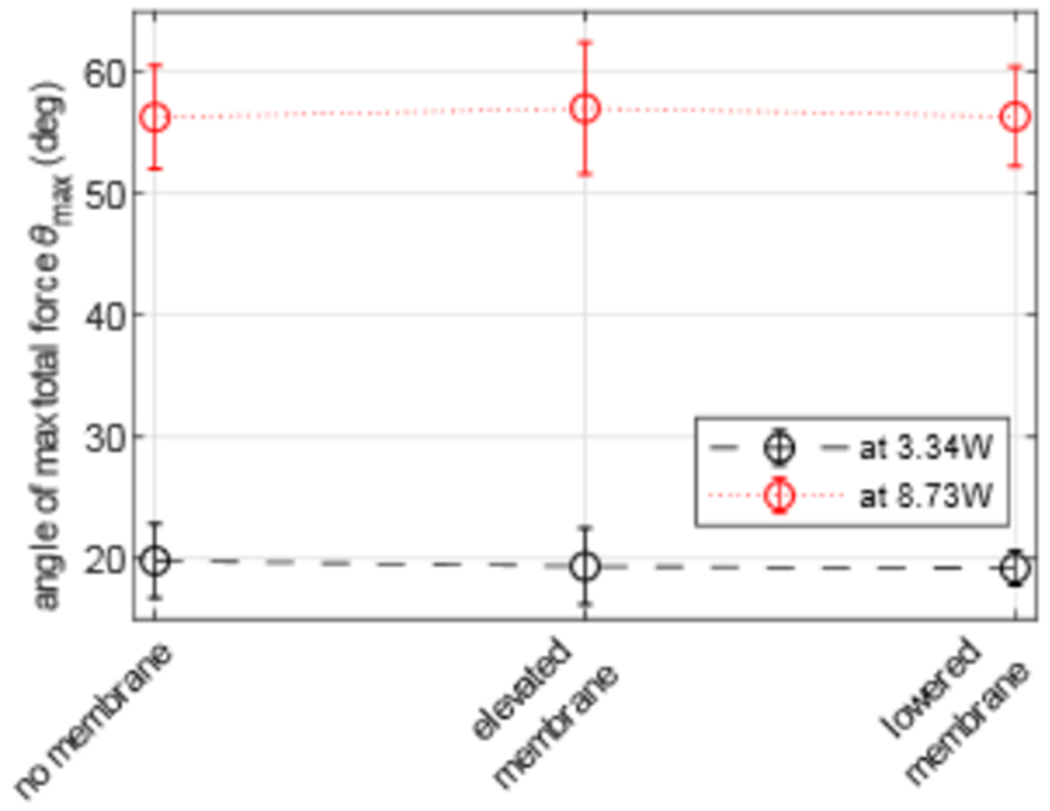
Effect of acoustic streaming on the lateral trapping force measurement at two different power levels of 3.3 and 8.7 W versus three different anti-streaming membrane configurations. The angle of maximum total lateral force for a 5-mm glass bead did not significantly vary among configurations at either power level, which demonstrates the absence of acoustic streaming effects in the measurements.
APPENDIX B: ACOUSTIC RADIATION FORCE LINEARITY WITH ACOUSTIC POWER
In the lateral force measurement experiment the time-averaged acoustic power used for every sphere was changed to ensure an angle of maximum total lateral force θmax between 20 and 80 degrees. Therefore, to control the acoustic power delivered, the duty cycle was tuned for each sphere as per Table BI.
Table BI:
The duty cycle and equivalent time-averaged acoustic power for each measurement point.
| Material | Glass | Ceramic | Brass | |||||||
|---|---|---|---|---|---|---|---|---|---|---|
| Diameter (mm) | 2 | 3 | 4 | 5 | 6 | 4.8 | 4.8 | |||
| Beam shape | 2±, 3± | π-radial | 3±, 4± | 4±, 5±, 2π-radial | 5±, 6± | 2π-radial | 6±, 7± | 4±, 5± | 5± | 5± |
| Duty cycle | 10.5% | 16.2% | 10.5% | 19.2% | 22.0% | 28.6% | 35.3% | 35.3% | 58.1% | 85.7% |
| time-averaged acoustic power | 1.6 | 2.4 | 1.6 | 2.9 | 3.3 | 4.3 | 5.3 | 5.3 | 8.7 | 12.9 |
Furthermore, theoretically, acoustic radiation force is linearly proportional to the acoustic power. For instance, the force acting on a fully absorbing target, FA = W/c [12], where FA is the acoustic radiation force, c is the speed of sound, and W is the acoustic power. A deviation from the linear relationship between the radiation force and acoustic power could serve as an indication of measurement artifacts (such as acoustic streaming, nonlinear effects in acoustic propagation, or incorrect measurement of the source power), which should be avoided. To verify the linear relationship and the scaling of the theoretical simulation to experimental results and vice versa based on the power ratio, a 5-mm, glass bead was trapped by an M = 6± vortex beam, and the angle of maximum total lateral force θmax was recorded as a function of power output from the array. By reordering of Eq. (1) and defining, similar to the approach in Ref [47], a non-dimensional coefficient γi, where is proportional to the acoustic force component FAi, Eq. (1) can be written as a function of W and γi as follow:
| (B1) |
When the acoustic power is zero in the experiment, there is a nonzero θmax due to friction. Therefore, the equilibrium equation was rearranged to be in the form of Eq. (B1) by subtracting μcosθ from the left-hand side in order to have a zero value at no acoustic exposure.
Experimental data points were acquired as θmax versus W, while the theoretical angle predictions were calculated using Eq. (1) at the same W for comparison. The experimental time-averaged power was used to compare the results to their corresponding theoretical acoustic power.
FIG. B1.
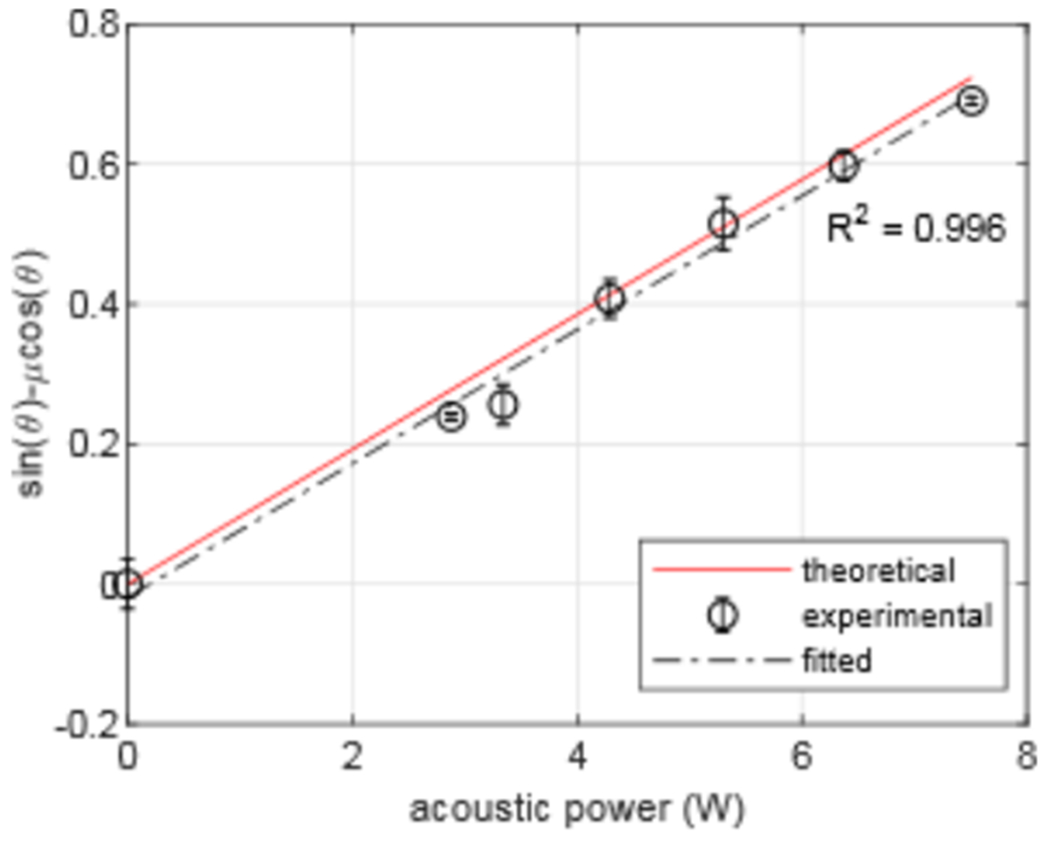
Relationship between the acoustic power W and nondimensionalized factor corresponding to the acoustic radiation forces represented in terms of the angle of maximum total lateral force. Experimental data [open circles with error bars indicating standard deviation (N = 10)] show agreement with theoretical (solid line) estimates of the angle of maximum total lateral force. A best-fit line (dashed line) with a high correlation coefficient of R2 = 0.996 indicates good linearity of the measured data points.
The theoretical line and experimental data points from Eq. (B1) are shown in Fig. B1 along with the best-fit line to the measured data. The best-fit line has slope of 0.0956 per watt and a strong correlation of R2 = 0.996. Therefore, the acoustic radiation force was linear in the range of the acoustic power applied and the time-averaged measured power was equivalent to the calculated estimate continuous power exposure.
REFERENCES
- [1].Ashkin A, Phys. Rev. Lett 24, 156 (1970). [Google Scholar]
- [2].Ashkin A, Dziedzic JM, Bjorkholm JE, and Chu S, Opt. Lett 11, 288 (1986). [DOI] [PubMed] [Google Scholar]
- [3].Ashkin A, Dziedzic JM, and Yamane T, Nature 330, 769 (1987). [DOI] [PubMed] [Google Scholar]
- [4].Jing P, Wu J, Liu GW, Keeler EG, Pun SH, and Lin LY, Sci. Rep 6, 1 (2016). [DOI] [PMC free article] [PubMed] [Google Scholar]
- [5].Wang MD, Yin H, Landick R, Gelles J, and Block SM, Biophys. J 72, 1335 (1997). [DOI] [PMC free article] [PubMed] [Google Scholar]
- [6].Chu S, Bjorkholm JE, Ashkin A, and Cable A, Phys. Rev. Lett 57, 314 (1986). [DOI] [PubMed] [Google Scholar]
- [7].Chu S, Science (80-. ). 253, 861 (1991). [DOI] [PubMed] [Google Scholar]
- [8].Ye J, Kimble HJ, and Katori H, Science (80-. ). 320, 1734 (2008). [DOI] [PubMed] [Google Scholar]
- [9].Rayleigh Lord, London, Edinburgh, Dublin. Philos. Mag. J. Sci 3, 338 (1902). [Google Scholar]
- [10].V King L, Proc. R. Soc. London. Ser. A - Math. Phys. Sci 147, 212 LP (1934). [Google Scholar]
- [11].Westervelt PJ, J. Acoust. Soc. Am 23, 312 (1951). [Google Scholar]
- [12].Westervelt PJ, J. Acoust. Soc. Am 26, 1 (1957). [Google Scholar]
- [13].Foresti D, Nabavi M, Klingauf M, Ferrari A, and Poulikakos D, Proc. Natl. Acad. Sci 110, 12549 (2013). [DOI] [PMC free article] [PubMed] [Google Scholar]
- [14].Ochiai Y, Hoshi T, and Rekimoto J, ACM Trans. Graph 33, Article 85 (2014). [Google Scholar]
- [15].Marzo A, Seah SA, Drinkwater BW, Sahoo DR, Long B, and Subramanian S, Nat. Commun 6, 8661 (2015). [DOI] [PMC free article] [PubMed] [Google Scholar]
- [16].Courtney CRP, Drinkwater BW, Demore CEM, Cochran S, Grinenko A, and Wilcox PD, Appl. Phys. Lett 102, (2013). [Google Scholar]
- [17].Baresch D, Thomas J, and Marchiano R, Phys. Rev. Lett 116, 1 (2016). [DOI] [PubMed] [Google Scholar]
- [18].Laurell T, Petersson F, and Nilsson A, Chem. Soc. Rev 36, 492 (2007). [DOI] [PubMed] [Google Scholar]
- [19].Ding X, Lin S-CS, Kiraly B, Yue H, Li S, Chiang I-K, Shi J, Benkovic SJ, and Huang TJ, Proc. Natl. Acad. Sci 109, 11105 (2012). [DOI] [PMC free article] [PubMed] [Google Scholar]
- [20].Shortencarier MJ, Dayton PA, Bloch SH, Schumann PA, Matsunaga TO, Ferrara KW, and Member S, IEEE Trans. Ultrason. Ferroelectr. Freq. Control 51, 822 (2004). [DOI] [PubMed] [Google Scholar]
- [21].Gor’kov LP, Sov. Phys 6, 315 (1962). [Google Scholar]
- [22].Glynne-Jones P, Démoré CEM, Ye C, Qiu Y, Cochran S, and Hill M, IEEE Trans. Ultrason. Ferroelectr. Freq. Control 59, 1258 (2012). [DOI] [PubMed] [Google Scholar]
- [23].Coakley WT, Bardsley DW, Grundy MA, Zamani F, and Clarke DJ, J. Chem. Technol. Biotechnol 44, 43 (1989). [Google Scholar]
- [24].Hawkes JJ, Barrow D, and Coakley WT, Ultrasonics 36, 925 (1998). [DOI] [PubMed] [Google Scholar]
- [25].Cain CA and Umemura S, IEEE Trans. Microw. Theory Tech 34, 542 (1986). [Google Scholar]
- [26].Hefner B and Marston P, J. Acoust. Soc. Am 106, 3313 (1999). [DOI] [PubMed] [Google Scholar]
- [27].Baresch D, Thomas JL, and Marchiano R, J. Appl. Phys 113, 1 (2013). [Google Scholar]
- [28].Marston PL, J. Acoust. Soc. Am 120, 3518 (2006). [DOI] [PubMed] [Google Scholar]
- [29].Marston PL, J. Acoust. Soc. Am 125, 3539 (2009). [DOI] [PubMed] [Google Scholar]
- [30].Mitri FG, IEEE Trans. Ultrason. Ferroelectr. Freq. Control 56, 1059 (2009). [DOI] [PubMed] [Google Scholar]
- [31].Marston PL, J. Acoust. Soc. Am 122, 3162 (2007). [DOI] [PubMed] [Google Scholar]
- [32].Mitri FG, Phys J. A Math. Theor 42, 245202 (2009). [Google Scholar]
- [33].Marzo A and Drinkwater BW, Proc. Natl. Acad. Sci 116, 84 (2018). [DOI] [PMC free article] [PubMed] [Google Scholar]
- [34].Andrade MAB, Pérez N, and Adamowski JC, Appl. Phys. Lett 106, 1 (2015). [Google Scholar]
- [35].Lee J, Ha K, and Shung KK, J. Acoust. Soc. Am 117, 3273 (2005). [DOI] [PubMed] [Google Scholar]
- [36].Lee J and Shung KK, J. Acoust. Soc. Am 120, 1084 (2006). [DOI] [PubMed] [Google Scholar]
- [37].Lee J, Teh SY, Lee A, Kim HH, Lee C, and Shung KK, Appl. Phys. Lett 95, 21 (2009). [DOI] [PMC free article] [PubMed] [Google Scholar]
- [38].Lam KH, Hsu HS, Li Y, Lee C, Lin A, Zhou Q, Kim ES, and Shung KK, Biotechnol. Bioeng 110, 881 (2013). [DOI] [PMC free article] [PubMed] [Google Scholar]
- [39].Marzo A, Caleap M, and Drinkwater BW, Phys. Rev. Lett 120, 44301 (2018). [DOI] [PubMed] [Google Scholar]
- [40].Maidanik G and Westervelt PJ, 29, 936 (1957). [Google Scholar]
- [41].Hasegawa T and Yosioka K, J. Acoust. Soc. Am 46, 1139 (1969). [Google Scholar]
- [42].Zhang L and Marston PL, Phys. Rev. E - Stat. Nonlinear, Soft Matter Phys 84, 1 (2011). [DOI] [PubMed] [Google Scholar]
- [43].Zhang L and Marston PL, J. Acoust. Soc. Am 131, EL329 (2012). [DOI] [PubMed] [Google Scholar]
- [44].Silva GT, IEEE Trans. Ultrason. Ferroelectr. Freq. Control 58, 298 (2011). [DOI] [PubMed] [Google Scholar]
- [45].Mitri FG and Silva GT, Wave Motion 48, 392 (2011). [Google Scholar]
- [46].Silva GT, Lopes JH, and Mitri FG, IEEE Trans. Ultrason. Ferroelectr. Freq. Control 60, 1207 (2013). [DOI] [PubMed] [Google Scholar]
- [47].Sapozhnikov OA and Bailey MR, J. Acoust. Soc. Am 133, 661 (2013). [DOI] [PMC free article] [PubMed] [Google Scholar]
- [48].Baresch D, Thomas J-L, and Marchiano R, J. Acoust. Soc. Am 133, 25 (2013). [DOI] [PubMed] [Google Scholar]
- [49].Jerome TS, Ilinskii YA, Zabolotskaya EA, and Hamilton MF, J. Acoust. Soc. Am 145, 36 (2019). [DOI] [PubMed] [Google Scholar]
- [50].Faran JJ, J. Acoust. Soc. Am 23, 405 (1951). [Google Scholar]
- [51].Hickling R, J. Acoust. Soc. Am 34, 1582 (1962). [Google Scholar]
- [52].Blackstock DT, Fundamentals of Physical Acoustics (John Wiley & Sons Inc., 2000). [Google Scholar]
- [53].Glynne-Jones P, Mishra PP, Boltryk RJ, and Hill M, J. Acoust. Soc. Am 133, 1885 (2013). [DOI] [PubMed] [Google Scholar]
- [54].Démoré CEM, Dahl PM, Yang Z, Glynne-Jones P, Melzer A, Cochran S, Macdonald M, and Spalding GC, Phys. Rev. Lett 112, 1 (2014). [DOI] [PubMed] [Google Scholar]
- [55].Khokhlova VA, Yuldashev PV, Rosnitskiy PB, Maxwell AD, Kreider W, Bailey MR, and Sapozhnikov OA, in Phys. Procedia (2016), pp. 132–138. [DOI] [PMC free article] [PubMed] [Google Scholar]
- [56].Ghanem MA, Maxwell AD, Kreider W, Cunitz BW, Khokhlova VA, Sapozhnikov OA, and Bailey MR, IEEE Trans. Ultrason. Ferroelectr. Freq. Control 65, 1618 (2018). [DOI] [PMC free article] [PubMed] [Google Scholar]
- [57].Melde K, Mark AG, Qiu T, and Fischer P, Nature 537, 518 (2016). [DOI] [PubMed] [Google Scholar]
- [58].Mellin SD and Nordin GP, Opt. Soc. Am 8, 1058 (2001). [Google Scholar]
- [59].Sapozhnikov OA, Tsysar SA, Khokhlova VA, and Kreider W, J. Acoust. Soc. Am 138, 1515 (2015). [DOI] [PMC free article] [PubMed] [Google Scholar]
- [60].Kundu PK and Cohen IM, Fluid Mechanics, 3rd ed (Elsevier Inc., 2004). [Google Scholar]
- [61].Marchiano R and Thomas J-L, Phys. Rev. E 71, 1 (2005). [Google Scholar]
- [62].Dashti PZ, Alhassen F, and Lee HP, Phys. Rev. Lett 96, 1 (2006). [DOI] [PubMed] [Google Scholar]
- [63].Lekner J, J. Acoust. Soc. Am 120, 3475 (2006). [DOI] [PubMed] [Google Scholar]
- [64].Zhang L and Marston PL, J. Acoust. Soc. Am 136, 2917 (2014). [DOI] [PubMed] [Google Scholar]
- [65].Skeldon KD, Wilson C, Edgar M, and Padgett J, New J. Phsyics 10, 1 (2008). [Google Scholar]
- [66].Hong Z, Zhang J, and Drinkwater BW, Phys. Rev. Lett 114, 1 (2015). [DOI] [PubMed] [Google Scholar]
- [67].Basistiy IV, Bazhenov VY, Soskin MS, and Vasnetsov MV, Opt. Commun 103, 422 (1993). [Google Scholar]
- [68].Freund I, Opt. Commun 159, 99 (1999). [Google Scholar]
- [69].Shi C, Dubois M, Wang Y, and Zhang X, Proc. Natl. Acad. Sci 114, 11 (2017). [DOI] [PMC free article] [PubMed] [Google Scholar]
- [70].Bollen V, Zartman DJ, Marston TM, and Marston PL, Proc. Meet. Acoust 19, 1 (2013). [Google Scholar]
- [71].See Supplemental Material at [insert URL] for simulations and multimedia files.
Associated Data
This section collects any data citations, data availability statements, or supplementary materials included in this article.


