

Abstract
Although multiple susceptibility loci for late-onset Alzheimer’s disease (LOAD) have been identified, a large portion of the genetic risk for this disease remains unexplained. LOAD risk may be associated with single-nucleotide polymorphisms responsible for changes in gene expression (eSNPs). To detect eSNPs associated with LOAD, we integrated data from LOAD genome-wide association studies and expression quantitative trait loci using Sherlock (a Bayesian statistical method). We identified a cis-regulatory eSNP (rs2927438) located on chromosome 19q13.32, for which subsequent analyses confirmed the association with both LOAD risk and the expression level of several nearby genes. Importantly, rs2927438 may represent an APOE-independent LOAD eSNP according to the weak linkage disequilibrium of rs2927438 with the 2 polymorphisms (rs7412 and rs429358) defining the APOE-ε2, -ε3, and -ε4 alleles. Furthermore, rs2927438 does not influence chromatin interaction events at the APOE locus or cis-regulation of APOE expression. Further exploratory analysis revealed that rs2927438 is significantly associated with tau levels in the cerebrospinal fluid. Our findings suggest that rs2927438 may confer APOE-independent risk for LOAD.
Keywords: Late-onset Alzheimer’s disease, 19q13.32, APOE, eQTL, Tau level
1. Introduction
Alzheimer’s disease (AD) is a neurodegenerative disease primarily affecting the elderly that manifests through memory and cognitive decline. The hallmark features of the disease include the accumulation of amyloid plaques, tau neurofibrillary tangles, and neuronal destruction, leading to brain atrophy. Currently, the processes leading to the formation of these neuronal lesions are not well understood (Small and Duff, 2008). Twin studies indicate that susceptibility alleles contribute as much as 79% to late-onset AD (LOAD) cases (Gatz et al., 2006), and genetic variance analyses estimate >53% of the variance in LOAD status can be explained by common variants with a minor allele frequency >1% (Ridge et al., 2016).
With the advance of genome-wide association studies (GWASs), more than 20 loci have been reliably associated with risk for LOAD (Escott-Price et al., 2014; Guerreiro et al., 2013; Harold et al., 2009; Hollingworth et al., 2011; Jonsson et al., 2013; Lambert et al., 2009, 2013; Naj et al., 2011; Seshadri et al., 2010; Sims et al., 2017). APOE on chromosome 19q13.32 showed the strongest and most consistent evidence for association with LOAD. The 2 single-nucleotide polymorphisms (SNPs) in APOE (rs429358, rs7412) are underlying the ε2, ε3, and ε4 alleles. However, these polymorphisms are not reliably detected in the genome-wide arrays due to high GC content, and its genotyping requires special conditions, which complicates the assessment of linkage disequilibrium (LD) structure of APOE region in GWASs (Ghani et al., 2015). The ε4 allele increases LOAD risk in a dose-dependent fashion (odds ratio (OR) = 3 for heterozygotes) and significantly lowers the age at onset (AAO), whereas the ε2 allele confers a protective benefit (Corder et al., 1993, 1994). Previous studies suggested that other genetic variability within the APOE locus may exist, such as modifiers of the level of expression of APOE alleles (Lambert et al., 1997).
Due to the strong impact of APOE, it is difficult to determine if additional loci on chromosome 19q13.32 also contribute to LOAD (Jun et al., 2012; Perez-Palma et al., 2014). Several SNPs located in this region have been shown to be associated with LOAD due to strong LD with the APOE locus (Hollingworth et al., 2011; Naj et al., 2011; Seshadri et al., 2010). In models adjusting for APOE ε4, no SNPs in the extended APOE region were significantly associated with LOAD (Jun et al., 2012). However, it is important to explore whether this genomic region contains functional APOE-independent variation(s) that also confer risk for LOAD.
Although multiple LOAD risk loci have been identified, the genes or DNA functional elements through which the risk variants of LOAD exert their effects on disease remain largely unknown. Accumulating evidence has demonstrated that changes in gene expression may play a key role in the pathogenesis of LOAD, and SNPs that influence LOAD risk may be responsible for changes in gene expression (Webster et al., 2009; Zou et al., 2010). Accordingly, recent studies have used integrative strategies to combine results from GWASs and expression quantitative trait loci (eQTL) data to identify novel potential risk genes (Ramasamy et al., 2014; Schadt et al., 2005). However, there is no study that systematically integrated eQTL data and GWASs of LOAD to identify functional risk variants (called eSNPs).
Here, we first used the Sherlock algorithm to integrate eQTL data from lymphoblastoid cell lines (LCLs) derived from peripheral blood samples (N = 400) (Dixon et al., 2007) as well as association data from a large GWAS for LOAD (Naj et al., 2011) and reported a novel risk eSNP, rs2927438, on chromosome 19q13.32, acting independently of APOE (Fig. 1). To further characterize the potential role of rs2927438 in LOAD etiology, we conducted follow-up analyses in independent gene expression and large-scale GWAS data sets. Moreover, we assessed the association between rs2927438 and several endophenotypes, including hippocampal volume, as well as Aβ42, tau and phosphorylated tau (ptau181) levels in the cerebrospinal fluid (CSF).
Fig. 1.
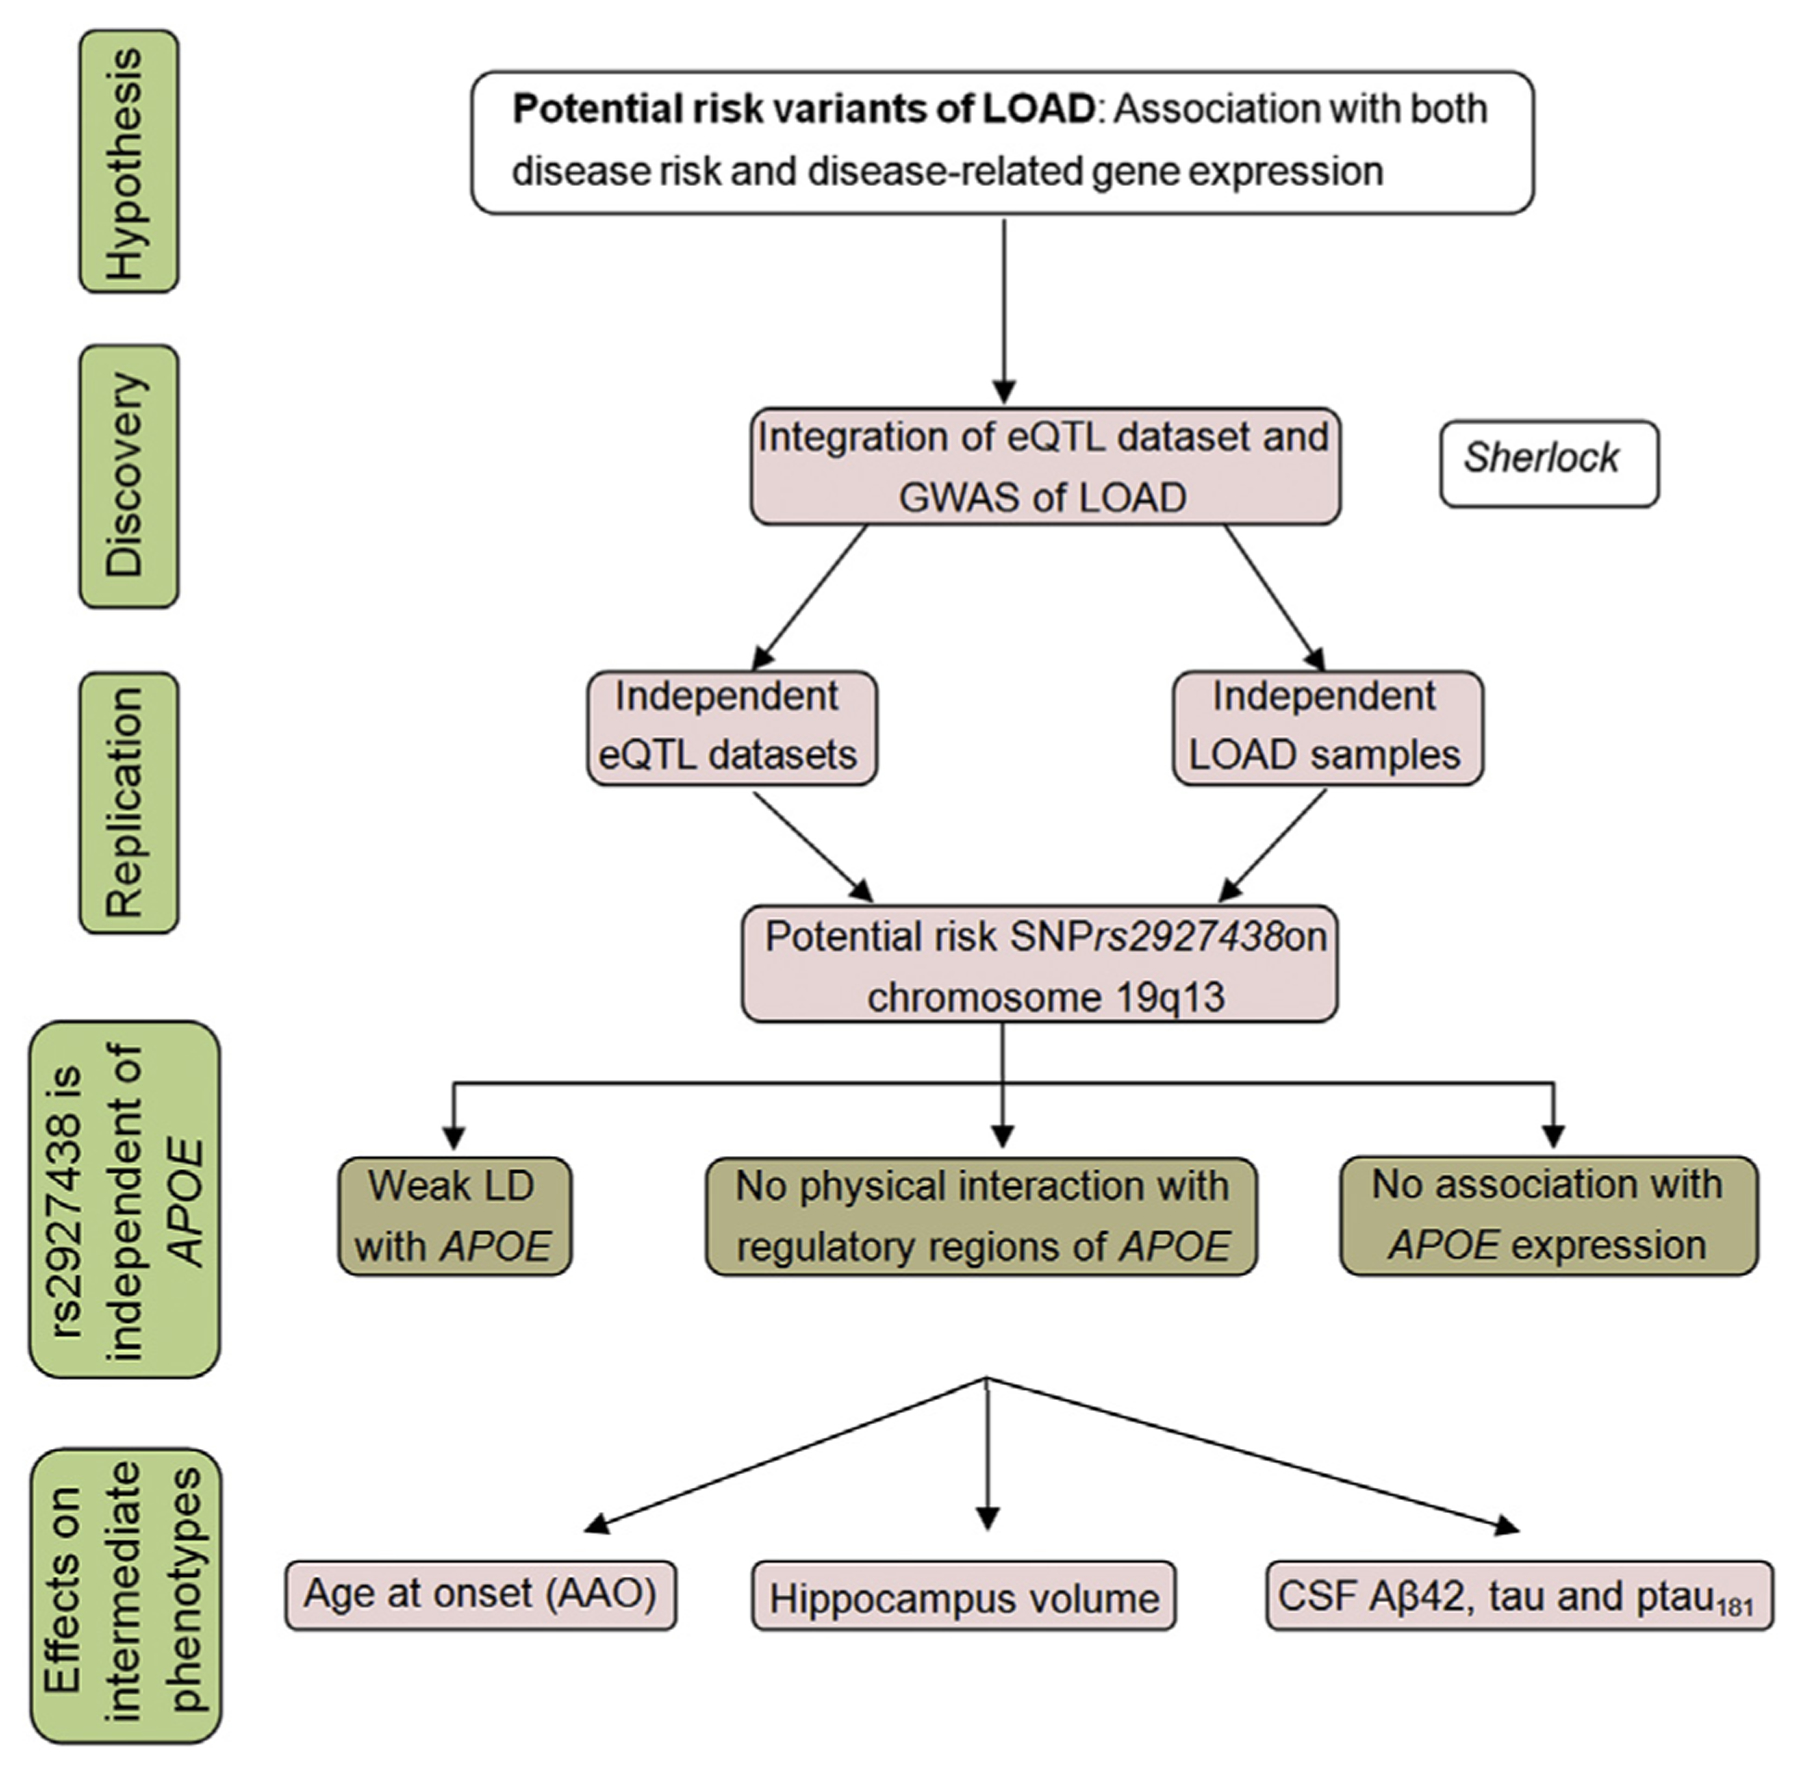
Overview of research strategy. The strategy is based on the hypothesis that there may be variants that affect LOAD risk by influencing gene expression, and such variants would be associated with both AD risk and gene expression levels. We systematically integrated LOAD GWAS and eQTL data with the Sherlock algorithm. The top signals identified by Sherlock were then replicated in independent LOAD and eQTL data sets. We also tested whether the positive risk SNP, rs2927438, modified LOAD risk independent of APOE ε4 status. Finally, we explored its association with several endophenotypes, including AAO of LOAD, hippocampal volume, and cognitive performance. Abbreviations: AAO, age at onset; AD, Alzheimer’s disease; eQTL, expression quantitative trait loci; LOAD, late-onset Alzheimer’s disease; GWAS, genome-wide association study; SNP, single-nucleotide polymorphism.
2. Methods
2.1. Sherlock integration analysis
To identify genes with expression changes potentially contributing to the etiology of LOAD, we integrated the eQTL of LCLs and GWAS data of LOAD using a Bayesian statistical framework, named Sherlock (http://sherlock.ucsf.edu/submit.html) (He et al., 2013). The statistical model and threshold setting can be found in the original article (He et al., 2013) and Supplementary materials.
2.2. Analysis of eQTL and LOAD GWAS data
The eQTL data set used in the discovery stage was reported previously (Dixon et al., 2007), which consisted of 400 LCL samples. More information about sample description, genotyping, transcriptome profiling, and statistical analyses can be found in the original article (Dixon et al., 2007).
The Alzheimer Disease Genetics Consortium (ADGC) reported a GWAS of LOAD investigating 2,046,563 SNPs using a 3-stage design consisting of a discovery stage and 2 replication stages, which identified 5 novel risk loci for LOAD (Naj et al., 2011). In the discovery stage, the ADGC performed a meta-analysis and/or joint analysis using data from 9 case-control cohorts, consisting of 8309 individuals with LOAD and 7366 cognitively normal age-/gendermatched controls. We used the summary statistics (p-values) from the discovery stage as input in our study.
2.3. The follow-up of eQTL and LOAD GWAS results
The following well-characterized expression data sets were used to validate the gene expression results that contributed to the identification of functional LOAD-related eSNPs: (1) SNPExpress data set (brain frontal cortex, N = 93; peripheral blood mononuclear cells [PBMC], N = 80) (Heinzen et al., 2008); (2) meta-analysis of blood eQTL by Westra et al. (N = 5311) (Westra et al., 2013); (3) GTEx data set (53 different tissues, including 12 brain tissues, N = 544) (GTEx-Consortium, 2015); (4) BrainCloud (dorsolateral prefrontal cortex, N = 261) (Colantuoni et al., 2011); and (5) Brain cortex data (Myers et al., 2007) (N = 193). Detailed information can be found in supplementary data and the original articles (Colantuoni et al., 2011; GTEx-Consortium, 2015; Heinzen et al., 2008; Myers et al., 2007; Westra et al., 2013). We used the largest reported GWAS meta-analysis of LOAD as a replication data set, which consisted of 17,008 cases and 37,154 controls (Lambert et al., 2013), including the ADGC data set used in our discovery stage. Detailed information on each data set, including diagnostic assessment, genotyping method, and quality control can be found in the original article (Lambert et al., 2013).
We conducted bioinformatics analyses, including functional prediction, and linkage analysis between the risk SNPs and rs429358 or rs7412 underlying the ε2, ε3, and ε4 APOE alleles. In addition, we analyzed the association of the risk eSNP with hippocampal volume, as well as CSF levels of Aβ42, tau, and ptau181. Detailed description of the methodology can be found in the supplementary methods.
3. Results
3.1. Integrative analyses of eQTL and LOAD GWAS
Sherlock integrated the eQTL of LCLs (N = 400) and GWAS data (2,046,563 SNPs) from 8309 LOAD cases and 7366 controls (Naj et al., 2011) using a Bayesian statistical framework, and identified 71,323 SNPs showing significant eQTL effects. After implementing genetic signature matching from eQTL data with patterns of association in the GWAS, we ranked potential LOAD risk genes according to their logarithm of Bayes factor (LBF) and p-value.
The integrative analysis yielded 10 candidate LOAD genes with both LBF scores >4.0 and p-value <1.0 E 04, which is the threshold applied in the original article (He et al.,2013) (Table 1). Among these genes, both bridging integrator 1 (BIN1) on chromosome 2q14.3 and biogenesis of lysosomal organelles complex 1 subunit 3 (BLOC1S3) on chromosome 19q13.32 have been associated with LOAD in previous GWAS and follow-up studies (Chapuis et al., 2013; Cruchaga et al., 2011; Seshadri et al., 2010). We therefore excluded these 2 genes from further analysis. The first-ranked gene was ZNF257 (ZNF257 zinc finger protein 257; LBF 5.23), which is located on chromosome 19p12. Intriguingly, 5 genes on chromosome 19q13 are influenced by the same eSNP (rs2927438) in a cis-regulatory manner: EML2 (echinoderm microtubule associated protein like 2; LBF = 5.17), ZNF226 (zinc finger protein 226; LBF = 5.00), PVRL2 (also known as NECTIN2, nectin cell adhesion molecule 2; LBF = 4.67); KLC3 (kinesin light chain 3; LBF = 4.61); and ZNF222 (zinc finger protein 222; LBF To = 4.56). the best of our knowledge, this SNP has never been reported in genetic association studies of LOAD. The remaining 2 genes, RFFL (ring finger and FYVE-like domain containing E3 ubiquitin protein ligase; LBF = 5.22) and LRRC46 (leucine-rich repeat containing 46 proteins; LBF = 4.80) are influenced by trans-eSNPs (rs4726618 and rs4838429 for RFFL; rs8103315 and rs7743515 for LRRC46).
Table 1.
Results of integrative analysis (Sherlock) of LOAD GWAS and eQTL
| Gene symbol | Gene LBFa | Gene P-valueb | Supporting SNP | Proximity | eQTL P-valuec | GWAS P-valued | SNP LBFe |
|---|---|---|---|---|---|---|---|
| ZNF257 | 5.23 | 2.59 E–05 | rs417628 | cis | 1.10 E–06 | 8.86 E–06 | 5.18 |
| RFFL | 5.22 | 2.59 E–05 | rs4726618 | trans | 6.40 E–07 | 8.94 E–06 | 5.95 |
| rs4838429 | trans | 1.00 E–05 | 3.13 E–03 | 0.76 | |||
| BIN1 | 5.18 | 2.59 E–05 | rs744373 | cis | 2.40 E–07 | 3.00 E–10 | 5.89 |
| EML2 | 5.17 | 2.59 E–05 | rs2927438 | cis | 1.10 E–04 | 1.05 E–07 | 5.73 |
| ZNF226 | 5.00 | 3.35 E–05 | rs2927438 | cis | 2.90 E–06 | 1.05 E–07 | 6.36 |
| LRRC46 | 4.80 | 5.02 E–05 | rs8103315 | trans | 5.80 E–06 | 3.46 E–11 | 4.63 |
| rs7743515 | trans | 5.20 E–06 | 5.97 E–03 | 0.86 | |||
| PVRL2 | 4.67 | 7.00 E–05 | rs2927438 | cis | 9.00 E–04 | 1.05 E–07 | 5.89 |
| BLOC1S3 | 4.61 | 8.06 E–05 | rs10416371 | cis | 5.00 E–05 | 7.80 E–08 | 5.12 |
| KLC3 | 4.61 | 8.06 E–05 | rs2927438 | cis | 2.00 E–04 | 1.05 E–07 | 5.24 |
| ZNF222 | 4.56 | 8.52 E–05 | rs2927438 | cis | 3.00 E–04 | 1.05 E–07 | 4.90 |
rs2927438 was shown in bold since it occurred 5 times without any threshold of significance.
Key: eQTL, expression quantitative trait loci; GWAS, genome-wide association study; LBF, logarithm of Bayes factor; LOAD, late-onset Alzheimer’s disease; SNP, single-nucleotide polymorphism.
Gene LBF (Log Bayes Factors for each gene) evaluates the possibility of the combined evidence from GWAS and eQTL supporting a gene being associated with LOAD. For each gene, Sherlock computes individual LBF for each eSNP in the alignment, and the sum of these constitutes the final LBF score for the gene.
p-value for each gene based on Sherlock integrative analysis. High LBFs tend to correlate with lower p-values.
p-value for eQTL SNP from the gene expression study.
p-value for eQTL SNP from the GWAS of LOAD.
SNP LBF, Log Bayes Factors for each SNP.
3.2. Replication of eQTL effects
Considering the many confounders in a single eQTL database, it is important to validate the eQTL associations in independent samples.
For the cis-eSNP rs417628, we were unable to validate its association with ZNF257 expression in the replication data set due to the absence of either the genotypic data for rs417628 or the expression data of ZNF257 (Supplementary table S1). Nevertheless, as demonstrated by a previous study (Puig et al., 2015), 1 breakpoint may disrupt the ZNF257 locus, causing a significant reduction in the total expression level of this gene in LCLs. We thus excluded the association of rs417628 with ZNF257 expression in further analysis. None of the trans-eQTL associations (RFFL and LRRC46) could be replicated (Supplementary table S1) and were also excluded from further study. Notably, trans-eQTL is more likely to reflect an indirect relationship of the SNP on gene expression. A gene’s trans perturbation may come from the mutation of a regulatory RNA, but this mutation may also affect multiple other genes. More importantly, trans-eQTL is usually much weaker than those in cis and suffers from greater multiple testing burden, resulting in lower replication across multiple studies (Cheung et al., 2010).
For rs2927438, we first validated its cis-regulatory effect on the abovementioned candidate genes in SNPExpress, which contains expression data from both brain frontal cortical tissues and PBMC samples (Heinzen et al., 2008). With the exception of EML2, the results confirmed the association of rs2927438 with the expression of ZNF226 (PBMC, p = 0.0084), PVRL2 (PBMC, p = 0.0024) KLC3,(p = 0.0037), and ZNF222 (a trend of association, p = 0.0795) (Fig. 2), with the risk A-allele predicting higher gene expression for ZNF226, PVRL2, and ZNF222 and lower expression for KLC3. In the brain cortical tissue, rs2927438 was not significantly associated with the expression of ZNF226, PVRL2, KLC3, ZNF222, and EML2 (Supplementary fig. S1). Using another peripheral blood eQTL data set (N = 5311) (Westra et al., 2013), we further validated the association of rs2927438 with PVRL2 mRNA levels (p = 3.66 E 05); again, the A-allele was associated with higher gene expression.
Fig. 2.
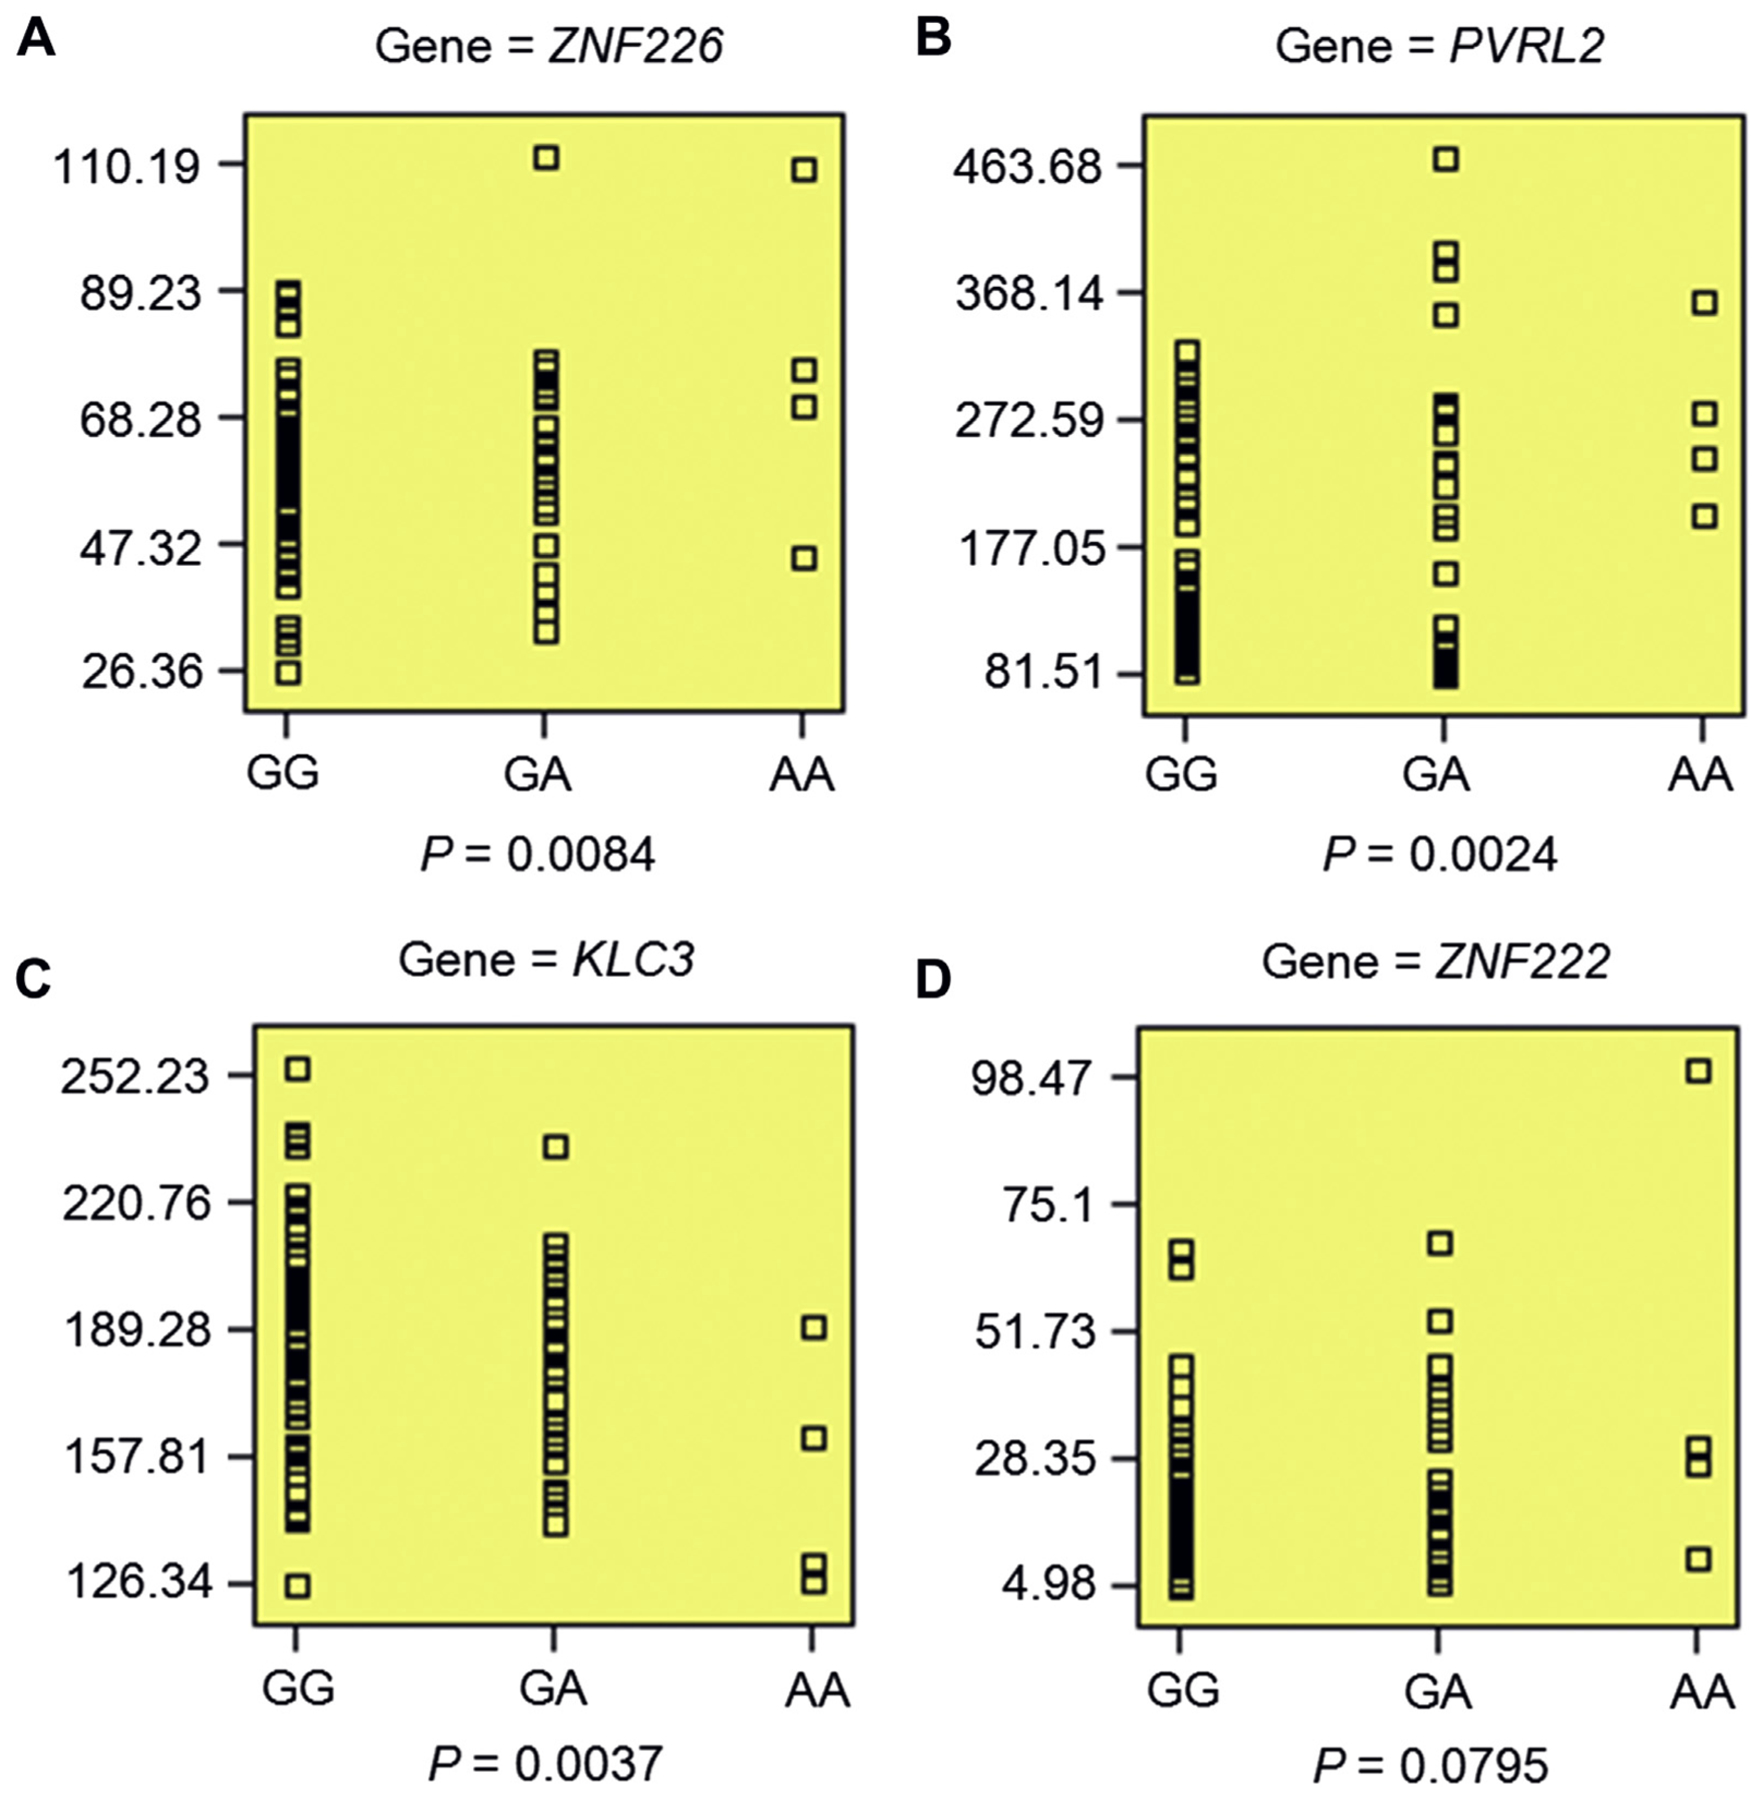
Validation of regulatory effect of rs2927438 on gene expression in PBMC. (A–D) rs2927438 showed significant association with the expression levels of ZNF226 (p = 0.0084), PVRL2 (p = 0.0024), and KLC3(p = 0.0037), as well as a trend of association with ZNF222 expression (p =0.0795). Individuals with an AA genotype had higher expression of ZNF226 (A), PVRL2 (B), and ZNF222 (D), but lower expression of KLC3 (C). Data were retrieved from SNPExpress (http://igm.cumc.columbia.edu/SNPExpress/; PBMC, N = 80) (Heinzen et al.,2008). Abbreviation: PBMC, peripheral blood mononuclear cells.
We also tested whether rs2927438 was associated with the expression of these 5 genes in 13 brain tissues using the GTEx database (GTEx-Consortium, 2015). As shown in Supplementary fig. S2, we observed significant association of rs2927438 with expression of PVRL2 in the accumbens (p = 0.033) and KLC3 in the hippocampus (p = 0.047), and a trend of association with EML2 in the caudate (p = 0.093). Collectively, these data provide strong evidence of the cis-regulatory function of rs2927438.
3.3. Replication of association between rs2927438 and LOAD risk
Similar to our validation of the eQTL results, we attempted to validate the association of rs2927438 with LOAD. Using the largest GWAS meta-analysis of LOAD (17,008 cases and 37,154 controls, partially overlapping with the ADGC discovery data set) (Lambert et al., 2013), we observed significant association between the A-allele of rs2927438 and increased risk of LOAD (p = 5.69 E – 29, OR = 1.236). It might be an authentic LOAD variant because the increase in sample size of the replication cohort generated a much more significant result (p = 5.69 E – 29) than the smaller discovery data set (p = 1.05 E – 07). Of note, the original study did not report this SNP because all SNPs within/flanking the APOE locus were excluded due to the common presumption that the association signal in this region is APOE dependent (Lambert et al., 2013). In contrast, our LD analyses discussed below revealed that the association of LOAD with rs2927438 is likely APOE independent (Supplementary table S2).
3.4. Pleiotropic analyses for rs2927438
We explored whether rs2927438 is also associated with other human traits. A query of the National Human Genome Research Institute-European Bioinformatics Institute (NHGRI-EBI) catalog of published GWASs for rs2927438 revealed that the only entry listed was a suggestive GWAS signal for the increased risk of Barrett’s esophagus and esophageal adenocarcinoma (combined) with the G-allele of rs2927438 (p = 2.0 E – 06, OR = 1.16, 95% confidence interval = 1.10—1.25) (Levine et al., 2013). In contrast, LOAD risk was associated with the A-allele.
We further tested whether rs2927438 showed any association with the expression of nearby genes in the esophagus. Based on the expression data from the GTEx, we found significant association for rs2927438 with PVRL2 expression (p = 0.021) and marginal association with EML2 expression (p = 0.055) in esophagus muscularis (Supplementary fig. S3). Again, the G-allele predicted higher expression for both EML2 and PVRL2.
3.5. rs2927438 represents an APOE-independent risk locus of LOAD on 19q13.32
Because rs2927438 maps to an LD region on chromosome 19q13.32 significantly associated with LOAD, and is located ~ 170 kb upstream of APOE, we tested whether the observed association of rs2927438 with LOAD was APOE dependent. First, we checked whether rs2927438 was in LD with the 2 SNPs responsible for the APOE ε2, ε3, and ε4 alleles (rs429358 and rs7412) according to population data from the 1000 Genomes Project (phase 3). Haploview analyses of SNPs within a 300-kb region encompassing rs2927438 and the 2 APOE SNPs (Supplementary table S2) showed weak LD of rs2927438 with both rs429358 and rs7412 in all 26 different subpopulations of European, African, Admixed-American, East Asian, and South Asian background (r2 ≤ 0.07 and logarithm of the odds (LOD) score < 1.5). Second, we explored whether there is a chromatin interaction between the genomic region containing rs2927438 and APOE using published data (Dixon et al., 2012) because recent studies showed that chromatin interactions play an important role in regulating gene expression (Pope et al., 2014). When using rs2927438 as bait, potential chromatin interactions (topologically associated domains) were observed only between rs2927438 and a 100-kb genomic region not affecting APOE (Supplementary figs. S4 and S5). Third, we tested whether APOE expression was affected by rs2927438 genotype in both blood and brain tissue. No significant association between rs2927438 and APOE expression was observed in any of the expression data sets (Supplementary table S3). Taken together, these lines of evidence strongly suggest that rs2927438 may confer risk for LOAD independent of APOE.
3.6. Effect of rs2927438 on AAO of LOAD, hippocampal volume, Aβ42, tau and ptau181 levels
We investigated if there have been any reports on the relationship between rs2927438 and AAO of LOAD. Interestingly, the protective G-allele of this SNP revealed significant association with delayed AD onset (p = 1.39 E – 12), according to a genome-wide survival analysis of 14,046 AD cases and 25,849 controls (Huang et al., 2017). Furthermore, there was a report of an association between rs2927438 and human hippocampal volume, which may modify risk for developing LOAD (Apostolova et al., 2006). Using the ENIGMA 2 data set (N = 33,536) (Hibar et al., 2017), we also observed a trend of association between the A-allele of rs2927438 and a smaller hippocampal volume (p = 0.107, β = – 1.61), consistent with previous observations of hippocampal atrophy in LOAD patients (Supplementary table S4).
Genetic variants that increase risk for LOAD could also modify Aβ42, tau and ptau181 levels in the CSF, which are used as endophenotypes of LOAD (Deming et al., 2017). Hence, we tested whether rs2927438 was associated with Aβ42, tau and ptau181 levels in the CSF using published samples (N = 3146) (Deming et al., 2017). Significant association was observed only between rs2927438 and tau levels (β = 0.015, p = 0.037), with the risk A-allele showing higher CSF tau levels (Supplementary table S5).
4. Discussion
Given that most of the identified LOAD risk variants are located in noncoding regions, it is likely that they alter the expression of AD-associated loci. The present study systematically integrated eQTL data from LCLs and large LOAD GWAS (Naj et al., 2011) and identified a cis-eSNP (rs2927438) significantly associated with both LOAD risk and expression of several adjacent genes. Notably, our study revealed that rs2927438 is genome-wide significant in the largest LOAD GWAS, which was not reported due to its proximity to APOE (Lambert et al., 2013). To the best of our knowledge, the candidate genes whose expression was affected by rs2927438, including ZNF226, KLC3, and ZNF222, have not been reported in LOAD, except for 1 risk SNP (rs6857) in PVRL2 (Logue et al., 2011).
Results from several genome-wide studies of AD have consistently demonstrated linkage to chromosome 19q13, a region including the APOE locus (Blacker et al., 2003; Sillen et al., 2006). In addition to variants in APOE, several other SNPs on chromosome 19q13 also exhibited significant association with LOAD, that is, rs6859 in PVRL2 (Carrasquillo et al., 2009), rs4420638 in APOC1 (Li et al., 2008), rs59007384 and rs10524523 (poly-T polymorphism) in TOMM40 (Cervantes et al., 2011; Roses et al., 2010). The risk region around the APOE locus may be explained either by the strong LD with the APOE ε4 allele (Jun et al., 2012) or genetic variations in regulatory regions affecting APOE expression. However, this may not be the case for rs2927438, which showed weak LD with APOE across all 26 subpopulations available at the 1000 Genomes Project. Furthermore, no significant association between rs2927438 and APOE expression was observed in either blood or brain tissue across different data sets. Moreover, there were no chromatin interactions between the genomic region containing rs2927438 and the promoter or enhancer region of APOE according to Hi-C chromatin interaction analysis.
In this study, we used the eQTL effect in blood-derived LCLs, which is not ideal as a proxy for the eQTL effect in the brain (Nica et al., 2011; Ramasamy et al., 2014). However, we gain power for genes that are ubiquitously expressed because of the use of a relatively large data set for eQTL analysis in LCLs (N = 400) (Dixon et al., 2007) compared with the available brain eQTL data set (N = 193 cortical tissues) (Myers et al., 2007). In addition, the number of eSNPs (N = 71,732) for the blood-derived samples was much larger than that for cortical brain tissue (N = 21,940), which can greatly increase power of candidate gene identification. Also, the specific tissue or cell type relevant to a trait or disease is often unknown. For AD, neurons in the brain are seemingly the most relevant cell type; however, several studies have highlighted the involvement of microglia, which originate from peripheral monocytes (El Khoury et al., 2007). Recent genetic and molecular studies have also indicated crucial roles for peripheral monocytes in AD pathogenesis (Tajuddin et al., 2016), and LOAD risk alleles are polarized for cis-eQTL effects in monocytes (Raj et al., 2014). Finally, eQTLs were inconsistently observed even among data sets focusing on the same brain tissue (McKenzie et al., 2014). For example, in 2 studies examining the prefrontal cortex (Colantuoni et al., 2011; Liu et al., 2010), the proportion of overlapping eQTLs was less than 10% (McKenzie et al., 2014).
Furthermore, we observed a trend of association between the rs2927438 A-allele and reduced hippocampal volume in healthy subjects. Previous studies have shown marked reductions in the volume of the hippocampus and amygdala in patients with overt LOAD compared to healthy elderly individuals (Jack et al., 1992). In addition, patients with mild cognitive impairment, who are at high risk of developing AD, also have smaller hippocampal volumes than healthy elderly people (Du et al., 2001). Even before the first occurrence of memory complaints, hippocampal atrophy can predict subsequent development of AD (den Heijer et al., 2006). Although the p-value of association between rs2927438 and hippocampal volume did not achieve nominal statistical significance (p = 0.107), it is not surprising, given that atrophy in the hippocampus is age dependent; and the mean age of the samples included in the present study was far less than 65 years (Hibar et al., 2017). Further studies are warranted to investigate this association.
There are additional limitations in the present study. First, other genes that did not meet our strict selection criteria for the integrative analysis of GWAS/eQTL data may also contribute to LOAD risk. Second, we cannot exclude the possibility that the association signal was actually caused by the hitchhiking effect of other causative variants, such as rare missense mutations and copy-number variations. The results from whole-genome sequencing of a LOAD data set may provide a more complete survey. Third, most of the AD samples collected for meta-analysis are of European origin, and whether rs2927438 also contributes to AD susceptibility in other populations remains elusive. Fourth, although blood-related eQTL data sets have been extensively used in AD studies, we cannot exclude the possibility of other missing risk genes specific to brain function regulation, and further studies using high-coverage large brain eQTL data sets are necessary. Notably, during the revision of the current article, the GTEx consortium published a large study on the effect of genomic variability on gene expression across multiple human tissues (GTEx-Consortium et al., 2017), which is an extremely valuable resource for future eQTL studies.
Supplementary Material
Acknowledgements
This work was in part supported by National Institutes of Health (to ER). The authors are deeply grateful for Christiane Reitz (Department of Neurology & Department of Epidemiology, Columbia University), Laura Cantwell (Department of Pathology and Laboratory Medicine, University of Pennsylvania School of Medicine), Haiyan Wang (Department of Statistics, Kansas State University), and Rachel A. Gibson (GSK Medicines Research Centre) for their valuable information about the LOAD GWAS data. The authors would like to thank Gary Donohoe (Cognitive Genetics and Therapy Group, School of Psychology, National University of Ireland, Galway & Department of Psychiatry and Trinity College Institute of Psychiatry, Trinity College, Dublin) for his willingness to share the cognitive data.
Footnotes
Disclosure statement
The authors have no conflict of interests.
Appendix A. Supplementary data
Supplementary data associated with this article can be found, in the online version, at https://doi.org/10.1016/j.neurobiolaging.2017.12.027.
References
- Apostolova LG, Dutton RA, Dinov ID, Hayashi KM, Toga AW, Cummings JL, Thompson PM, 2006. Conversion of mild cognitive impairment to Alzheimer disease predicted by hippocampal atrophy maps. Arch. Neurol. Chicago 63, 693–699. [DOI] [PubMed] [Google Scholar]
- Blacker D, Bertram L, Saunders AJ, Moscarillo TJ, Albert MS, Wiener H, Perry RT, Collins JS, Harrell LE, Go RC, Mahoney A, Beaty T, Fallin MD, Avramopoulos D, Chase GA, Folstein MF, McInnis MG, Bassett SS, Doheny KJ, Pugh EW, Tanzi RE NIMH Genetics Initiative Alzheimer’s Disease Study Group, 2003. Results of a high-resolution genome screen of 437 Alzheimer’s disease families. Hum. Mol. Genet 12, 23–32. [DOI] [PubMed] [Google Scholar]
- Carrasquillo MM, Zou FG, Pankratz VS, Wilcox SL, Ma L, Walker LP, Younkin SG, Younkin CS, Younkin LH, Bisceglio GD, Ertekin-Taner N, Crook JE, Dickson DW, Petersen RC, Graff-Radford NR, Younkin SG, 2009. Genetic variation in PCDH11X is associated with susceptibility to late-onset Alzheimer’s disease. Nat. Genet 41, 192–198. [DOI] [PMC free article] [PubMed] [Google Scholar]
- Cervantes S, Samaranch L, Vidal-Taboada JM, Lamet I, Bullido MJ, Frank-Garcia A, Coria F, Lleo A, Clarimon J, Lorenzo E, Alonso E, Sanchez-Juan P, Rodriguez-Rodriguez E, Combarros O, Rosich M, Vilella E, Pastor P, 2011. Genetic variation in APOE cluster region and Alzheimer’s disease risk. Neurobiol. Aging 32, 2107.e2107–2107.e2117. [DOI] [PubMed] [Google Scholar]
- Chapuis J, Hansmannel F, Gistelinck M, Mounier A, Van Cauwenberghe C, Kolen KV, Geller F, Sottejeau Y, Harold D, Dourlen P, Grenier-Boley B, Kamatani Y, Delepine B, Demiautte F, Zelenika D, Zommer N, Hamdane M, Bellenguez C, Dartigues JF, Hauw JJ, Letronne F, Ayral AM, Sleegers K, Schellens A, Broeck LV, Engelborghs S, De Deyn PP, Vandenberghe R, O’Donovan M, Owen M, Epelbaum J, Mercken M, Karran E, Bantscheff M, Drewes G, Joberty G, Campion D, Octave JN, Berr C, Lathrop M, Callaerts P, Mann D, Williams J, Buee L, Dewachter I, Van Broeckhoven C, Amouyel P, Moechars D, Dermaut B, Lambert JC GERAD Consortium, 2013. Increased expression of BIN1 mediates Alzheimer genetic risk by modulating tau pathology. Mol. Psychiatry 18, 1225–1234. [DOI] [PMC free article] [PubMed] [Google Scholar]
- Cheung VG, Nayak RR, Wang IXR, Elwyn S, Cousins SM, Morley M, Spielman RS, 2010. Polymorphic cis- and trans-regulation of human gene expression. PLoS Biol. 8, e1000480. [DOI] [PMC free article] [PubMed] [Google Scholar]
- Colantuoni C, Lipska BK, Ye T, Hyde TM, Tao R, Leek JT, Colantuoni EA, Elkahloun AG, Herman MM, Weinberger DR, Kleinman JE, 2011. Temporal dynamics and genetic control of transcription in the human prefrontal cortex. Nature 478, 519–523. [DOI] [PMC free article] [PubMed] [Google Scholar]
- Corder EH, Saunders AM, Risch NJ, Strittmatter WJ, Schmechel DE, Gaskell PC Jr., Rimmler JB, Locke PA, Conneally PM, Schmader KE, Small GW, Roses AD, Haines JL, Pericak-Vance MA, 1994. Protective effect of apolipoprotein E type 2 allele for late onset Alzheimer disease. Nat. Genet 7, 180–184. [DOI] [PubMed] [Google Scholar]
- Corder EH, Saunders AM, Strittmatter WJ, Schmechel DE, Gaskell PC, Small GW, Roses AD, Haines JL, Pericak-Vance MA, 1993. Gene dose of apolipoprotein E type 4 allele and the risk of Alzheimer’s disease in late onset families. Science 261, 921–923. [DOI] [PubMed] [Google Scholar]
- Cruchaga C, Nowotny P, Kauwe JS, Ridge PG, Mayo K, Bertelsen S, Hinrichs A, Fagan AM, Holtzman DM, Morris JC, Goate AM Alzheimer’s Disease Neuroimaging Initiative, 2011. Association and expression analyses with single-nucleotide polymorphisms in TOMM40 in Alzheimer disease. Arch. Neurol 68, 1013–1019. [DOI] [PMC free article] [PubMed] [Google Scholar]
- Deming Y, Li Z, Kapoor M, Harari O, Del-Aguila JL, Black K, Carrell D, Cai Y, Fernandez MV, Budde J, Ma S, Saef B, Howells B, Huang KL, Bertelsen S, Fagan AM, Holtzman DM, Morris JC, Kim S, Saykin AJ, De Jager PL, Albert M, Moghekar A, O’Brien R, Riemenschneider M, Petersen RC, Blennow K, Zetterberg H, Minthon L, Van Deerlin VM, Lee VM, Shaw LM, Trojanowski JQ, Schellenberg G, Haines JL, Mayeux R, Pericak-Vance MA, Farrer LA, Peskind ER, Li G, Di Narzo AF, Alzheimer’s Disease Neuroimaging Initiative, Alzheimer Disease Genetic Consortium, Kauwe JS, Goate AM, Cruchaga C, 2017. Genome-wide association study identifies four novel loci associated with Alzheimer’s endophenotypes and disease modifiers. Acta Neuropathol 133, 839–856. [DOI] [PMC free article] [PubMed] [Google Scholar]
- den Heijer T, Geerlings MI, Hoebeek FE, Hofman A, Koudstaal PJ, Breteler MM, 2006. Use of hippocampal and amygdalar volumes on magnetic resonance imaging to predict dementia in cognitively intact elderly people. Arch. Gen. Psychiatry 63, 57–62. [DOI] [PubMed] [Google Scholar]
- Dixon AL, Liang L, Moffatt MF, Chen W, Heath S, Wong KC, Taylor J, Burnett E, Gut I, Farrall M, Lathrop GM, Abecasis GR, Cookson WO, 2007. A genome-wide association study of global gene expression. Nat. Genet 39, 1202–1207. [DOI] [PubMed] [Google Scholar]
- Dixon JR, Selvaraj S, Yue F, Kim A, Li Y, Shen Y, Hu M, Liu JS, Ren B, 2012. Topological domains in mammalian genomes identified by analysis of chromatin interactions. Nature 485, 376–380. [DOI] [PMC free article] [PubMed] [Google Scholar]
- Du AT, Schuff N, Amend D, Laakso MP, Hsu YY, Jagust WJ, Yaffe K, Kramer JH, Reed B, Norman D, Chui HC, Weiner MW, 2001. Magnetic resonance imaging of the entorhinal cortex and hippocampus in mild cognitive impairment and Alzheimer’s disease. J. Neurol. Neurosurg. Psychiatry 71, 441–447. [DOI] [PMC free article] [PubMed] [Google Scholar]
- El Khoury J, Toft M, Hickman SE, Means TK, Terada K, Geula C, Luster AD, 2007. Ccr2 deficiency impairs microglial accumulation and accelerates progression of Alzheimer-like disease. Nat. Med 13, 432–438. [DOI] [PubMed] [Google Scholar]
- Escott-Price V, Bellenguez C, Wang LS, Choi SH, Harold D, Jones L, Holmans P, Gerrish A, Vedernikov A, Richards A, et al. , 2014. Gene-wide analysis detects two new susceptibility genes for Alzheimer’s disease. PLoS One 9, e94661. [DOI] [PMC free article] [PubMed] [Google Scholar]
- Gatz M, Reynolds CA, Fratiglioni L, Johansson B, Mortimer JA, Berg S, Fiske A, Pedersen NL, 2006. Role of genes and environments for explaining Alzheimer disease. Arch. Gen. Psychiatry 63, 168–174. [DOI] [PubMed] [Google Scholar]
- Ghani M, Lang AE, Zinman L, Nacmias B, Sorbi S, Bessi V, Tedde A, Tartaglia MC, Surace EI, Sato C, Moreno D, Xi Z, Hung R, Nalls MA, Singleton A, St George-Hyslop P, Rogaeva E, 2015. Mutation analysis of patients with neurodegenerative disorders using NeuroX array. Neurobiol. Aging 36, 545.e9–545.e14. [DOI] [PMC free article] [PubMed] [Google Scholar]
- GTEx-Consortium, 2015. Human genomics. The Genotype-Tissue Expression (GTEx) pilot analysis: multitissue gene regulation in humans. Science 348, 648–660. [DOI] [PMC free article] [PubMed] [Google Scholar]
- GTEx-Consortium, Lead analysts:, Laboratory, Data Analysis & Coordinating Center (LDACC):, NIH program management:, Biospecimen collection:, Pathology:, eQTL manuscript working group, Alexis B, Barbara EE, Stephen BM, 2017. Genetic effects on gene expression across human tissues. Nature 550, 204–213. [DOI] [PMC free article] [PubMed] [Google Scholar]
- Guerreiro R, Wojtas A, Bras J, Carrasquillo M, Rogaeva E, Majounie E, Cruchaga C, Sassi C, Kauwe JS, Younkin S, Hazrati L, Collinge J, Pocock J, Lashley T, Williams J, Lambert JC, Amouyel P, Goate A, Rademakers R, Morgan K, Powell J, St George-Hyslop P, Singleton A, Hardy J Alzheimer Genetic Analysis Group, 2013. TREM2 variants in Alzheimer’s disease. N. Engl. J. Med 368, 117–127. [DOI] [PMC free article] [PubMed] [Google Scholar]
- Harold D, Abraham R, Hollingworth P, Sims R, Gerrish A, Hamshere ML, Pahwa JS, Moskvina V, Dowzell K, Williams A, Jones N, Thomas C, Stretton A, Morgan AR, Lovestone S, Powell J, Proitsi P, Lupton MK, Brayne C, Rubinsztein DC, Gill M, Lawlor B, Lynch A, Morgan K, Brown KS, Passmore PA, Craig D, McGuinness B, Todd S, Holmes C, Mann D, Smith AD, Love S, Kehoe PG, Hardy J, Mead S, Fox N, Rossor M, Collinge J, Maier W, Jessen F, Schurmann B, Heun R, van den Bussche H, Heuser I, Kornhuber J, Wiltfang J, Dichgans M, Frolich L, Hampel H, Hull M, Rujescu D, Goate AM, Kauwe JS, Cruchaga C, Nowotny P, Morris JC, Mayo K, Sleegers K, Bettens K, Engelborghs S, De Deyn PP, Van Broeckhoven C, Livingston G, Bass NJ, Gurling H, McQuillin A, Gwilliam R, Deloukas P, Al-Chalabi A, Shaw CE, Tsolaki M, Singleton AB, Guerreiro R, Muhleisen TW, Nothen MM, Moebus S, Jockel KH, Klopp N, Wichmann HE, Carrasquillo MM, Pankratz VS, Younkin SG, Holmans PA, O’Donovan M, Owen MJ, Williams J, 2009. Genome-wide association study identifies variants at CLU and PICALM associated with Alzheimer’s disease. Nat. Genet 41, 1088–1093. [DOI] [PMC free article] [PubMed] [Google Scholar]
- He X, Fuller CK, Song Y, Meng Q, Zhang B, Yang X, Li H, 2013. Sherlock: detecting gene-disease associations by matching patterns of expression QTL and GWAS. Am. J. Hum. Genet 92, 667–680. [DOI] [PMC free article] [PubMed] [Google Scholar]
- Heinzen EL, Ge DL, Cronin KD, Maia JM, Shianna KV, Gabriel WN, Welsh-Bohmer KA, Hulette CM, Denny TN, Goldstein DB, 2008. Tissue-specific genetic control of splicing: implications for the study of complex traits. PLoS Biol 6, 2869–2879. [DOI] [PMC free article] [PubMed] [Google Scholar]
- Hibar DP, Adams HH, Jahanshad N, Chauhan G, Stein JL, Hofer E, Renteria ME, Bis JC, Arias-Vasquez A, Ikram MK, et al. , 2017. Novel genetic loci associated with hippocampal volume. Nat. Commun 8, 13624. [DOI] [PMC free article] [PubMed] [Google Scholar]
- Hollingworth P, Harold D, Sims R, Gerrish A, Lambert JC, Carrasquillo MM, Abraham R, Hamshere ML, Pahwa JS, Moskvina V, et al. , 2011. Common variants at ABCA7, MS4A6A/MS4A4E, EPHA1, CD33 and CD2AP are associated with Alzheimer’s disease. Nat. Genet 43, 429–435. [DOI] [PMC free article] [PubMed] [Google Scholar]
- Huang KL, Marcora E, Pimenova AA, Di Narzo AF, Kapoor M, Jin SC, Harari O, Bertelsen S, Fairfax BP, Czajkowski J, Chouraki V, Grenier-Boley B, Bellenguez C, Deming Y, McKenzie A, Raj T, Renton AE, Budde J, Smith A, Fitzpatrick A, Bis JC, DeStefano A, Adams HHH, Ikram MA, van der Lee S, Del-Aguila JL, Fernandez MV, Ibanez L, International Genomics of Alzheimer’s Project, Alzheimer’s Disease Neuroimaging Initiative, Sims R, Escott-Price V, Mayeux R, Haines JL, Farrer LA, Pericak-Vance MA, Lambert JC, van Duijn C, Launer L, Seshadri S, Williams J, Amouyel P, Schellenberg GD, Zhang B, Borecki I, Kauwe JSK, Cruchaga C, Hao K, Goate AM, 2017. A common haplotype lowers PU.1 expression in myeloid cells and delays onset of Alzheimer’s disease. Nat. Neurosci 20, 1052–1061. [DOI] [PMC free article] [PubMed] [Google Scholar]
- Jack CR Jr., Petersen RC, O’Brien PC, Tangalos EG, 1992. MR-based hippocampal volumetry in the diagnosis of Alzheimer’s disease. Neurology 42, 183–188. [DOI] [PubMed] [Google Scholar]
- Jonsson T, Stefansson H, Steinberg S, Jonsdottir I, Jonsson PV, Snaedal J, Bjornsson S, Huttenlocher J, Levey AI, Lah JJ, Rujescu D, Hampel H, Giegling I, Andreassen OA, Engedal K, Ulstein I, Djurovic S, Ibrahim-Verbaas C, Hofman A, Ikram MA, van Duijn CM, Thorsteinsdottir U, Kong A, Stefansson K, 2013. Variant of TREM2 associated with the risk of Alzheimer’s disease. N. Engl. J. Med 368, 107–116. [DOI] [PMC free article] [PubMed] [Google Scholar]
- Jun G, Vardarajan BN, Buros J, Yu CE, Hawk MV, Dombroski BA, Crane PK, Larson EB, Alzheimer’s Disease Genetics Consortium, Mayeux R, Haines JL, Lunetta KL, Pericak-Vance MA, Schellenberg GD, Farrer LA, 2012. Comprehensive search for Alzheimer disease susceptibility loci in the APOE region. Arch. Neurol 69, 1270–1279. [DOI] [PMC free article] [PubMed] [Google Scholar]
- Lambert JC, Heath S, Even G, Campion D, Sleegers K, Hiltunen M, Combarros O, Zelenika D, Bullido MJ, Tavernier B, Letenneur L, Bettens K, Berr C, Pasquier F, Fievet N, Barberger-Gateau P, Engelborghs S, De Deyn P, Mateo I, Franck A, Helisalmi S, Porcellini E, Hanon O, European Alzheimer’s Disease Initiative Initiative, de Pancorbo MM, Lendon C, Dufouil C, Jaillard C, Leveillard T, Alvarez V, Bosco P, Mancuso M, Panza F, Nacmias B, Bossu P, Piccardi P, Annoni G, Seripa D, Galimberti D, Hannequin D, Licastro F, Soininen H, Ritchie K, Blanche H, Dartigues JF, Tzourio C, Gut I, Van Broeckhoven C, Alperovitch A, Lathrop M, Amouyel P, 2009. Genome-wide association study identifies variants at CLU and CR1 associated with Alzheimer’s disease. Nat. Genet 41, 1094–1099. [DOI] [PubMed] [Google Scholar]
- Lambert JC, Ibrahim-Verbaas CA, Harold D, Naj AC, Sims R, Bellenguez C, DeStafano AL, Bis JC, Beecham GW, Grenier-Boley B, et al. , 2013. Meta-analysis of 74,046 individuals identifies 11 new susceptibility loci for Alzheimer’s disease. Nat. Genet 45, 1452–1458. [DOI] [PMC free article] [PubMed] [Google Scholar]
- Lambert JC, Perez-Tur J, Dupire MJ, Galasko D, Mann D, Amouyel P, Hardy J, Delacourte A, Chartier-Harlin MC, 1997. Distortion of allelic expression of apolipoprotein E in Alzheimer’s disease. Hum. Mol. Genet 6, 2151–2154. [DOI] [PubMed] [Google Scholar]
- Levine DM, Ek WE, Zhang R, Liu X, Onstad L, Sather C, Lao-Sirieix P, Gammon MD, Corley DA, Shaheen NJ, Bird NC, Hardie LJ, Murray LJ, Reid BJ, Chow WH, Risch HA, Nyren O, Ye W, Liu G, Romero Y, Bernstein L, Wu AH, Casson AG, Chanock SJ, Harrington P, Caldas I, Debiram-Beecham I, Caldas C, Hayward NK, Pharoah PD, Fitzgerald RC, Macgregor S, Whiteman DC, Vaughan TL, 2013. A genome-wide association study identifies new susceptibility loci for esophageal adenocarcinoma and Barrett’s esophagus. Nat. Genet 45, 1487–1493. [DOI] [PMC free article] [PubMed] [Google Scholar]
- Li H, Wetten S, Li L, St Jean PL, Upmanyu R, Surh L, Hosford D, Barnes MR, Briley JD, Borrie M, Coletta N, Delisle R, Dhalla D, Ehm MG, Feldman HH, Fornazzari L, Gauthier S, Goodgame N, Guzman D, Hammond S, Hollingworth P, Hsiung GY, Johnson J, Kelly DD, Keren R, Kertesz A, King KS, Lovestone S, Loy-English I, Matthews PM, Owen MJ, Plumpton M, Pryse-Phillips W, Prinjha RK, Richardson JC, Saunders A, Slater AJ, St George-Hyslop PH, Stinnett SW, Swartz JE, Taylor RL, Wherrett J, Williams J, Yarnall DP, Gibson RA, Irizarry MC, Middleton LT, Roses AD, 2008. Candidate single-nucleotide polymorphisms from a genomewide association study of Alzheimer disease. Arch. Neurol 65, 45–53. [DOI] [PubMed] [Google Scholar]
- Liu C, Cheng L, Badner JA, Zhang D, Craig DW, Redman M, Gershon ES, 2010. Whole-genome association mapping of gene expression in the human prefrontal cortex. Mol. Psychiatry 15, 779–784. [DOI] [PMC free article] [PubMed] [Google Scholar]
- Logue MW, Schu M, Vardarajan BN, Buros J, Green RC, Go RC, Griffith P, Obisesan TO, Shatz R, Borenstein A, Cupples LA, Lunetta KL, Fallin MD, Baldwin CT, Farrer LA Multi-Institutional Research on Alzheimer Genetic Epidemiology Study Group, 2011. A comprehensive genetic association study of Alzheimer disease in African Americans. Arch. Neurol 68, 1569–1579. [DOI] [PMC free article] [PubMed] [Google Scholar]
- McKenzie M, Henders AK, Caracella A, Wray NR, Powell JE, 2014. Overlap of expression quantitative trait loci (eQTL) in human brain and blood. BMC Med. Genomics 7, 31. [DOI] [PMC free article] [PubMed] [Google Scholar]
- Myers AJ, Gibbs JR, Webster JA, Rohrer K, Zhao A, Marlowe L, Kaleem M, Leung D, Bryden L, Nath P, Zismann VL, Joshipura K, Huentelman MJ, Hu-Lince D, Coon KD, Craig DW, Pearson JV, Holmans P, Heward CB, Reiman EM, Stephan D, Hardy J, 2007. A survey of genetic human cortical gene expression. Nat. Genet 39, 1494–1499. [DOI] [PubMed] [Google Scholar]
- Naj AC, Jun G, Beecham GW, Wang LS, Vardarajan BN, Buros J, Gallins PJ, Buxbaum JD, Jarvik GP, Crane PK, et al. , 2011. Common variants at MS4A4/MS4A6E, CD2AP, CD33 and EPHA1 are associated with late-onset Alzheimer’s disease. Nat. Genet 43, 436–441. [DOI] [PMC free article] [PubMed] [Google Scholar]
- Nica AC, Parts L, Glass D, Nisbet J, Barrett A, Sekowska M, Travers M, Potter S, Grundberg E, Small K, Hedman AK, Bataille V, Tzenova Bell J, Surdulescu G, Dimas AS, Ingle C, Nestle FO, di Meglio P, Min JL, Wilk A, Hammond CJ, Hassanali N, Yang TP, Montgomery SB, O’Rahilly S, Lindgren CM, Zondervan KT, Soranzo N, Barroso I, Durbin R, Ahmadi K, Deloukas P, McCarthy MI, Dermitzakis ET, Spector TD, Mu TC, 2011. The architecture of gene regulatory variation across multiple human tissues: the MuTHER study. PLoS Genet. 7, e1002003. [DOI] [PMC free article] [PubMed] [Google Scholar]
- Perez-Palma E, Bustos BI, Villaman CF, Alarcon MA, Avila ME, Ugarte GD, Reyes AE, Opazo C, De Ferrari GV Alzheimer’s Disease Neuroimaging Initiative, NIA-LOAD/NCRAD Family Study Group, 2014. Overrepresentation of glutamate signaling in Alzheimer’s disease: network-based pathway enrichment using meta-analysis of genome-wide association studies. PLoS One 9, e95413. [DOI] [PMC free article] [PubMed] [Google Scholar]
- Pope BD, Ryba T, Dileep V, Yue F, Wu W, Denas O, Vera DL, Wang Y, Hansen RS, Canfield TK, Thurman RE, Cheng Y, Gulsoy G, Dennis JH, Snyder MP, Stamatoyannopoulos JA, Taylor J, Hardison RC, Kahveci T, Ren B, Gilbert DM, 2014. Topologically associating domains are stable units of replication-timing regulation. Nature 515, 402–405. [DOI] [PMC free article] [PubMed] [Google Scholar]
- Puig M, Castellano D, Pantano L, Giner-Delgado C, Izquierdo D, Gaya-Vidal M, Lucas-Lledo JI, Esko T, Terao C, Matsuda F, Caceres M, 2015. Functional impact and evolution of a novel human polymorphic inversion that disrupts a gene and creates a fusion transcript. PLos Genet. 11, e1005495. [DOI] [PMC free article] [PubMed] [Google Scholar]
- Raj T, Rothamel K, Mostafavi S, Ye C, Lee MN, Replogle JM, Feng T, Lee M, Asinovski N, Frohlich I, Imboywa S, Von Korff A, Okada Y, Patsopoulos NA, Davis S, McCabe C, Paik HI, Srivastava GP, Raychaudhuri S, Hafler DA, Koller D, Regev A, Hacohen N, Mathis D, Benoist C, Stranger BE, De Jager PL, 2014. Polarization of the effects of autoimmune and neurodegenerative risk alleles in leukocytes. Science 344, 519–523. [DOI] [PMC free article] [PubMed] [Google Scholar]
- Ramasamy A, Trabzuni D, Guelfi S, Varghese V, Smith C, Walker R, De T, UK Brain Expression Consortium, North American Brain Expression, Consortium, Coin L, de Silva R, Cookson MR, Singleton AB, Hardy J, Ryten M, Weale ME, 2014. Genetic variability in the regulation of gene expression in ten regions of the human brain. Nat. Neurosci 17, 1418–1428. [DOI] [PMC free article] [PubMed] [Google Scholar]
- Ridge PG, Hoyt KB, Boehme K, Mukherjee S, Crane PK, Haines JL, Mayeux R, Farrer LA, Pericak-Vance MA, Schellenberg GD, Kauwe JSK Alzheimer’s Disease Genetics Consortium, 2016. Assessment of the genetic variance of late-onset Alzheimer’s disease. Neurobiol. Aging 41, 200.e213–200.e220. [Google Scholar]
- Roses AD, Lutz MW, Amrine-Madsen H, Saunders AM, Crenshaw DG, Sundseth SS, Huentelman MJ, Welsh-Bohmer KA, Reiman EM, 2010. A TOMM40 variable-length polymorphism predicts the age of late-onset Alzheimer’s disease. Pharmacogenomics J. 10, 375–384. [DOI] [PMC free article] [PubMed] [Google Scholar]
- Schadt EE, Lamb J, Yang X, Zhu J, Edwards S, Guhathakurta D, Sieberts SK, Monks S, Reitman M, Zhang C, Lum PY, Leonardson A, Thieringer R, Metzger JM, Yang L, Castle J, Zhu H, Kash SF, Drake TA, Sachs A, Lusis AJ, 2005. An integrative genomics approach to infer causal associations between gene expression and disease. Nat. Genet 37, 710–717. [DOI] [PMC free article] [PubMed] [Google Scholar]
- Seshadri S, Fitzpatrick AL, Ikram MA, DeStefano AL, Gudnason V, Boada M, Bis JC, Smith AV, Carassquillo MM, Lambert JC, Harold D, Schrijvers EM, Ramirez-Lorca R, Debette S, Longstreth WT Jr., Janssens AC, Pankratz VS, Dartigues JF, Hollingworth P, Aspelund T, Hernandez I, Beiser A, Kuller LH, Koudstaal PJ, Dickson DW, Tzourio C, Abraham R, Antunez C, Du Y, Rotter JI, Aulchenko YS, Harris TB, Petersen RC, Berr C, Owen MJ, Lopez-Arrieta J, Varadarajan BN, Becker JT, Rivadeneira F, Nalls MA, Graff-Radford NR, Campion D, Auerbach S, Rice K, Hofman A, Jonsson PV, Schmidt H, Lathrop M, Mosley TH, Au R, Psaty BM, Uitterlinden AG, Farrer LA, Lumley T, Ruiz A, Williams J, Amouyel P, Younkin SG, Wolf PA, Launer LJ, Lopez OL, van Duijn CM, Breteler MM CHARGE Consortium, GERAD1 Consortium, EADI1 Consortium, 2010. Genome-wide analysis of genetic loci associated with Alzheimer disease. JAMA 303, 1832–1840. [DOI] [PMC free article] [PubMed] [Google Scholar]
- Sillen A, Forsell C, Lilius L, Axelman K, Bjork BF, Onkamo P, Kere J, Winblad B, Graff C, 2006. Genome scan on Swedish Alzheimer’s disease families. Mol. Psychiatry 11, 182–186. [DOI] [PubMed] [Google Scholar]
- Sims R, van der Lee SJ, Naj AC, Bellenguez C, Badarinarayan N, Jakobsdottir J, Kunkle BW, Boland A, Raybould R, Bis JC, et al. , 2017. Rare coding variants in PLCG2, ABI3, and TREM2 implicate microglial-mediated innate immunity in Alzheimer’s disease. Nat. Genet 49, 1373–1384. [DOI] [PMC free article] [PubMed] [Google Scholar]
- Small SA, Duff K, 2008. Linking Abeta and tau in late-onset Alzheimer’s disease: a dual pathway hypothesis. Neuron 60, 534–542. [DOI] [PMC free article] [PubMed] [Google Scholar]
- Tajuddin SM, Schick UM, Eicher JD, Chami N, Giri A, Brody JA, Hill WD, Kacprowski T, Li J, Lyytikainen LP, et al. , 2016. Large-scale exome-wide association analysis identifies loci for white blood cell traits and pleiotropy with immune-mediated diseases. Am. J. Hum. Genet 99, 22–39. [DOI] [PMC free article] [PubMed] [Google Scholar]
- Webster JA, Gibbs JR, Clarke J, Ray M, Zhang W, Holmans P, Rohrer K, Zhao A, Marlowe L, Kaleem M, McCorquodale DS 3rd, Cuello C, Leung D, Bryden L, Nath P, Zismann VL, Joshipura K, Huentelman MJ, Hu-Lince D, Coon KD, Craig DW, Pearson JV, Group NA-N, Heward CB, Reiman EM, Stephan D, Hardy J, Myers AJ, 2009. Genetic control of human brain transcript expression in Alzheimer disease. Am. J. Hum. Genet 84, 445–458. [DOI] [PMC free article] [PubMed] [Google Scholar]
- Westra HJ, Peters MJ, Esko T, Yaghootkar H, Schurmann C, Kettunen J, Christiansen MW, Fairfax BP, Schramm K, Powell JE, Zhernakova A, Zhernakova DV, Veldink JH, Van den Berg LH, Karjalainen J, Withoff S, Uitterlinden AG, Hofman A, Rivadeneira F, Hoen PAC, Reinmaa E, Fischer K, Nelis M, Milani L, Melzer D, Ferrucci L, Singleton AB, Hernandez DG, Nalls MA, Homuth G, Nauck M, Radke D, Volker U, Perola M, Salomaa V, Brody J, Suchy-Dicey A, Gharib SA, Enquobahrie DA, Lumley T, Montgomery GW, Makino S, Prokisch H, Herder C, Roden M, Grallert H, Meitinger T, Strauch K, Li Y, Jansen RC, Visscher PM, Knight JC, Psaty BM, Ripatti S, Teumer A, Frayling TM, Metspalu A, van Meurs JBJ, Franke L, 2013. Systematic identification of trans eQTLs as putative drivers of known disease associations. Nat. Genet 45, 1238–1243. [DOI] [PMC free article] [PubMed] [Google Scholar]
- Zou F, Carrasquillo MM, Pankratz VS, Belbin O, Morgan K, Allen M, Wilcox SL, Ma L, Walker LP, Kouri N, Burgess JD, Younkin LH, Younkin SG, Younkin CS, Bisceglio GD, Crook JE, Dickson DW, Petersen RC, Graff-Radford N, Younkin SG, Ertekin-Taner N, 2010. Gene expression levels as endophenotypes in genome-wide association studies of Alzheimer disease. Neurology 74, 480–486. [DOI] [PMC free article] [PubMed] [Google Scholar]
Associated Data
This section collects any data citations, data availability statements, or supplementary materials included in this article.