

Abstract
Redox-active analytes that do not support direct electron transfer on the electrode, such as proteins with buried redox centers, pose challenges to characterization of their structural and thermodynamic properties. Investigations of indirect transitions in analytes supported by complex redox mixtures require a careful balance between kinetic limitations and spectral interference from the mediators. Using methylene green and thionine acetate as redox mediators and myoglobin as the analyte, we demonstrate that normal pulse spectrovoltammetry (NPSV) with Fourier transform infrared (FT-IR) detection and subsequent global spectral regression analysis can resolve structural and thermodynamic properties simultaneously with little a priori information. Both the E1/2 and unbiased redox difference FT-IR spectra of the Fe(II)/Fe(III) redox couple of myoglobin in reduction and oxidation NPSV modes were in good agreement with those reported earlier by independent techniques. The thermodynamic and kinetic limitations of mediators/analyte interactions were investigated using comprehensive semiempirical kinetic simulation models. This modeling effort yielded a flexible computational tool capable of quantitatively predicting the redox response in mediated electrochemical studies and defining its limitations, thus greatly expanding the range and precision of the formal mediator/analyte concentration ratio rule.
Graphical Abstract
Spectroelectrochemistry is a powerful technique that has been widely used to examine structural determinants and thermodynamic properties of a variety of inorganic, organic, and biological samples, including metalloenzymes. Staircase voltammetry with spectroscopic (UV–visible) detection, or staircase spectrovoltammetry (SSV), is the most common spectroelectrochemical method1–6 used with such strong chromophores as hemes because absorption by their cofactors is intense and the background drifts are insignificant compared to the redox-induced spectral changes. In this technique, the sample is subjected to square steps of changing potential in an optically transparent thin-layer electrochemical (OTTLE) cell.1,7,8 Spectra are recorded after equilibration delay at the applied potential, Ea,1,2,8–12 and are reported as a difference versus an initial single reference spectrum, Sr. The small path length of an OTTLE cell aids in exhaustive electrolysis, but the relatively low solubility of proteins limits optical SSV to analytes with strong absorption. It is natural that pioneering work by Mäntele and co-workers1–5,13,14 focused primarily on chlorophyll and heme proteins with their intense, oxidation state sensitive UV–vis absorption bands. This technique was rapidly adapted to multi-heme cytochromes,5,6 photosynthetic reaction centers,15–17 terminal oxidases,18–20 bc1 complex,21,22 copper enzymes,23,24 and Ni–Fe hydrogenases25,26 where optical detection of redox transitions was the primary technique or preceded IR studies.27
The information-rich mid-IR region can be used for the detection of redox-coupled vibrational changes in proteins, including peptide backbone and amino acid side-chain conformations, protonation events, and changes in hydrogen bonding.28,29 Potentiometric titrations are typically not under-taken in this region as spectra are affected by large, temperature-sensitive water absorption and are susceptible to drifts over time. Typically, IR spectroscopy is combined with potential step spectrovoltammetry (PSSV) where a square potential wave is repeated between a reference potential (Er) and Ea. Several redox difference IR spectra of proteins have been reported,1,4,13,15,16,18,22,23 where the redox behavior of the cofactor was first established optically.
Here we demonstrate that mid-IR normal pulse spectrovoltammetry (NPSV) with nonlinear deconvolution analysis can resolve mixtures of analytes, including those with unknown properties. IR-NPSV can report redox properties and coupled structural events in a wider range of redox-active analytes than is possible with optical detection. We show that IR-NPSV can be used to investigate analytes that are electrochemically slow or inactive in the absence of mediators and that computational modeling can yield quantitative interpretation of reactions in the mixture. Furthermore, such modeling enables rational design of the optimal experimental conditions for mediated electrochemical analysis, which is currently lacking. The sensitivity of IR-NPSV in resolving both vibrational and electrochemical properties of individual components of a redox-active mixture is demonstrated here using myoglobin (Mb), a metalloprotein with slow direct electrochemical kinetics and facile mediated electrochemistry, and two redox mediators. We revisit a general “1:100” rule for mediator/analyte pairs,30,31 examine its limits, and greatly expand its practical utility by taking into account solution and electrode electron-transfer kinetics.
EXPERIMENTAL SECTION
Sample Preparation.
Horse heart myoglobin, mediators, and general laboratory chemicals were of reagent or better grade from Sigma-Aldrich (St. Louis, MO) and were used as acquired. All samples were prepared and measured under anaerobic conditions. Samples of Mb were prepared in 25 mM Bis–Tris in D2O, pD 7.0, containing 0.5 M KCl. The pD of the buffer was measured at 10 °C with 0.5 M KCl and corrected for the activity of deuterium ions.32 D2O (99.9%, Sigma-Aldrich) is used in place of H2O to allow investigation of the 1500–1700 cm−1 frequency region. Methylene green (MG) and thionine acetate (TA) were added to their indicated concentrations. Stock solutions were stored at 4 °C.
NPSV Measurements.
NPSV was performed using a previously reported OTTLE cell33 with a 12.5 μm path length over a nanocrystalline boron-doped diamond (BDD) film on a silicon substrate as a working electrode33–35 and BaF2 back window at 10 °C. Coiled platinum wire was used as the counter electrode, and Ag/AgCl in saturated KCl was used as a reference electrode. Reduction and oxidation profiles were measured against Er of +0.5 and −0.5 V, respectively, using a potential step of 0.05 V. Potential was applied using a computer-controlled potentiostat (model CHI1202b, CH Instruments). The applied potential range varied between samples as indicated. Potential step durations were 150, 300, or 600 s as noted. Spectra were integrated during the final 90 s (for 150 s steps) or 120 s (for 300 and 600 s steps).
Fourier transform infrared (FT-IR) spectroscopy was performed using an Equinox 55/S spectrometer (Bruker). The OTTLE cell was placed in a sample compartment purged with nitrogen gas. A nitrogen stream was chilled in an ethanol/dry ice bath and reheated by a resistive wire heater controlled by a model 340 temperature controller (Lake Shore Cryotronics) to maintain the temperature at 10.0(1) °C throughout the measurement.
Determination of Solution Kinetics.
Individual samples of 20 μM MG and 20 μM TA were prepared in 25 mM Tris, pH 8 in a N2-purged anaerobic chamber. Samples were placed in an airtight, stirred, 1 cm cuvette and transferred to a UV–vis spectrophotometer (Hewlett-Packard 8453). Sodium dithionite was injected to reduce 95% of the mediator population, as observed spectrophotometrically. The reaction was initiated by injection of oxidized Mb to achieve an equimolar ratio with the mediator. UV–vis spectra were collected every 2 s for 20 s before and 10 min after the start of the reaction. Rate constants were obtained by exponential fit of temporal changes at the absorption maxima of mediators as described in the Results section.
Data Analysis and Simulation.
All data analysis and simulation procedures were developed and performed using Igor Pro as described below. Source code of the KinESim simulation package and demonstration Igor Pro experiment can be found on GitHub.36
RESULTS
NPSV requires twice as many measurements as SSV, but is substantially more robust against background drifts since the FT-IR difference spectrum (ΔSi) at each ith step is calculated against reacquired reference. All spectra were acquired following an equilibration period at the present potential (Figure S-1). The raw NPSV spectra were collected as an absorbance, A, versus frequency, ν, versus the sampling step data set, where each step i = [1, ns] included measurements at variable Ea,i and constant Er. This data set was reduced to a ΔAi,f × νf × Ea,i matrix as follows:
| (1) |
where Sa,i is the equilibrium spectrum at Ea while Sr,i and Sr,(i+1) are flanking equilibrium spectra at Er.
In multicomponent samples, such as analytes/mediators mixture, separation and identification of individual components becomes the main analytical challenge. Each experimentally observed difference spectrum of the mixture is a 1 × nν vector, where nν is the number of sampled frequencies, f = [1, nν]. is the sum of nc vectors representing the spectra of individual components, , where k = [1, nc]. In addition, includes experimental error due to baseline fluctuations, which can be described by a polynomial of npth order with parameters :
| (2) |
The complete experimental nν × ni data set is also a sum of nc spectral matrices describing the complete spectral contribution of each component k, Sk, plus a single nν × ns baseline matrix P:
| (3) |
The step-dependent spectrum of k is , where εk is a 1 × nν vector of extinction coefficients at the sampled frequencies, vf, and is the population fraction of the reduced (or oxidized) form of k as determined by the Nernst equation for the current Ea,i and thermodynamic properties of k: redox potential, , and the stoichiometry of the electron transfer, nk.
Deconvolution of the experimental matrix Sobs into individual contributions Sk and further into corresponding values of εk, , and nk was accomplished here by a custom global nonlinear spectral regression (GSR) procedure for Igor Pro.37 Such deconvolution can be computationally demanding for complex mixtures due to the number of fitted variables, which equals to . A typical data set described here requires up to 2500 independent variables to fit. Deconvolution can be further hindered by similarity in values and/or spectral uncertainties at limiting signal-to-noise (S/N) ratios, leading to singularity errors and collapse of the regression. To remediate this problem, GSR was first performed on NPSV data of all mediators individually to determine their εk, , and nk, which typically converged quickly. Providing approximate values for and nk as initial guesses facilitated convergence, but was not required for a one-component sample. An initial guess for the spectral vector εk was set to a uniform value (0 or 1) without bias for the expected spectral features. The polynomial term was suppressed over the initial iterations to resolve an inherent singularity problem between the baseline in εk (and, hence, ) and Pi, providing bias against the inclusion of the polynomial term in εk until suppression of Pi was lifted in subsequent iterations. A linear baseline (first order) was sufficient in most cases described here.
Figure 1 shows the full occupancy redox difference FT-IR spectra (ΔSk, top) and Nernstian profiles (ϕk, bottom) of two mediators. The fitted Nernstian profiles are described by continuous functions , while the experimental profiles represent discrete absorbance values, ΔAi,f, at characteristic frequencies, vf, of 1603 and 1605 cm−1 for MG and TA, respectively. The experimental values ΔAi,f were normalized in Figure 1 to the corresponding intensity in ΔSk of the fully electrolyzed sample for direct comparison with ϕk. Individual of mediators obtained by GSR are in good agreement with values reported earlier using traditional techniques.38,39 A similar approach can be used to describe potential-dependent vibrational changes of the electrode, although this was not necessary for BDD in this study.
Figure 1.
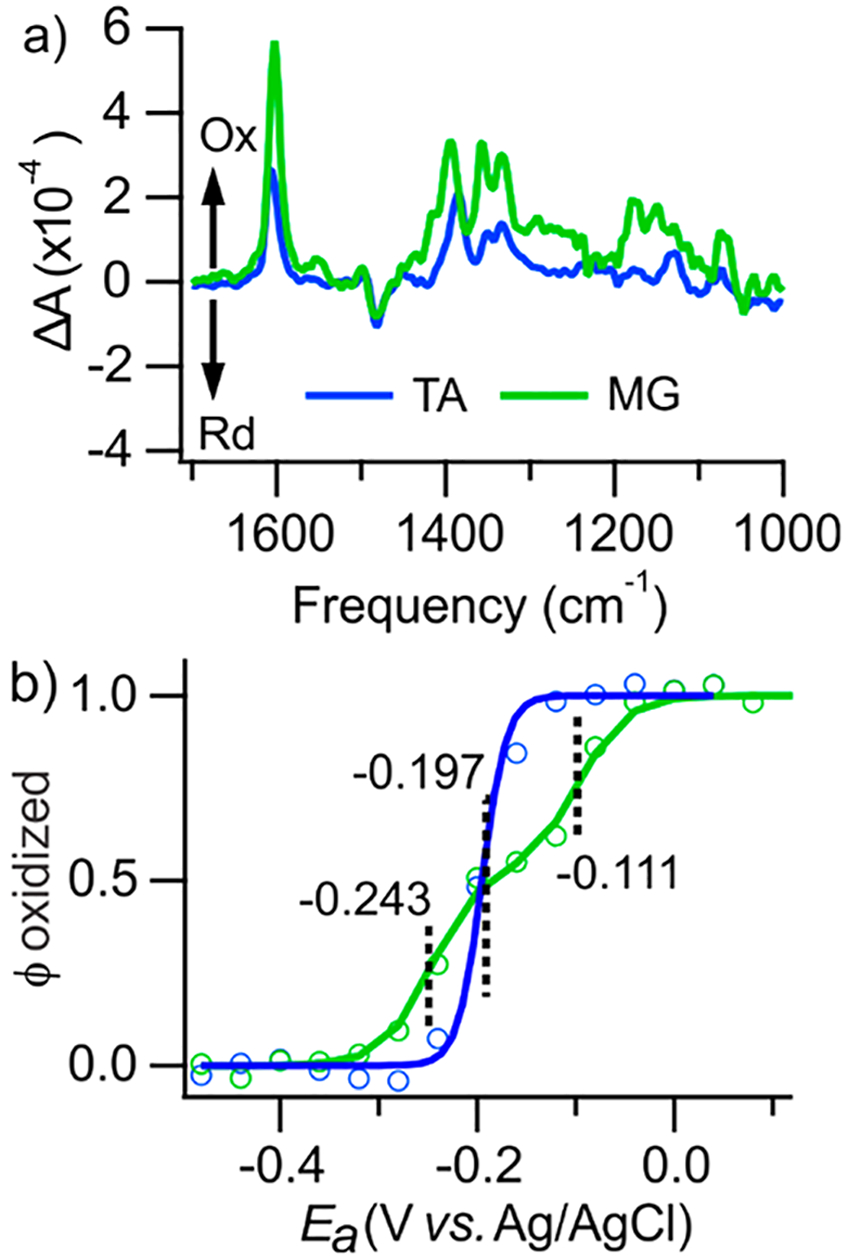
Resolution of spectra and Nernstian population profiles of mediators. Experimental NPSV spectra (, panel a) and GSR population profiles (ϕk, panel b) of MG and TA. Experimental (circles) and fitted (lines) Nernstian profiles are shown. Experimental profiles at vf of 1603 and 1605 cm−1 for MG and TA, respectively, were normalized to the absorbance of the complete redox transition. The calculated E1/2 values of the mediators are shown.
The predetermined εk, , and nk values of each known mediator were held constant during the subsequent unbiased analysis of the Fe(II)/Fe(III) redox couple of Mb to test the ability of NPSV with GSR to resolve redox transitions of an unknown analyte. In the absence of mediators (Figure 2b), there was a large hysteresis between the observed reduction and oxidation profiles, and their width indicated an n ≪ 1. Moreover, the extent of the transition was sensitive to the timing of the potential pulse, with a larger ΔAi,1657 observed for a longer pulse. These observations show that the direct electron transfer between Mb and the electrode is slower than necessary to maintain a redox equilibrium. GSR could not be reliably conducted in the absence of a complete transition of Mb under these conditions.
Figure 2.
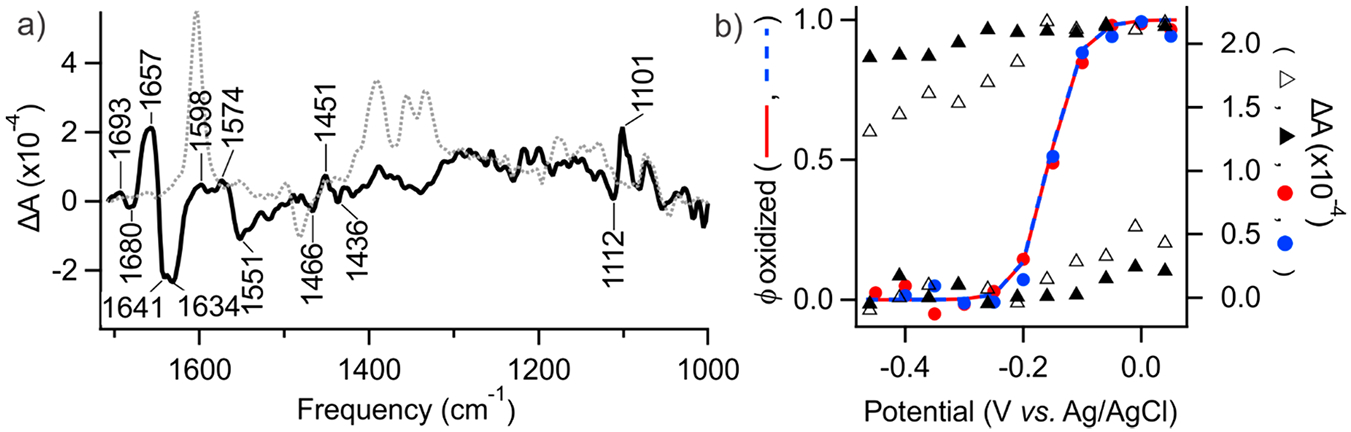
NPSV/GSR resolution of redox transition in Mb. (a) Isolated redox difference spectrum of Mb (SMb, solid line) and the combined spectrum of the mediator cocktail (dotted line). (b) Experimental ΔAi,f for mediated (circles) and unmediated (triangles) samples were obtained from the absorbance at 1657 cm−1. A 150 s NPSV pulse width was used for the unmediated (solid triangles) and mediated sample; a 600 s pulse was used only for the unmediated sample (open triangles). GSR population profiles and (lines) represent the relative intensity of SMb at any given Ea.
In the presence of mediators, reversible and exhaustive reduction and oxidation of Mb were observed (Figure 2b). In this case, the experimental profiles were accurately described by GSR, yielding ϕMb with E1/2 = −157 mV versus Ag/AgCl, n = 1, in good agreement with the reported value of −153 mV.40 Control GSR analysis with unrestricted nMG yielded coefficients of 0.9–1.1 without significant impact on . The 1:100 rule requires at least 10 μM of reduced mediator in equilibrium with to support kinetically effective oxidation of 1 mM analyte. Exhaustive electrolysis of Mb shows that the 100 μM total concentration of TA and MG satisfies this threshold at . The full occupancy redox difference GSR spectrum SMb (left) is in remarkable agreement with that reported earlier by Mäntele and co-workers using unmediated SSV at up to 9× higher analyte concentration.4 Notice that SMb in Figure 2 does not contain contribution of the redox mediators since they are described by separate εk vectors. The combined redox difference spectrum of the mediator cocktail at the concentration used here is shown by the dotted trace. The residual error from GSR analysis is shown in Figure S-2.
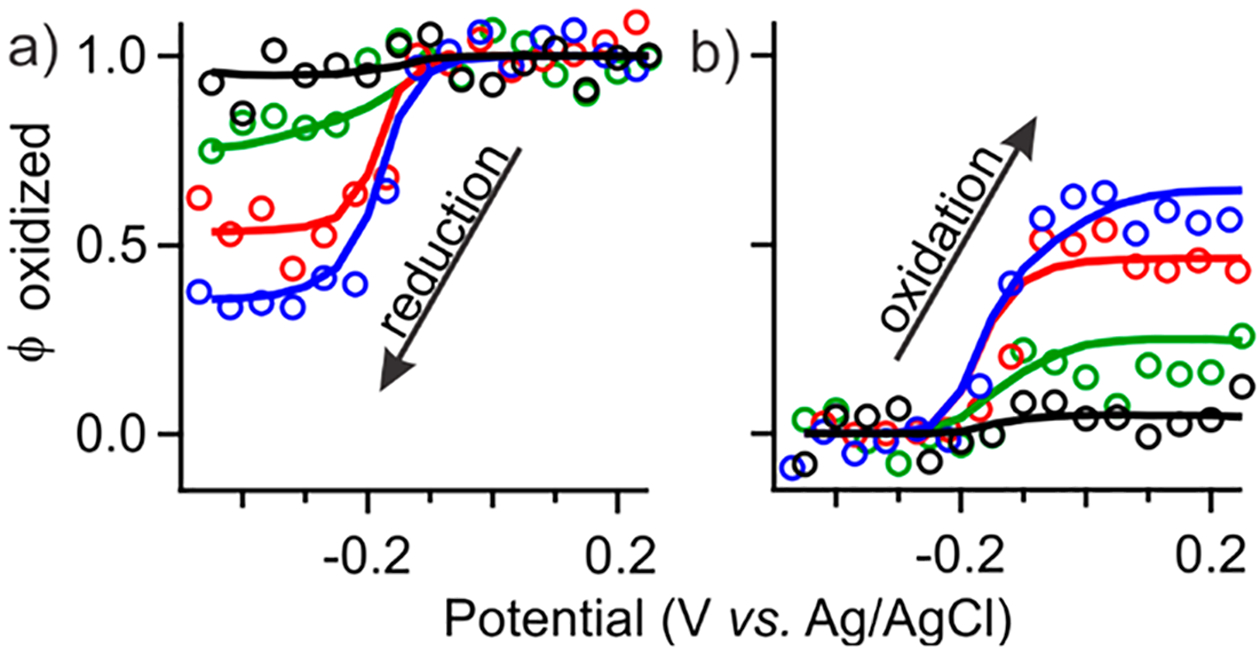
The sensitivity of the NPSV response of Mb to the mediator concentration and potential pulse width (Figure 3) can be used to test the limits of the 1:100 rule. The and profiles of Mb completely converge and exhibit a Nernstian response at pulse widths ≥300 s for a 25 μM mixture (each mediator). When either the concentration of mediators was too low or the pulse width was too short, the observed and profiles deviated from Nernstian behavior. This distortion is observed as a combination of one or more of the following: (i) loss in the amplitude, (ii) shift of the apparent transition away from , and (iii) broadening of the transition, i.e., n < 1. The concentration of 25 μM mediator mixture at 300 s pulse is lower than the 60 μM each mediator minimum predicted by the 1:100 rule for 1 mM Mb and all known E1/2 values. A larger discrepancy is expected for longer pulses. Since the original rule does not account for equilibration timing or rationalize kinetic artifacts (Figure 3), we developed a quantitative pre-equilibrium kinetics model of mediated electrochemistry to predict and interpret the characteristic response of an analyte under specific experimental conditions.
Figure 3.
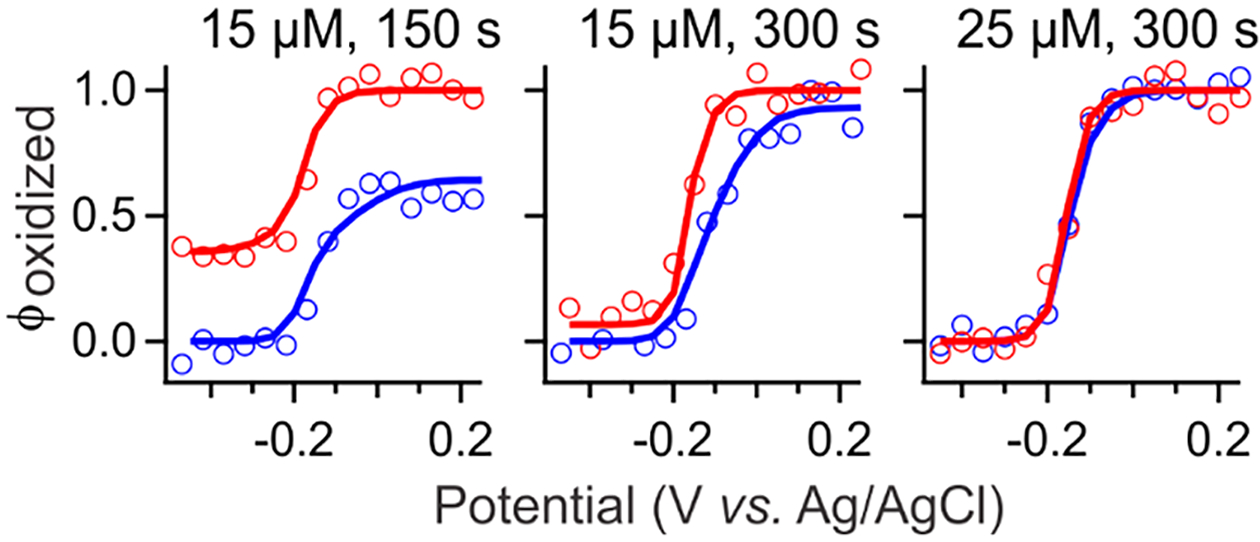
Sensitivity of NPSV to mediator concentration and pulse width. Sample contained 1 mM Mb and either 25 or 15 μM of each mediator and was sampled with a 300 or 150 s potential pulse width. The (red circles) and (blue circles) profiles were obtained by normalizing the ΔAi,1657 to the GSR population profiles. Simulated (red lines) and (blue lines) profiles were calculated as described in the text using experimental parameters shown in Table 1.
Figure 4a shows the minimal chemical model for the electrolysis of one mediator and one analyte in the solution, consisting of two processes: a heterogeneous reaction in the two-dimensional space of the electrode surface and a homogeneous reaction in the three-dimensional space of the bulk solution. These spaces constitute two separate subsystems and freely exchange matter as determined by the binding affinity. The adsorption/desorption process results in mass transfer of dnM moles of the reduced or oxidized mediator M over time, dt. The net mass transfer can be expressed as changes in concentrations of mediators in the bulk, CM, and surface, ΓM, subsystems based on their dimensions as follows:
| (4) |
where Vsol is the volume of the bulk solution with layer thickness hsol over an electrode area SAel so that Vsol = hsol (SAel). Resulting changes in the concentrations in the two subsystems are also related via hsol, which is the only extensive property of the model:
| (5) |
The net rate of the mass transfer with binding affinity kon/koff = Kbind is
| (6) |
In this study, we assumed that binding is not affected by the redox state, so that kon,Ox = kon,Rd and koff,Ox = koff,Rd, but corresponding rates RMT,Ox and RMT,Rd are distinct.
Figure 4.
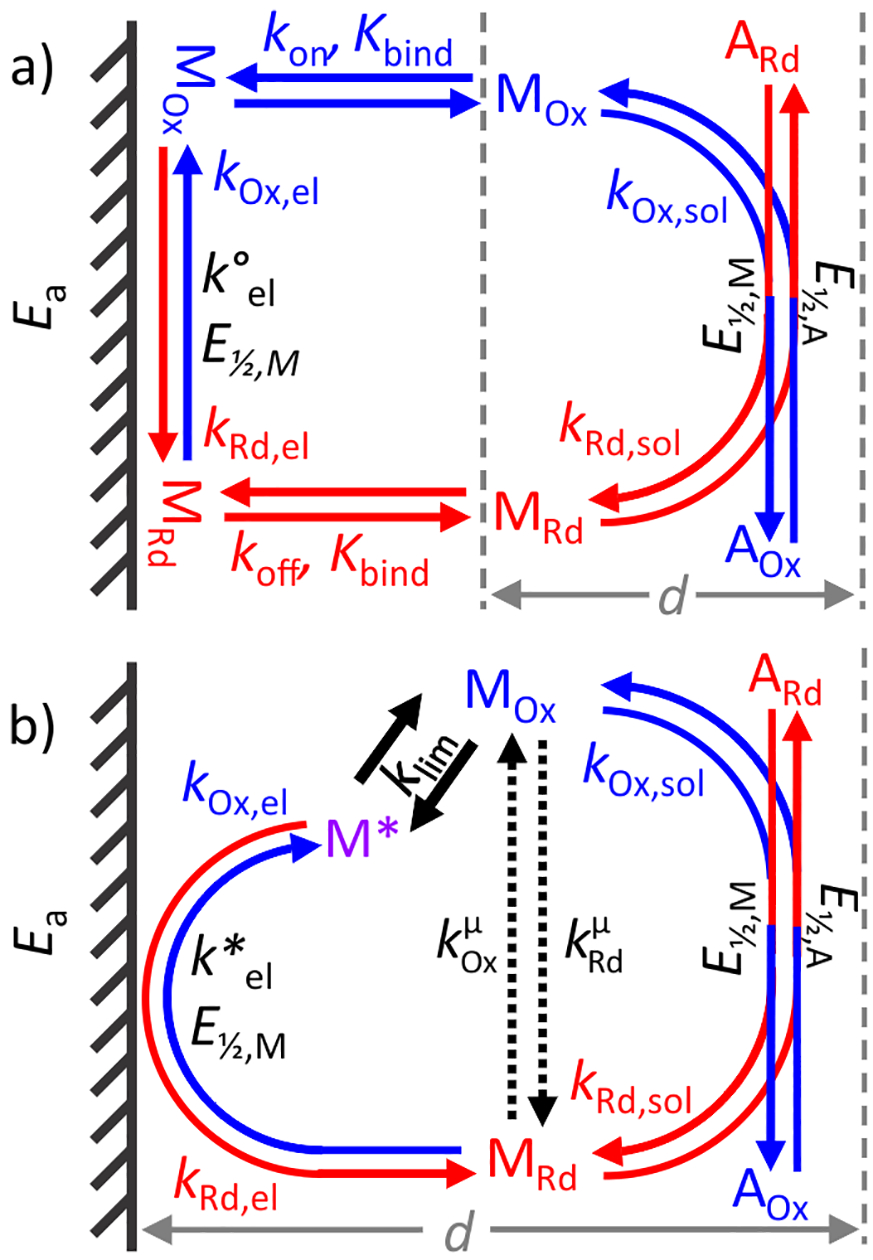
Kinetic model for the heterogeneous mediated electrolysis of an analyte in solution. (a) Complete model, including adsorption equilibria (kon, koff, Kbind) and intrinsic electron-transfer (k°el) steps under Ea on the electrode (hatched). (b) Reduced model condenses electron and mass transfer steps to pseudohomogeneous, Ea-independent (klim) and Ea-dependent (k*el) rate-limiting steps. These two steps are combined into a single reduced rate constant . The homogeneous reaction between the mediator and the analyte (kf,sol, kr,sol) controlled by their E1/2 in a layer of thickness d is identical for both models. See text for details.
The complete system of ordinary differential equations (ODE) describing MOx and MRd in each of the two subsystems includes three rates: RMT (above), the rate of the redox conversion on the electrode, RET, and the rate of redox reactions in the bulk solution, RBL. RET is described by ΓM and Butler–Volmer electrode rates kOx,el and kRd,el:
| (7) |
| (8) |
| (9) |
where is the intrinsic electron-transfer rate constant and α is the symmetry of the energy barrier. This expression does not account for possible binding competition between components of the mixture, which is not expected in dilute solutions.
The bulk rate, RBL, depends on the reactivity between the mediator and the analyte. In the simplest case, it is described as a homogeneous, bimolecular, stoichiometric reaction:
| (10) |
where kOx,sol and kRd,sol are dependent on the E1/2 of mediator and analyte:
| (11) |
The contribution of additional reactions between pairs of mediators in the solution has been tested, and they were found to have no effect on the resulting profiles but required longer simulation times. Therefore, cross-mediator reactions were not included in further studies. We also assumed that all solution concentrations are uniform across the 12.5 μm thin layer since we focus on investigating time scales that are long relative to diffusion rates. Lastly, homogeneous reactions were constrained to n = 1 based on the known redox stoichiometry of Mb.
The concentration of a single mediator M can be described by the system of ODEs presented in the Supporting Information, page S-2. The entire chemical system is described by analogous sets of ODE defined for each mediator/analyte pair. The total differential rates of and are determined by integrating RBL over all solution reactions. Direct redox reactions of an analyte on the electrode can be accounted for using eqs 6 and 7, as was done here for the case of Mb.
The numerical integration of the complete system of ODEs over time can predict temporal changes in the concentrations of individual components in response to Ea waveforms that mimic experimental spectroelectrochemistry. While the Euler integrator41 is often adequate for homogeneous reactions, the heterogeneous electrolysis described here imposes computational challenges. First, unequal partitioning of mediators between the electrode surface and bulk solution results in a large dΓM even for small dnM and dCM, which is exacerbated with increasing hsol. To meet the , Δt must be reduced by orders of magnitude relative to that needed for . Second, the exponential dependence of kel on requires further reduction of Δt when |ΔEk| exceeds 0.3–0.4 V. These two factors are multiplicative, leading to a stiff ODE problem: rapid shifts of equilibrium in small populations of MOx,el and MRd,el, interference between RET, RMT,Ox, and RMT,Rd, and the resulting fast and alternating shifts in the quotients of reactions over successive integration steps. Lastly, large and repetitive changes in Ea over the NPSV profile and the resulting wide variation of rates made it impractical to use a uniform Δt across the experiment.
We implemented two approaches to decrease the computational load when simulating the long (>5 h) real reaction times. First, we used Runge–Kutta integration41 with adaptive Δt, which varied based on the boundary conditions of the preceding step (Supporting Information, page S-2). This balanced a small time granularity under strongly off-equilibrium conditions immediately following Ea changes and with large Δt under near-equilibrium conditions at a stable Ea.
The second approach involved simplification of the chemical model (Figure 4b; Figure S-3). The development of a reduced reaction scheme alleviated the stiffness problem by eliminating the disparity between the surface and solution fractions without sacrificing the accuracy of the simulation. The virtual analyte M* collectively represents either Mel,Ox or Mel,Rd, depending on the overall direction of the process under the given Ea. M* is engaged in two sequential reactions. The first, an Ea-independent reaction with a rate-limiting step of klim represents the overall RMT. Even though K ≠ 1 for any particular process, it is an adequate approximation to use the same klim for both directions since only one of them, RMT,Ox or RMT,Rd, can be limiting at a time. The second, Ea-dependent reaction converts M* into one of the states of the mediator in the bulk solution and represents RET. Since M* is defined in the bulk phase, it is not affected by unequal partitioning between the electrode surface and the solution, reducing stiffness of the model.
The reduced model is described by an overall apparent limiting rate (eq 12) and reduced rate constants and . First, the overall forward reaction direction at a given moment is determined by the larger value between kOx,el and kRd,el, i.e., when kRd,el > kOx,el, reduction is the forward reaction and kf,el = kRd,el and kr,el = kOx,el. Reduced rate constants are then found as , and , where
| (12) |
| (13) |
| (14) |
Conversely, when kOx,el > kRd,el, oxidation is the forward reaction so that kf,el = kOx,el and kr,el = kRd,el. Equation 13 determines the overall rate in the forward (faster) direction, and eq 14 corrects the rate in the reverse (slower) direction to maintain an overall equilibrium constant at its thermodynamic value. Despite such a seemingly gross oversimplification, this reaction scheme yielded mediator concentration profiles that were indistinguishable from the full simulation with over 2 orders of magnitude reduction in CPU time across all conditions tested here (Figure S-4). The apparent reduced electron-transfer rate is related to the full model as follows:
| (15) |
The reduced model was used to predict changes in CM and CA under experimental NPSV conditions (Figure 5a). Concentration profiles were integrated over the spectral acquisition window, , followed by reversible changes (eq 1) and the population profiles (right), which are directly equivalent to the experimental NPSV vectors ϕk but offer insight into kinetic limitations. The NPSV simulation in Figure 5 was carried out with the assumption that the analyte is fully dependent on the mediator for redox transitions, as evident from the lag in the analyte response behind the mediator in real time (Figure 5a).
Figure 5.
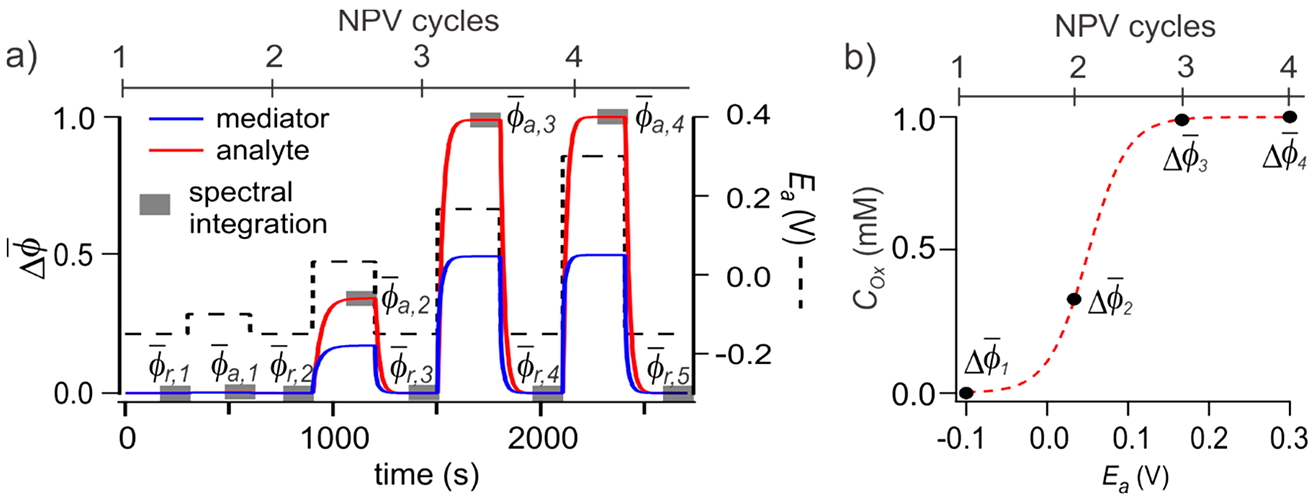
Modeling pre-equilibrium NPSV changes in the mediated reaction. (a) Simulated concentration profiles of the oxidation of 1 mM analyte (red line) in the presence of 0.5 mM mediator (blue line) in response to the changing Ea (black dash line). The concentration of the analyte is integrated over the spectral acquisition windows (gray rectangles) to obtain average populations and at applied (Ea) and reference (Er) NPSV potentials, respectively. (b) Potential-dependent population profile obtained from and per eq 1. E1/2 of the analyte and themediator are both 50 mV.
The reduced heterogeneous electrochemical model was validated against experimental NPSV profiles of Mb under a variety of conditions. First, unmediated NPSV of Mb with incomplete electrolysis was simulated for two different pulse durations (Figure 6). The unknown parameters klim and were determined to be 1.25 × 10⁻³ and 1.0 × 10⁻⁴ M−1 s−1, respectively, using a series of simulations of both and with a 300 s pulse, and then verified by extrapolation to a 600 s pulse without further adjustment. Simulations adequately predict the pulse-dependent increases in the amplitude of the early pre-equilibrium NPSV response (Figure 6), demonstrating that the reduced model is an adequate description of heterogeneous reactions in a thin layer and can be used for determination of the reduced kinetic parameters from experimental NPSV profiles.
Figure 6.
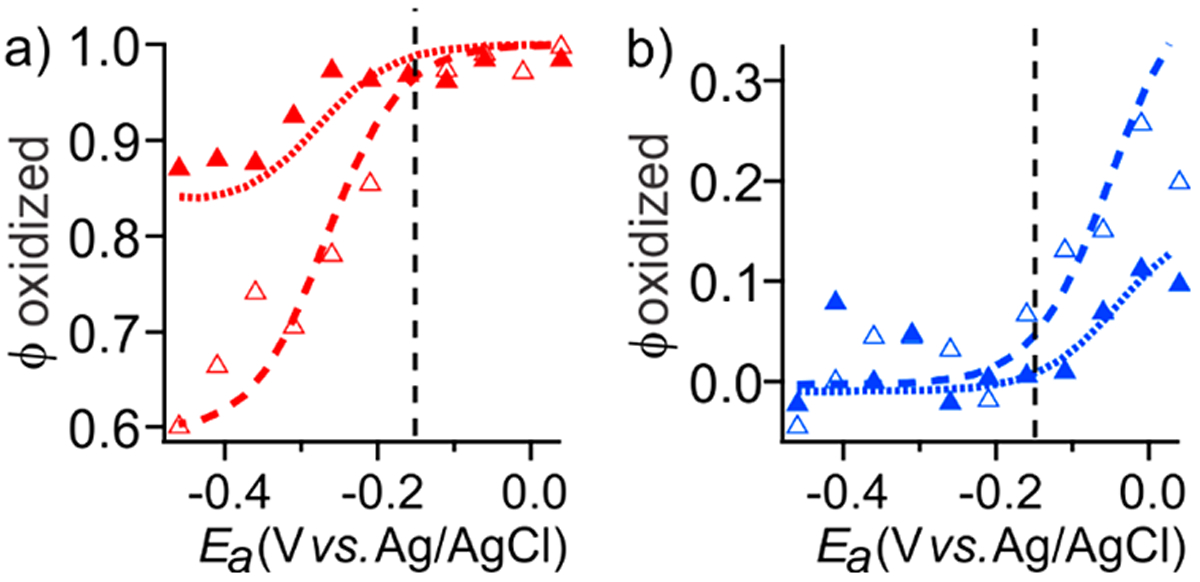
Sensitivity of the unmediated redox transition in Mb to NPSV pulse width. Experimental (markers) and simulated (lines) reduction (, panel a) and oxidation (, panel b) profiles were obtained in the absence of mediators at 300 s (solid triangles, dotted lines) and 600 s (open triangles, dashed lines) pulses. is shown by the vertical line.
NPSV profiles of mediators were used to estimate their klim and , except that 1 mM Mb was used as a reporter when concentrations of mediators were too low for spectral detection (<100 μM, Figure 7). NPSV of MG were measured directly at higher concentrations (≥200 μM, Figure S-5), while TA was not sufficiently soluble. Both TA and MG required shorter pulses and/or increased concentrations of Mb to detect pre-equilibrium populations. At low concentrations, klim of both mediators show linear concentration dependences (Table 1), effectively making the single 2e− transition in TA and the two resolved 1e− transitions in MG second-order rate constants in the mediator. This dependence was no longer observed for MG at higher concentrations with Mb as a reporter, suggesting saturation of klim = 0.5 s−1 at approximately 40 μM MG (Figure S-6). A slight decrease in of MG to 0.015 s−1 was observed when CMG ≥ 0.5 mM (not shown), but not enough to establish a clear concentration dependence. Low solubility of TA under our experimental conditions (<50 μM) precluded investigation of its klim saturation.
Figure 7.
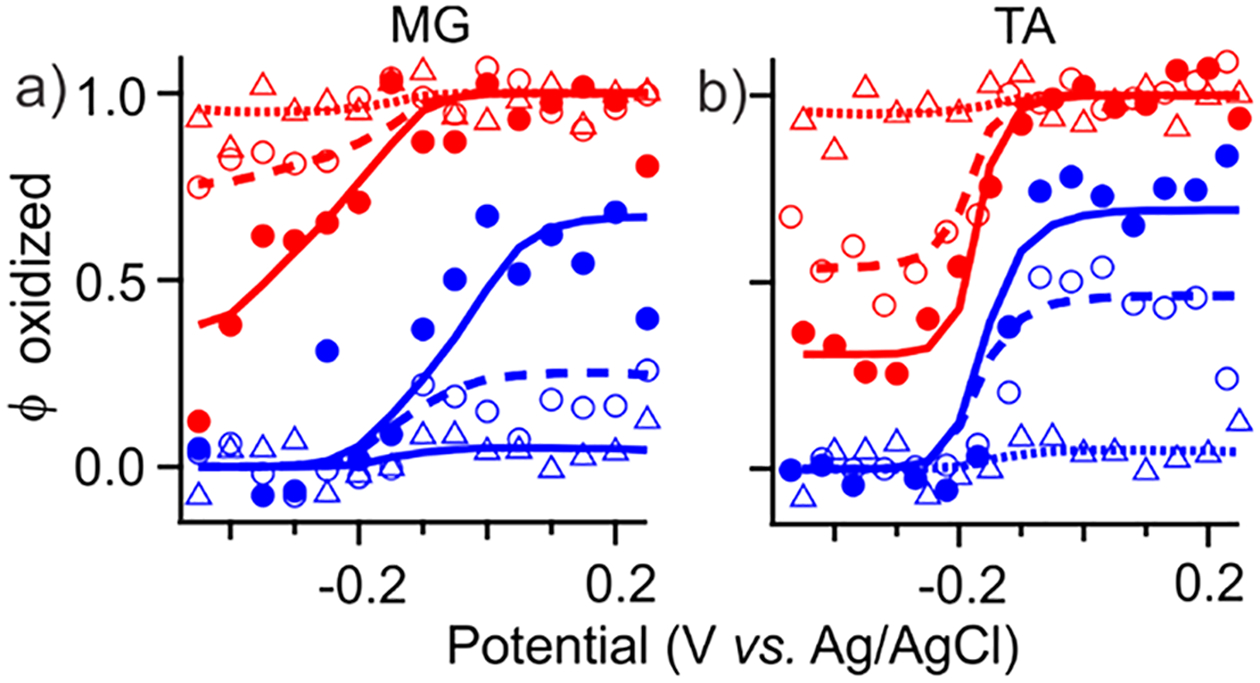
Concentration dependence of mediator-limited NPSV response. Experimental (markers) and simulated (lines) and profiles in the presence of no mediators (open triangles) and MG and TA at 15 μM (open circles) and 25 μM (solid circles).
Table 1.
Empirical Kinetic Properties of the Redox Mediators
| mediator | MGa | TA | |
|---|---|---|---|
| k*el (s−1) | 0.025 | 0.5 | |
| klim (s−1) | 10 μM | 0.124 | 0.467 |
| 15 μM | 0.186 | 0.7 | |
| 25 μM | 0.31 | 1.17 | |
| kf,sol (M−1 s−1) | 1.4 × 10⁴ | 1.7 × 10⁴ | |
Applies to both redox transitions (−110 mV and −243 mV). See text for interpretation.
The determination of empirical parameters was completed by estimating ksol of mediator/analyte pairs upon oxidation of Mb by either MG or TA (Figure S-7), and they were used to examine the cumulative effect of mediator mixture on the NPSV profiles. Simulations performed using a single set of parameters (Table 1) can adequately model observed NPSV profiles of Mb across multiple experimental conditions (Figure 3, lines). All three key characteristics—amplitude, apparent potential, and the width of transition—are reproduced computationally, including the asymmetry originating from the difference in potentials between the analyte and mediators. Cooperativity between TA and MG in supporting the redox transition of Mb was examined by modeling their mixtures (Figure 8), which showed that the mediator capacity of the mixture equals to the sum of the individual contributions of mediator/analyte pairs when measured relative to the residual activity of unmediated Mb. This observation is limited to mediator concentrations in the linear dependence range, since at the saturating concentrations (Figure S-6) electrolysis of Mb became exhaustive, precluding similar analysis. The agreement between experimental and computational results validates our assumption that no substantial competition or cooperativity should occur in dilute solutions of mediators. This includes homogeneous mediator/mediator reactions, presumably because MG and TA exhibit comparable limiting kinetics and provide no favorable reduction pathway. The latter conclusion may not hold if, for example, a homogeneous reaction between mediators is fast and electrode kinetics of one mediator is much faster than another.
Figure 8.
Cumulative effect of mediator mixtures. Experimental (circles) and simulated (lines) (a) and (b) profiles in the presence of individual and combined mediators. All samples were measured using a 150 s pulse width and contained 1 mM Mb and 15 μM of the indicated mediator(s), MG (green), TA (red), MG and TA (blue), or no mediators at all (black).
DISCUSSION
Spectroelectrochemistry with GSR analysis is a powerful tool for resolving components in a multicomponent system that can be used in optical (SSV) and vibrational (NPSV) domains. Its major advantage is the ability to report spectra and electrochemical properties of individual analytes simultaneously, especially when analytes do not exhibit fast, direct electrochemistry. In most cases it is not susceptible to spectral overlaps or regions of substantial background absorption and can further benefit from optimization of mediator concentrations using quantitative modeling. It also permits detection of redox-active insoluble analytes, such as particulate suspensions or immobilized samples. Spectroelectrochemistry is not as sensitive to the rate of the electron transfer as electric detection methods and can identify sites undergoing spectral transition. IR-NPSV eliminates the dependence of OTTLE techniques on the strong visible absorption by redox cofactors, opening the majority of analytes beyond porphyrins for redoxlinked vibrational analysis. Here, we illustrate the ability of GSR/NPSV to isolate the contribution of redox mediators and extract an unbiased redox difference spectrum of an unknown analyte using a well-characterized model, Mb, whose NPSV spectrum (Figure 2) is nearly identical to that previously reported using SSV.4 The NPSV-measured E1/2 of Mb is also in remarkable agreement with the reported value of −46.0 mV versus NHE40 obtained by chemical titrations. The overall resolution of a multidimensional technique, such as NPSV, is inherently higher than either spectroscopy or voltammetry separately.
Several strategies can facilitate GSR convergence and further improve the resolution, especially when the analyte and the mediators have common spectral features and/or similar . Particularly beneficial is a priori knowledge of εk, , and nk for all redox mediators. GSR uses the entire εk of every mediator at the sampled frequencies instead of characteristic minima/maxima, improving the overall S/N ratio. Therefore, it is best to either obtain εk in situ or to perform interpolation of the known reference spectra. If redox properties of a mediator are sensitive to conditions, they can be obtained at the same time by performing NPSV/GSR on an isolated component. An appropriate integer value can be assigned to nk, if known from the chemical nature and the reaction stoichiometry, and constrained to further reduce the computational load and improve the resolution of . This assumption provided an excellent fit for the NPSV profiles of isolated mediators in this study, but non-unity values can be used in other cases. Such preparatory steps significantly reduce the number of unknown variables in GSR on samples containing unknown component(s) and facilitates convergence as long as there are no tight binary interactions between the components of the mixture with the formation of new complexes. The latter assumption requires validation in preliminary tests.
The accuracy of redox properties reported by NPSV/GSR is highly dependent on the properties of the mediators. Slow kinetics of the mediator/analyte reaction and a low population of the effective redox state of the mediator at are the key factors that lead to low amplitudes and an apparent hysteresis (Figure 3). The original 1:100 rule does not consider the time or rate of a process. Its literal application to our Mb model inflates the required concentrations threshold severalfold for the E1/2 = 157 mV of Mb and potentials of mediators (Figure 3). As the minimal concentration is approximately inversely proportional to the potential pulse in multiturnover mediation, a larger difference can be predicted for longer potential pulses. While the 1:100 rule may provide a reasonable initial estimate for a general reaction, specific kinetic constraints are particularly critical for mediated reactions with slow kinetics, low stability, mediators with low solubilities, or electrodes with a small relative surface area, which lead us to the development of a quantitative pre-equilibrium model.
The ability of the kinetically constrained, pre-equilibrium model to report observables can be used to make experimentally testable predictions well beyond the limits of the original 1:100 rule. For example, by selecting 95% of the redox transition of the analyte as the minimal pre-equilibrium threshold, it is possible to predict the potential step duration necessary to reach that extent of reaction (t95) across a wide range of E1/2, CM, and ksol values (Figure S-8). Such analysis shows that t95 for a single arbitrary mediator/analyte pair is inversely proportional to ksol for slow reactions, but reaches a minimum when ksol exceeds 1000 M−1 s−1 using empirical parameters of TA or MG as an example, which arises from changing the relative contributions of ksol and in the overall rate-limiting step. Fast solution reactions are limited by , which, in turn, is determined by either the electron-transfer rate or the adsorption/desorption process klim. The relative contributions of and klim to the overall rate-limiting step can be assessed by varying E1/2 and CM with or without a reporter analyte and subsequently used to prevent or interpret possible distortion of NPSV profiles (Figure 7, Figure S-5).
It is important to emphasize that, while NPSV can yield structural and thermodynamic signatures simultaneously, it may be difficult to draw qualitative distinctions between intrinsic analyte properties on one hand and kinetic mediator artifacts on another based solely on the experimental voltammetric data. Utilization of GSR for the resolution of redox-active components followed by quantitative modeling of the redox response can alleviate such ambiguity and provide additional insight into underlying phenomena. A similar approach can be implemented across a variety of spectroelectrochemical techniques improving experimental design and interpretation.
CONCLUSION
We report the development of a set of complementary experimental and computational methods for the characterization of analytes in redox-active, multicomponent mixtures, including analytes that require mediators for an effective electron transfer. Utilization of FT-IR spectroelectrochemistry in the NPSV mode opens this method to a broad range of redox-active samples irrespective of their optical absorption. Complementary GSR and semiempirical computational modeling of a kinetically limited redox system provided quantitative rationalization of experimental observations, revealed the characteristic effects of kinetic limitations on the NPSV profiles, and permitted accurate predictions of optimal experimental conditions. The optimized quantitative model reported here provides a flexible tool that can be used to determine the empirical properties of analytes on the electrode and interpret mediator/analyte interactions in the solution. Its generalization refines and expands the utility of the 1:100 rule over a wide range of conditions.
Supplementary Material
ACKNOWLEDGMENTS
This work was supported by the National Institutes of Health Grants GM096132 and EY028049. The authors thank Dr. Greg M. Swain for synthesis of BDD electrodes and critical feedback and Dr. Benjamin G. Levine for stimulating discussions on quantitative modeling.
Footnotes
Supporting Information
The Supporting Information is available free of charge on the ACS Publications website at DOI: 10.1021/acs.analchem.9b00859.
Details for KinESim modeling, including system of ODEs for a single mediator/analyte pair, definition of boundary conditions for adaptive Runge–Kutta integration, potential profile of NPSV method, complete and reduced chemical models, additional illustrations for determination of kinetic variables and residuals, and predictions for the effective mediator concentrations across multiple conditions (PDF)
The authors declare no competing financial interest.
REFERENCES
- (1).Moss D; Nabedryk E; Breton J; Mäntele W Eur. J. Biochem 1990, 187 (3), 565–572. [DOI] [PubMed] [Google Scholar]
- (2).Moss DA; Leonhard M; Bauscher M; Mantele W FEBS Lett 1991, 283 (1), 33–36. [DOI] [PubMed] [Google Scholar]
- (3).Fritz F; Moss DA; Mäntele W FEBS Lett 1992, 297 (1–2), 167–170. [DOI] [PubMed] [Google Scholar]
- (4).Schlereth DD; Mäntele W Biochemistry 1992, 31 (33), 7494–7502. [DOI] [PubMed] [Google Scholar]
- (5).Schlereth DD; Mäntele W; Fernandez VM Biochemistry 1993, 32 (35), 9199–9208. [DOI] [PubMed] [Google Scholar]
- (6).Arciero DM; Collins MJ; Haladjian J; Bianco P; Hooper AB Biochemistry 1991, 30 (48), 11459–11465. [DOI] [PubMed] [Google Scholar]
- (7).Yao C; Capdevielle FJ; Kadish KM; Bear JL Anal. Chem 1989, 61, 2805–2809. [DOI] [PubMed] [Google Scholar]
- (8).Arciero DM; Hooper AB; Collins MJ J. Electroanal. Chem 1994, 371, 277–281. [Google Scholar]
- (9).Schlereth DD; Mäntele W Biochemistry 1993, 32 (4), 1118–1126. [DOI] [PubMed] [Google Scholar]
- (10).Graham PB; Curran DJ Anal. Chem 1992, 64 (22), 2688–2692. [Google Scholar]
- (11).Tsujimura S; Kuriyama A; Fujieda N; Kano K; Ikeda T Anal. Biochem 2005, 337 (2), 325–331. [DOI] [PubMed] [Google Scholar]
- (12).Bernad S; Mäntele W Anal. Biochem 2006, 351 (2), 214–218. [DOI] [PubMed] [Google Scholar]
- (13).Berthomieu C; Boussac A; Breton J; Nabedryk E; Mäntele W Biochemistry 1992, 31 (46), 11460–11471. [DOI] [PubMed] [Google Scholar]
- (14).Mäntele W; Wollenweber AM; Rashwan F; Heinze J; Nabedryk E; Berger G; Breton J Photochem. Photobiol 1988, 47 (3), 451–456. [Google Scholar]
- (15).Leonhard M; Mäntele W Biochemistry 1993, 32 (17), 4532–4538. [DOI] [PubMed] [Google Scholar]
- (16).Bauscher M; Leonhard M; Moss D; Mäntele W Biochim. Biophys. Acta, Bioenerg 1993, 1183 (1), 59–71. [Google Scholar]
- (17).Kuglstatter A; Hellwig P; Fritzsch G; Wachtveitl J; Oesterhelt D; Mäntele W; Michel H FEBS Lett 1999, 463 (1–2), 169–174. [DOI] [PubMed] [Google Scholar]
- (18).Hellwig P; Rost B; Kaiser U; Ostermeier C; Michel H; Mäntele W FEBS Lett 1996, 385 (1–2), 53–57. [DOI] [PubMed] [Google Scholar]
- (19).Hellwig P; Behr J; Ostermeier C; Richter OMH; Pfitzner U; Odenwald A; Ludwig B; Michel H; Mäntele W Biochemistry 1998, 37 (20), 7390–7399. [DOI] [PubMed] [Google Scholar]
- (20).Hellwig P; Ostermeier C; Michel H; Ludwig B; Mäntele W Biochim. Biophys. Acta, Bioenerg 1998, 1409 (2), 107–112. [DOI] [PubMed] [Google Scholar]
- (21).Ritter M; Anderka O; Ludwig B; Mäntele W; Hellwig P Biochemistry 2003, 42 (42), 12391–12399. [DOI] [PubMed] [Google Scholar]
- (22).Baymann F; Robertson DE; Dutton PL; Mäntele W Biochemistry 1999, 38 (40), 13188–13199. [DOI] [PubMed] [Google Scholar]
- (23).Brischwein M; Scharf B; Engelhard M; Mäntele W Biochemistry 1993, 32 (49), 13710–13717. [DOI] [PubMed] [Google Scholar]
- (24).St. Clair CS; Gray HB; Valentine JS Inorg. Chem 1992, 31 (5), 925–927. [Google Scholar]
- (25).DeLacey AL; Stadler C; Fernandez VM; Hatchikian EC; Fan HJ; Li S; Hall MB JBIC, J. Biol. Inorg. Chem 2002, 7 (3), 318–326. [DOI] [PubMed] [Google Scholar]
- (26).DeLacey AL; Fernandez VM; Rousset M; Cavazza C; Hatchikian EC JBIC, J. Biol. Inorg. Chem 2003, 8 (1–2), 129–134. [DOI] [PubMed] [Google Scholar]
- (27).Ash PA; Vincent KA Chem. Commun 2012, 48 (10), 1400–1409. [DOI] [PubMed] [Google Scholar]
- (28).Melin F; Hellwig P Biol. Chem 2013, 394 (5), 593–609. [DOI] [PubMed] [Google Scholar]
- (29).Murgida DH; Hildebrandt P Phys. Chem. Chem. Phys 2005, 7 (22), 3773–3784. [DOI] [PubMed] [Google Scholar]
- (30).Meckstroth ML; Norris BJ; Heineman WR Bioelectrochem. Bioenerg 1981, 8, 63–70. [Google Scholar]
- (31).Fultz ML; Durst RA Anal. Chim. Acta 1982, 140 (1), 1–18. [Google Scholar]
- (32).Covington AK; Paabo M; Robinson RA; Bates RG Anal. Chem 1968, 40 (4), 700–706. [Google Scholar]
- (33).Dai Y; Zheng Y; Swain GM; Proshlyakov DA Anal. Chem 2011, 83 (2), 542–548. [DOI] [PMC free article] [PubMed] [Google Scholar]
- (34).Swain GM; Ramesham R Anal. Chem 1993, 65 (4), 345–351. [Google Scholar]
- (35).Show Y; Witek MA; Sonthalia P; Swain GM Chem. Mater 2003, 15, 879–888. [Google Scholar]
- (36).John CW; Proshlyakov DA KinESim. https://github.com/Dap-Biospec/KinESim, 2019. (Accessed June 14, 2019).
- (37).Grzyska PK; Appelman EH; Hausinger RP; Proshlyakov DA Proc. Natl. Acad. Sci. U. S. A 2010, 107 (9), 3982–3987. [DOI] [PMC free article] [PubMed] [Google Scholar]
- (38).Zhou DM; Fang HQ; Chen HY; Ju HX; Wang Y Anal. Chim. Acta 1996, 329 (1–2), 41–48. [Google Scholar]
- (39).Chen HY; Zhou DM; Xu JJ; Fang HQ J. Electroanal. Chem 1997, 422 (1–2), 21–25. [Google Scholar]
- (40).Taylor JF; Morgan VE J. Biol. Chem 1942, 144, 15–20. [Google Scholar]
- (41).Butcher JC Numerical Methods for Ordinary Differential Equations; John Wiley & Sons: Chichester, U.K., 2016. [Google Scholar]
Associated Data
This section collects any data citations, data availability statements, or supplementary materials included in this article.