Abstract
Objectives
To determine how soon after commencement of the seasonal influenza vaccination programme, the AusVaxSafety active vaccine safety surveillance system, currently in use across Australia, would have detected a safety signal had it been operating in 2010 when there was an unprecedented number of febrile seizures in young children associated with one specific influenza vaccine brand, Fluvax (CSL Biotherapies).
Design
Simulation study.
Setting
Western Australian vaccine influenza coverage and adverse event surveillance data.
Outcome measures
Simulated solicited responses from caregivers who would have received an SMS survey about adverse events experienced following seasonal influenza vaccination of their children aged 6 months to <5 years.
Participants
None.
Results
We estimated a >90% probability of a safety signal being detected by AusVaxSafety based on solicited reports for either fever or medical attendance at or before the week ending 28 March 2010, 3 weeks after the start of vaccine distribution. Suspension of the national paediatric influenza vaccination programme as a result of the passive adverse events surveillance operating at the time did not occur until 23 April 2010.
Conclusions
Active vaccine safety surveillance leading to rapid detection of a safety signal would likely have resulted in earlier suspension of Fluvax from the vaccination programme, prevention of many febrile convulsions and maintenance of public confidence in influenza vaccination for young children.
Keywords: paediatric infectious disease & immunisation, adverse events, statistics & research methods
Strengths and limitations of this study.
This is a unique evaluation of an active surveillance system for adverse events following immunisation using data from a real-life vaccine safety event in 2010.
The study involves a comprehensive assessment of the timeliness of signal detection and the number of serious adverse events that could have been avoided given appropriate action.
The surveillance system (AusVaxSafety) currently operates Australia wide and this study provides evidence about the sensitivity and timeliness of the system should a similar safety event occur in the future.
AusVaxSafety has only been implemented since the safety event so this is a simulation exercise, unavoidably hypothetical in nature.
This study describes how a particular surveillance system would have reacted to a specific real-life vaccine safety event and it is not a general evaluation of signal detection systems operating in different settings.
Introduction
The post-licensure safety surveillance of seasonal influenza vaccines presents a significant challenge. The limited time available between the selection and production of strain-specific seasonal influenza vaccines and their distribution and use precludes large-scale safety trials. Historically, pharmacovigilance has relied on passive surveillance for the detection of adverse events following immunisation (AEFI) with seasonal influenza vaccines. Until recently, post-marketing vaccine safety surveillance in Australia has been passive with several important and well-described limitations1–3 resulting in substantial delays. This was clearly illustrated in 2010 following an unprecedented increase in febrile seizures in young children ultimately determined to be associated with one brand of trivalent influenza vaccine (TIV), Fluvax (CSL Biotherapies).4–6 In Western Australia (WA) influenza vaccines were distributed to providers from 8 March 2010 and the funded childhood influenza vaccination programme was officially launched on 19 March. A spike in fever-related presentations was relayed by clinicians to the WA Department of Health which advised the national regulatory authority, the Therapeutic Goods Administration (TGA), on 13 April; this was followed by a similar report from South Australia 2 days later. This led to the suspension of the paediatric influenza vaccination programme on 22 April in WA and nationwide on 23 April. Since many jurisdictions were not in the practice of immediately forwarding individual AEFI reports to the TGA, most febrile seizure reports were received by the TGA only after the decision to suspend all influenza vaccination in young children. Ultimately, there were estimated 63 cases of febrile convulsions in WA attributable to influenza vaccination, or 3.3 convulsions per 1000 vaccine doses—a rate more than 200 times higher than the only published population-based estimate of febrile convulsions in young children.5 7 This incident has resulted in decreased childhood influenza vaccine coverage in subsequent years and a loss of confidence in influenza vaccines among both consumers and immunisation providers.8
Independent reviews of the events of 2010 recommended that Australia improve its processes for vaccine safety surveillance.6 One result was the generation of several independent AEFI surveillance tools,9 10 which were ultimately incorporated into a national, active vaccine safety surveillance system under the AusVaxSafety initiative. The system solicits patient or carer reports of AEFI experienced in the days following vaccination via SMS message and monitors reported rates of fever and medical attendance (MA). This occurs on a weekly basis for influenza vaccines, thus facilitating rapid appropriate action in the event of any safety signals.11 AusVaxSafety has verified the safety of seasonal influenza vaccines administered to Australian children 6 months to <5 years of age since 2014, and to individuals of all ages since 2017, within weeks of the roll-out of vaccination programmes.9–13
Here, we report on an evaluation of the sensitivity and timeliness of the AusVaxSafety surveillance system by means of a simulation exercise using best estimates of the data which would have been available to the system during the first weeks of seasonal influenza vaccination in 2010. Since 2008 the WA state government has offered free influenza vaccination to children 6 months to <5 years of age and in 2009 the uptake was approximately 40% among eligible children.8 In the absence of a funded programme, vaccine coverage for young children in other states was very low and therefore we restricted our study to WA. The research question we address here is how soon after the start of seasonal influenza vaccination would the current AusVaxSafety signal detection system have detected a safety signal, had it been operating in 2010. Would this have enabled appropriate action to be taken earlier than occurred under the passive AEFI surveillance system which was operating at the time?
Methods
AusVaxSafety surveillance system
The AusVaxSafety active surveillance system has been described in detail elsewhere.9 10 The majority of participants are enrolled using the opt-out, electronic data monitoring platform SmartVax, which integrates with practice management software to automatically send SMS surveys to vaccine recipients or their caregivers as a part of routine care after vaccination. Enrollees receive an SMS from their medical provider 3–5 days following vaccination asking whether any AEFI were experienced and whether medical attention was sought in relation to the AEFI, as well as a further text containing a link to a brief smartphone survey enquiring after the nature, severity and duration of the AEFI. Primary outcomes are self-reports of any event, fever and medical attention. For seasonal influenza vaccine safety surveillance, SmartVax data are sent weekly (from approximately April through August) to AusVaxSafety for analysis, signal detection and weekly reporting to the Australian Government Department of Health. Key results are also made publicly available on the AusVaxSafety website.
Patient and public involvement
The AusVaxSafety surveillance system does not specifically recruit patients but does rely on community participation described earlier. The study described here is a simulation exercise so no additional public involvement was required.
AusVaxSafety signal detection
AusVaxSafety performs weekly safety signal detection analysis of reported fever and MA rates using fast initial response cumulative sum (FIR CUSUM) methods. FIR CUSUM control charts track the log-likelihood ratios of an observed cumulative event rate at a maximum acceptable level versus an expected level.14 Expected and maximum acceptable rates are set at the start of each influenza vaccination season based on a synthesis of clinical trial data and surveillance data from previous influenza seasons.12 13 15 For children aged 6 months to <5 years the expected MA rate in 2018 was set at 1%, while the expected fever rate was set at 3%. Maximum acceptable rates were 3% and 10% for MA and fever, respectively. A safety signal is generated when the log-likelihood ratio rises above a pre-set control threshold, which is determined by a process of simulating a large number of vaccination seasons with various ‘true’ event rate scenarios and the expected number of respondents. Criteria for setting control thresholds currently consist of ensuring a ≥80% probability of signal detection within 3 weeks of the start of reporting when the event rate is at the maximum acceptable level while maintaining a ≤2% probability of (false positive) signal generation at any point during the vaccination season when the event rate is at the expected level.
Simulation parameters
Simulations of the AusVaxSafety signal detection systems were developed under three scenarios (table 1). Scenario 1 simulated system performance using the 2018 values for expected and maximum acceptable AEFI rates, while scenarios 2 and 3 used higher expected and maximum acceptable rates and therefore they were more conservative scenarios where the system is less likely to generate a safety signal. Published data on fever rates in children following seasonal influenza vaccination vary considerably.16 Probably the most relevant data that would have been available in 2010 are from a randomised control trial17 which reported fever rates of 23% in children under 4 years of age after receipt of the southern hemisphere TIV (Fluvax) in 2005. Therefore we used an expected rate of 20% and a maximum acceptable rate of 40% for fever under scenario 2 and rates of 30% and 50% for expected and maximum acceptable, respectively, under scenario 3. We are not aware of any published data on MA rates after vaccination that would have been available in 2010. For scenarios 2 and 3, we chose conservatively high expected rates for MA of 4% and 6% and maximum acceptable rates of 8% and 10%, respectively. Appropriate control thresholds were determined for both AEFI outcomes (fever and MA) under all scenarios using the simulation procedure described earlier.
Table 1.
Parameter values used in simulations of 2010 AusVaxSafety signal detection
| AEFI | Parameter |
Scenario 1
2018 AEFI rates (%) |
Scenario 2
Conservative 2010 AEFI rates (%) |
Scenario 3
Ultra-conservative 2010 AEFI rates (%) |
| Fever | Expected rate | 3 | 20 | 30 |
| Maximum acceptable rate | 10 | 40 | 50 | |
| Observed rate and 95% CI (Fluvax) | 56.5 (49.4 to 63.3) | |||
| Observed rate and 95% CI (other brands) | 17.3 (10.7 to 25.7) | |||
| Medical attendance | Expected rate | 1 | 4 | 6 |
| Maximum acceptable rate | 3 | 8 | 10 | |
| Observed rate and 95% CI (Fluvax) | 16.4 (8.8 to 27.0) | |||
| Observed rate and 95% CI (other brands) | 2.0 (0.2 to 7.1) | |||
AEFI, adverse events following immunisation.
Our study also required estimates of the AEFI rates that would have been reported via Smartvax and an estimate of the weekly number of Smartvax responses that would have been received in 2010. A retrospective cohort study conducted in WA shortly after cessation of paediatric influenza vaccination in April 20105 reported a fever rate of 56.5% (95% CI 49.4% to 63.3%) among children under 5 years of age who received Fluvax. During that period the reported fever rate was 17.3% (95% CI 10.7% to 25.7%) after receipt of the principal alternative TIV brand, Influvac (Solvay Pharmaceuticals). This study did not report information on MA but a smaller retrospective study18 followed up children who had received influenza vaccination at three New South Wales hospital outpatient clinics and reported a MA rate following vaccination with Fluvax of 16.4% (95% CI 8.8% to 27.0%) and a MA rate of 2.0% (95% CI 0.2% to 7.1%) after receipt of Influvac.
As of the 2018 influenza season, the Smartvax system was installed at 60 sentinel immunisation provider sites in WA and for the purposes of this study we applied the most recently available Smartvax participation rate. From April through August 2017, 3913 Smartvax responses were received after a total of 22 935 doses of influenza vaccine administered to children under 5 years in WA (data from Australian Immunisation Register) giving a Smartvax participation rate of 17.1%; this rate was used in our simulations. Table 2 shows the total number of seasonal influenza vaccine doses administered by week and by brand to children under 5 years in WA during 2010 and table 3 shows our weekly estimate of the number of responses which would have been received by the Smartvax system following receipt of either Fluvax or other vaccine brands.
Table 2.
Seasonal influenza vaccine doses administered to WA children 6 months to <5 years of age by brand in 2010*
| Week ending | Fluarix | Fluarix tetra | Fluvax | Fluvax junior | Fluvirin | Influvac | Vaxigrip | Vaxigrip junior | Unspecified brand |
| 7/03/10 | 0 | 0 | 7 | 0 | 0 | 0 | 1 | 0 | 3 |
| 14/03/10 | 0 | 0 | 95 | 0 | 0 | 0 | 1 | 0 | 4 |
| 21/03/10 | 2 | 0 | 541 | 1 | 0 | 1 | 1 | 1 | 11 |
| 28/03/10 | 3 | 0 | 1192 | 1 | 0 | 6 | 4 | 0 | 23 |
| 4/04/10 | 3 | 1 | 1178 | 0 | 0 | 30 | 5 | 0 | 31 |
| 11/04/10 | 7 | 0 | 829 | 0 | 0 | 119 | 3 | 1 | 55 |
| 18/04/10 | 5 | 0 | 2714 | 2 | 3 | 201 | 12 | 1 | 236 |
| 25/04/10 | 8 | 0 | 3698 | 2 | 0 | 185 | 12 | 0 | 91 |
| 2/05/10 | 1 | 0 | 23 | 0 | 0 | 1 | 3 | 0 | 10 |
| 9/05/10 | 0 | 0 | 4 | 0 | 0 | 0 | 0 | 0 | 1 |
*Data from Australian Immunisation Register.
WA, Western Australia.
Table 3.
Estimated total doses by brand (Fluvax and other) and estimated number of Smartvax responses
| Week ending | Total doses | Smartvax responses* | ||
| Fluvax† | Other brands‡ | Fluvax | Other brands | |
| 7/03/10 | 10 | 1 | 2 | 0 |
| 14/03/10 | 99 | 1 | 17 | 0 |
| 21/03/10 | 552 | 6 | 94 | 1 |
| 28/03/10 | 1215 | 14 | 208 | 2 |
| 4/04/10 | 1207 | 41 | 206 | 7 |
| 11/04/10 | 881 | 133 | 151 | 23 |
| 18/04/10 | 2939 | 235 | 503 | 40 |
| 25/04/10 | 3786 | 210 | 647 | 36 |
| 2/05/10 | 32 | 6 | 5 | 1 |
| 9/05/10 | 5 | 0 | 1 | 0 |
*Smartvax participation rate (17.1%) applied to total dose numbers.
†Total of Fluvax and Fluvax junior plus pro rata apportionment of unspecified brands.
‡Total of all other brands plus pro rata apportionment of unspecified brands.
Simulation execution
Simulations of AusVaxSafety performance during the first 7 weeks of the 2010 influenza vaccination season (7 March to 25 April) were performed with assumed ‘true’ underlying AEFI rates corresponding to rates of fever and MA observed or estimated in the studies earlier. The Influvac AEFI rates from these studies were applied to all brands other than Fluvax in our simulations. In addition to these point estimates for each vaccine brand, the ‘true’ event rates were also set at the lower limits of the 95% CI for the rate estimates for each brand. Each week of the season involved a random draw from a binomial distribution whose parameters were the estimated number of Smartvax responses for that week and the ‘true’ AEFI probabilities for each brand. Thus, we simulated the number of adverse events ‘reported’ via Smartvax for each week and calculated a log-likelihood ratio for the cumulative number of events. The simulation stopped when the log-likelihood ratio exceeded the control threshold, corresponding to a safety signal being generated. The simulation was run 10 000 times for each ‘true’ event rate under each scenario and the distribution of the timing of any safety signals recorded. The simulations were performed using SAS V.10.
Results
Figures 1–6 show the simulated 2010 performance of the AusVaxSafety signal detection system under various conditions. Under scenario 1 (figure 1), where expected and maximum acceptable fever rates are set at their 2018 values, we predict that there would have been a >99% probability of a safety signal being detected for fever at or before the end of week 2 (21 March) for both hypothesised combinations of values of the ‘true’ fever rate. Under scenario 2 (figure 2), involving conservatively high values of the expected and maximum acceptable fever rates, we predict a >99% probability of a fever safety signal at or before the end of week 3 (28 March) and a >90% probability of a signal at or before the end of week 2 (21 March) for both combinations of values of the ‘true’ fever rate. For scenario 3 (figure 3) involving ultra-conservatively high values of expected and maximum acceptable fever rates, there is a predicted >90% probability of a signal at or before the end of week 3 (28 March) for both high and low values of the ‘true’ fever rates.
Figure 1.
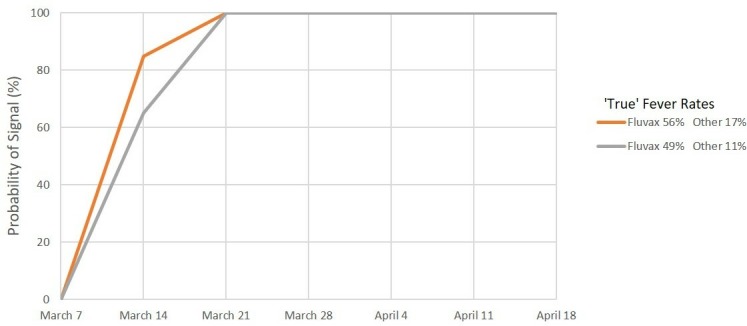
Signal detection for fever, 2010. Percentage of simulations resulting in a signal by date. Scenario 1: Expected rate 3% and maximum acceptable rate 10%.
Figure 2.
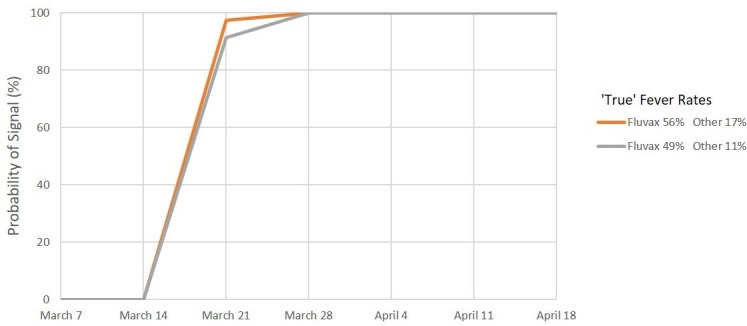
Signal detection for fever, 2010. Percentage of simulations resulting in a signal by date. Scenario 2: Expected rate 20% and maximum acceptable rate 40%.
Figure 3.
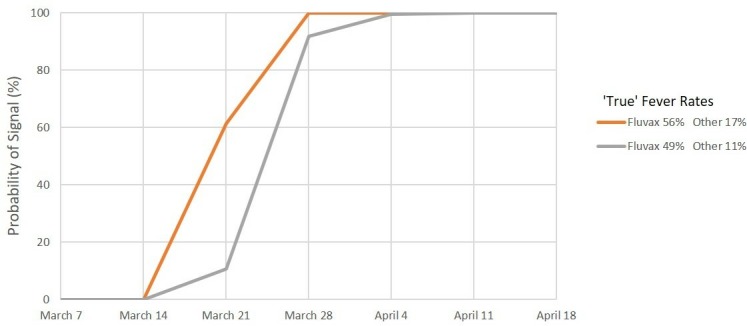
Signal detection for fever, 2010. Percentage of simulations resulting in a signal by date. Scenario 3: Expected rate 30% and maximum acceptable rate 50%.
Figure 4.
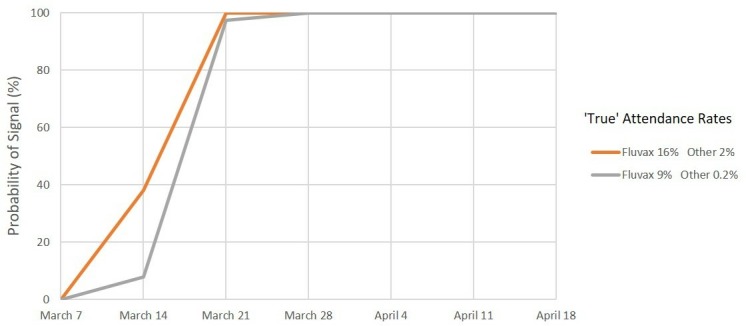
Signal detection for medical attendance, 2010. Percentage of simulations resulting in a signal by date. Scenario 1: Expected rate 1% and maximum acceptable rate 3%.
Figure 5.
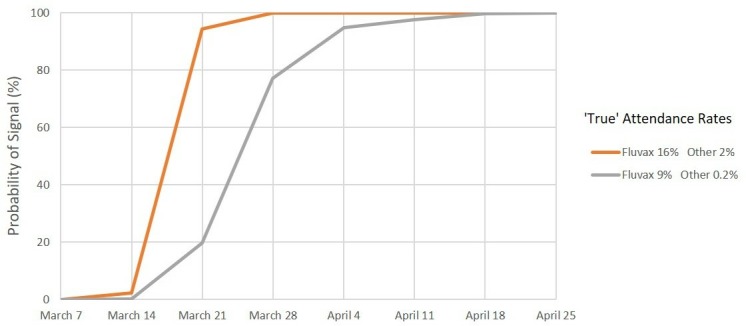
Signal detection for medical attendance, 2010. Percentage of simulations resulting in a signal by date. Scenario 2: Expected rate 4% and maximum acceptable rate 8%.
Figure 6.
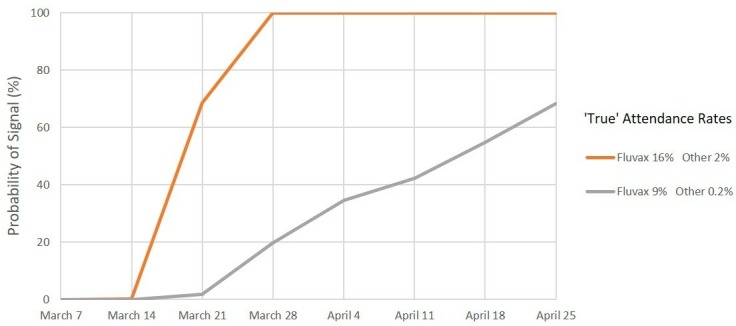
Signal detection for medical attendance, 2010. Percentage of simulations resulting in a signal by date. Scenario 3: Expected rate 6% and maximum acceptable rate 10%.
For MA, under scenario 1 (figure 4), we predict a >99% probability of a safety signal on or before the end of week 3 (28 March) and a >95% probability of a signal at or before the end of week 2 (21 March) for both combinations of values of the ‘true’ MA rate. Under scenarios 2 and 3 (figures 5 and 6), we again predict a >99% probability of a safety signal at or before the end of week 3 (28 March) if the ‘true’ MA rates were at the estimated levels for each vaccine brand. However, if the ‘true’ rates were at the lower confidence limits, a 99% probability of a MA safety signal is not exceeded until the end of week 6 (18 April) for scenario 2 whereas for scenario 3 there is only a 68% probability of a signal at or before the end of week 7 (25 April).
Discussion
Our simulations provide confidence in the timeliness and sensitivity of the AusVaxSafety active vaccine safety surveillance system. We have shown that AusVaxSafety signal detection as it currently operates would have, in all likelihood, delivered a safety signal during March 2010, the first month of vaccine deployment, based on solicited reports of fever and MA following influenza vaccination administered to WA children 6 months to <5 years of age. We have examined a number of scenarios, but even the most conservative of these indicates that a signal would have been generated, on the basis of reported either fever or MA, by 28 March 2010, 4 weeks before distribution of vaccine was suspended by the Australian regulator on 23 April. In the intervening period (28 March to 23 April), there were more than 50 further presentations to WA emergency departments for febrile convulsions associated with Fluvax5 and the highly publicised death of a 1 year-old child with febrile convulsions on 8 April.19
There are limitations to AusVaxSafety’s surveillance. The system is reliant on solicited self-reports of adverse events. Nevertheless, so long as there is consistency in how events are self-reported over time, these data are still likely to be reliable for detecting safety signals and will contribute to our understanding of the comparative safety profile of each vaccine. The system only asks about AEFI occurring within days of vaccination and may miss other potential safety signals that occur after a longer interval post-vaccination. However, AusVaxSafety was specifically designed to monitor AEFI occurring very soon after vaccination, in response to the 2010 influenza vaccine safety incident.
This study is, unavoidably, hypothetical in nature and required a number of assumptions. We have made assumptions about the expected and maximum acceptable AEFI rates that the 2010 system would have employed and the number of weekly reports that would have been available to the surveillance system. Also the available estimates of actual AEFI rates in 2010 are based on retrospective recall and limited samples. In particular, the MA data18 were collected from a sample of children with high rates of chronic comorbidity who may have had a higher rate of MA than the general population. To counter this, we have included conservative estimates of the various parameters which would have reduced the sensitivity of the system and resulted in safety signals being delayed.
Vaccine hesitancy and public concern about vaccine safety is a global issue. In Australia, consumer confidence in influenza vaccination diminished after the safety issues with the 2010 influenza vaccine in children.8 Actively seeking the input of consumers renders the gathering of AEFI data accessible to the public and potentially increases trust. By having active surveillance, which directly surveys the consumers in near real time and makes the results publicly available, active surveillance systems address transparency concerns and contribute to public confidence in the whole immunisation programme.2
Although we cannot know for certain how events would have unfolded had AusVaxSafety been operating in 2010, timely detection of a statistically robust safety signal would likely have resulted in a rapid determination of cause and, assuming prompt action by the relevant authorities, an early suspension of the use of Fluvax in young children while allowing the vaccination programme to continue using the alternative seasonal influenza vaccine. Fewer febrile convulsions and hospitalisations would have occurred and, ultimately, confidence in seasonal influenza vaccination for young children may have been maintained. Our work demonstrates the importance of active AEFI surveillance in supporting state-based and national immunisation programmes.
Supplementary Material
Acknowledgments
This manuscript was written on behalf of the AusVaxSafety Expert Leadership Group: Kristine Macartney, Christopher C Blyth, Jim Buttery, Nigel Crawford, Paul Effler and Nicholas Wood. We thank the AusVaxSafety Expert Leadership Group Members for their oversight of the AusVaxSafety system.
Footnotes
Contributors: PJ was responsible for all data analyses and for drafting and finalising the manuscipt. CG, CD, AP and AL were integral to the design and development of the AusVaxSafety vaccine safety surveillance system and, together with PF, provided essential advice on data inputs. TS, DD and MSG were responsible for the conception of the study and served as key vaccine safety experts. All authors made substantial contributions to the interpretation of the simulation results and their implications and revised the manuscript critically for important intellectual content. All authors had final approval of the version to be published.
Funding: AusVaxSafety was funded under a contract with the Department of Health, Australian Government.
Competing interests: All authors are either located at organisations that hold the AusVaxSafety contract from the Australian Government Department of Health or subcontract holders.
Patient consent for publication: Not required.
Ethics approval: The AusVaxSafety surveillance system and its data monitoring platforms operate nationally under human research ethical approval obtained from the Sydney Children’s Hospital Network (HREC/16/SCHN/19) and the Royal Australian College of General Practitioners National Research and Evaluation Ethics Committee (NREEC15-007).
Provenance and peer review: Not commissioned; externally peer reviewed.
Data availability statement: All data relevant to the study are included in the article or uploaded as supplementary information.
References
- 1. Crawford NW, Clothier H, Hodgson K, et al. Active surveillance for adverse events following immunization. Expert Rev Vaccines 2014;13:265–76. 10.1586/14760584.2014.866895 [DOI] [PubMed] [Google Scholar]
- 2. Cashman P, Macartney K, Khandaker G, et al. Participant-centred active surveillance of adverse events following immunisation: a narrative review. Int Health 2017;9:164–76. 10.1093/inthealth/ihx019 [DOI] [PMC free article] [PubMed] [Google Scholar]
- 3. Gold MS, Effler P, Kelly H, et al. Febrile convulsions after 2010 seasonal trivalent influenza vaccine: implications for vaccine safety surveillance in Australia. Med J Aust 2010;193:492–3. 10.5694/j.1326-5377.2010.tb04029.x [DOI] [PubMed] [Google Scholar]
- 4. Blyth CC, Currie AJ, Wiertsema SP, et al. Trivalent influenza vaccine and febrile adverse events in Australia, 2010: clinical features and potential mechanisms. Vaccine 2011;29:5107–13. 10.1016/j.vaccine.2011.05.054 [DOI] [PubMed] [Google Scholar]
- 5. Armstrong PK, Dowse GK, Effler PV, et al. Epidemiological study of severe febrile reactions in young children in Western Australia caused by a 2010 trivalent inactivated influenza vaccine. BMJ Open 2011;1:e000016 10.1136/bmjopen-2010-000016 [DOI] [PMC free article] [PubMed] [Google Scholar]
- 6. Horvath J. Review of the management of adverse events associated with Panvax and Fluvax. Department of Health and Ageing, 2011. [Google Scholar]
- 7. Duffy J, Weintraub E, Hambidge SJ, et al. Febrile seizure risk after vaccination in children 6 to 23 months. Pediatrics 2016;138:e20160320 10.1542/peds.2016-0320 [DOI] [PMC free article] [PubMed] [Google Scholar]
- 8. Blyth CC, Richmond PC, Jacoby P, et al. The impact of pandemic A(H1N1)pdm09 influenza and vaccine-associated adverse events on parental attitudes and influenza vaccine uptake in young children. Vaccine 2014;32:4075–81. 10.1016/j.vaccine.2014.05.055 [DOI] [PubMed] [Google Scholar]
- 9. Leeb A, Regan AK, Peters IJ, et al. Using automated text messages to monitor adverse events following immunisation in general practice. Med J Aust 2014;200:416–8. 10.5694/mja13.11166 [DOI] [PubMed] [Google Scholar]
- 10. Cashman P, Moberley S, Dalton C, et al. Vaxtracker: active on-line surveillance for adverse events following inactivated influenza vaccine in children. Vaccine 2014;32:5503–8. 10.1016/j.vaccine.2014.07.061 [DOI] [PubMed] [Google Scholar]
- 11. Pillsbury AJ, Glover C, Jacoby P, et al. Active surveillance of 2017 seasonal influenza vaccine safety: an observational cohort study of individuals aged 6 months and older in Australia. BMJ Open 2018;8:e023263 10.1136/bmjopen-2018-023263 [DOI] [PMC free article] [PubMed] [Google Scholar]
- 12. Pillsbury A, Quinn H, Cashman P, et al. Active SMS-based influenza vaccine safety surveillance in Australian children. Vaccine 2017;35:7101–6. 10.1016/j.vaccine.2017.10.091 [DOI] [PubMed] [Google Scholar]
- 13. Pillsbury A, Cashman P, Leeb A, et al. Real-time safety surveillance of seasonal influenza vaccines in children, Australia, 2015. Euro Surveill 2015;20 10.2807/1560-7917.ES.2015.20.43.30050 [DOI] [PubMed] [Google Scholar]
- 14. Grigg OA, Farewell VT, Spiegelhalter DJ. Use of risk-adjusted CUSUM and RSPRT charts for monitoring in medical contexts. Stat Methods Med Res 2003;12:147–70. 10.1177/096228020301200205 [DOI] [PubMed] [Google Scholar]
- 15. Li-Kim-Moy J, Yin J, Rashid H, et al. Systematic review of fever, febrile convulsions and serious adverse events following administration of inactivated trivalent influenza vaccines in children. Euro Surveill 2015;20:21159 10.2807/1560-7917.ES2015.20.24.21159 [DOI] [PubMed] [Google Scholar]
- 16. Lambert SB, Chuk L-manR, Nissen MD, et al. Safety and tolerability of a 2009 trivalent inactivated split-virion influenza vaccine in infants, children and adolescents. Influenza Other Respir Viruses 2013;7:676–85. 10.1111/irv.12107 [DOI] [PMC free article] [PubMed] [Google Scholar]
- 17. Nolan T, Richmond PC, McVernon J, et al. Safety and immunogenicity of an inactivated thimerosal-free influenza vaccine in infants and children. Influenza Other Respir Viruses 2009;3:315–25. 10.1111/j.1750-2659.2009.00108.x [DOI] [PMC free article] [PubMed] [Google Scholar]
- 18. Wood N, Sheppeard V, Cashman P, et al. Influenza vaccine safety in children less than 5 years old: the 2010 and 2011 experience in Australia. Pediatr Infect Dis J 2012;31:199–202. 10.1097/INF.0b013e31823d5303 [DOI] [PubMed] [Google Scholar]
- 19. Child's death linked to flu vaccine. Available: https://www.smh.com.au/national/childs-death-linked-to-flu-vaccine-20100426-tm6t.html
Associated Data
This section collects any data citations, data availability statements, or supplementary materials included in this article.


