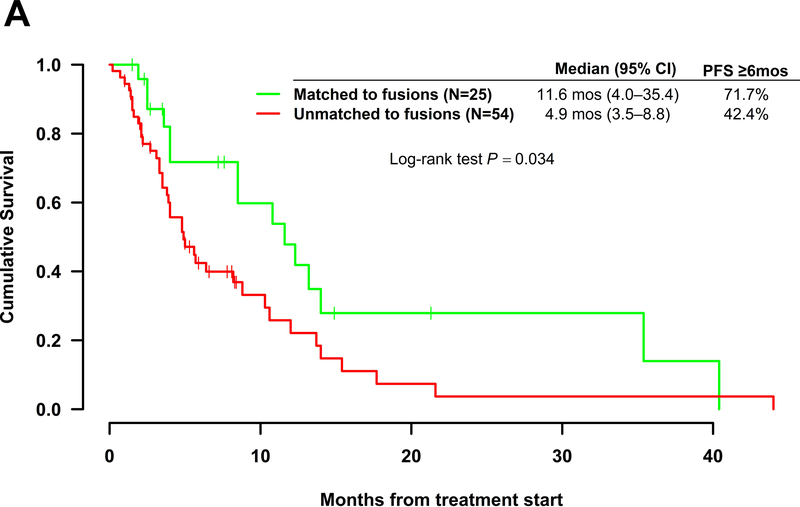
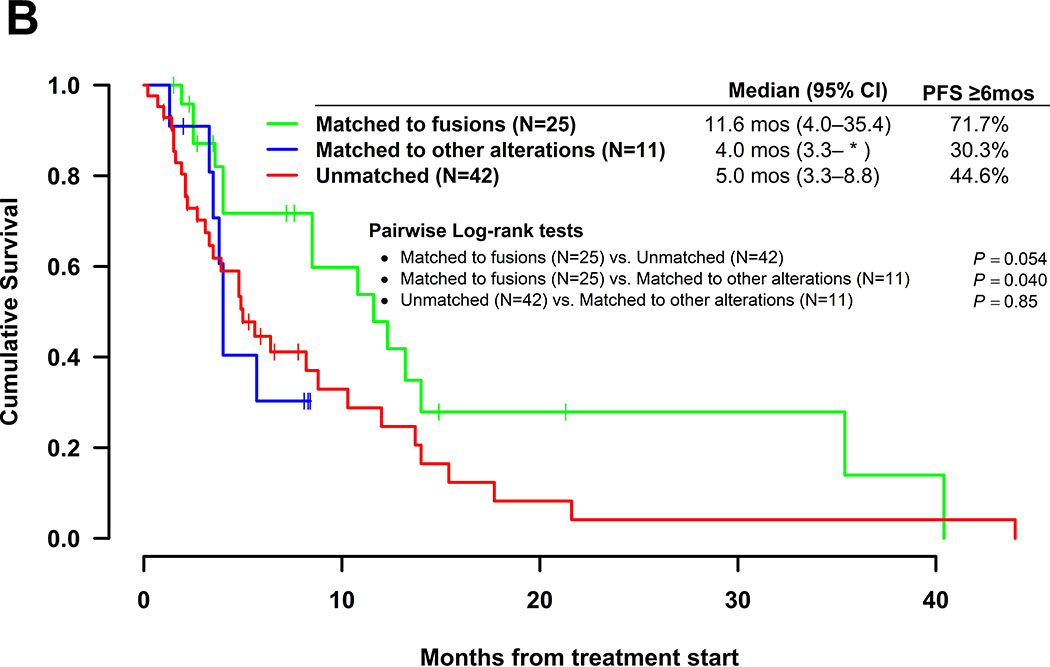
Figure 2.
Kaplan Meir curves for progression-free survival. All patients harbored tumors bearing fusion mutations and received systemic therapies (N=79). A. Therapy matched to fusion alteration (N=25) vs. therapy unmatched to fusion alteration (N=54). B. Pairwise comparisons for patients on therapies matched to fusion alteration (N=25) vs. therapies matched to a non-fusion alteration (N=11) vs. unmatched therapies (N=42). One patient in the matched group had an unclear match and was excluded from the pairwise comparison analysis. *Upper limit of 95% confidence interval was not estimable.


