

Abstract
Background and Purpose:
Loss of cerebral autoregulation in the acute phase of ischemic stroke leaves patients vulnerable to blood pressure (BP) changes. Effective BP management after endovascular therapy (EVT) may protect the brain from hypo- or hyperperfusion. In this observational study, we compared personalized, autoregulation-based BP targets to static systolic blood pressure (SBP) thresholds.
Methods:
We prospectively enrolled 90 patients undergoing EVT for stroke. Autoregulatory function was continuously measured by interrogating changes in near-infrared spectroscopy-derived tissue oxygenation (a cerebral blood flow surrogate) in response to changes in mean arterial pressure (MAP). The resulting autoregulatory index was used to trend the BP range at which autoregulation was most preserved. Percent time that MAP exceeded the upper limit of autoregulation (ULA) or decreased below the lower limit of autoregulation (LLA) was calculated for each patient. Time above fixed SBP thresholds was computed in a similar fashion. Functional outcome was measured with the modified Rankin Scale (mRS) at 90 days.
Results:
Personalized limits of autoregulation (LA) were successfully computed in all 90 patients (age 71.6±16.2, 47% female, mean NIHSS 13.9±5.7, monitoring time 28.0±18.4 hours). Percent time with MAP above the ULA associated with worse 90-day outcomes (OR per 10% 1.84, 95% CI 1.3–2.7, P=0.002), and patients suffering from hemorrhagic transformation spent more time above the ULA (10.9% vs. 16.0%, P=0.042). While there appeared to be a non-significant trend towards worse outcome with increasing time above SBP thresholds of 140 mmHg and 160 mmHg, the effect sizes were smaller compared to the personalized approach.
Conclusions:
Non-invasive determination of personalized BP thresholds for stroke patients is feasible. Deviation from these limits may increase risk of further brain injury and poor functional outcome. This approach may present a better strategy compared to the classical approach of maintaining SBP below a pre-determined value, though a randomized trial is needed to determine the optimal approach for hemodynamic management.
Keywords: Stroke, Blood Pressure, Thrombectomy, Brain Ischemia
Subject terms: Cerebrovascular Disease/Stroke, Ischemic Stroke, Revascularization, Blood Pressure
Background and Purpose
Endovascular thrombectomy (EVT) is now considered standard of care for patients with stroke from large-vessel intracranial occlusion (LVO).1–4 However, many patients with LVO stroke have poor functional outcome despite successful EVT.5 Loss of cerebral autoregulation in the acute phase of stroke leaves patients vulnerable to changes in blood pressure (BP) with consequent neurologic worsening from hypo- or hyperperfusion.6 Observational studies have found increased rates of hemorrhagic transformation (HT) and worse outcomes in patients with higher peak systolic blood pressure (SBP) values or hemodynamic variability in the first 24 hours after EVT, suggesting that BP optimization may represent a neuroprotective strategy.7,8 Current guidelines recommend a BP <180/105 mmHg for at least 24 hours after EVT but acknowledge the lack of randomized trials on this aspect of management. Following reperfusion, lower BP targets may be warranted to prevent reperfusion injury and promote penumbral recovery, but optimal targets remain unclear, and individual patient factors such as degree of reperfusion, infarct size, and hemodynamic status may need to be considered. As a result, there is considerable practice variation in post-EVT BP management within the United States.9
Prior work has shown that near-infrared spectroscopy (NIRS) monitoring can be used to identify and track a dynamic BP range in individual patients at which autoregulation is optimally functioning.10 Such an autoregulation-derived, personalized BP range may provide a favorable physiologic environment for the injured brain.
In this study, we compared personalized, autoregulation-guided BP management with two commonly used clinical approaches: (1) maintaining BP below a fixed, pre-determined value as recommended by current guidelines and (2) stratifying BP thresholds based on reperfusion status. We evaluated the association between deviating from these BP targets on radiographic as well as clinical outcomes.
Methods
The authors declare that all supporting data are available within the article and its online supplementary files.
Study design and subjects
This was a single-center, prospective cohort study. All patients presenting to the Yale-New Haven Hospital Emergency Department with the diagnosis of acute anterior circulation LVO stroke were screened. Patients older than 18 years were eligible for enrollment if they underwent EVT, had MRI or CT contrast imaging obtained before EVT, and optimal BP monitoring could be initiated within 12 hours of procedure completion. History of prior stroke within the last 3 months or a baseline modified Rankin scale (mRS) ≥3 were exclusion criteria. All stroke management decisions including post-procedural BP targets were made by the patients’ clinical care team in accordance with current American Heart Association (AHA) guidelines.11 Approval for the study was obtained from the local institutional review board. All patients or their legally authorized representatives provided written informed consent.
Near-infrared spectroscopy
The Casmed Foresight Elite monitor (Casmed, USA) was used to monitor oxygenated and deoxygenated hemoglobin concentrations. Two adhesive NIRS probes were placed on the frontotemporal scalp covering cortex usually supplied by the middle cerebral artery. (Supplemental Image I) The ratio of oxygenated hemoglobin to total hemoglobin (tissue oxygenation index, TOI) has been shown to replicate changes in cerebral blood flow. This measure is unaffected by extracranial circulation, cranial thickness, concentration of hemoglobin, as well as the underlying cerebrospinal fluid.12,13 Autoregulatory function can be measured by interrogating changes in the NIRS-derived TOI in response to arterial BP fluctuations. Arterial BP was monitored invasively with a radial or femoral artery catheter. NIRS and BP data were collected continuously for up to 48 hours after EVT. All signals were sampled at a frequency of 200Hz using ICM+ software (Cambridge, UK; Supplemental Image II).
Calculation of autoregulatory indices
Continuous recordings of arterial BP and cerebral blood flow demonstrate spontaneous oscillations, and their relationship can be characterized using time-correlation analysis. First, the two signals were subjected to a 10-second average filter. Then, the tissue oxygenation autoregulatory index (TOx) was computed as a moving correlation coefficient between 30 consecutive time-averaged values of mean arterial pressure (MAP) and corresponding TOI signals. The index was updated every 10 seconds when a new set of hemodynamic variables was added, such that the 30 most recent samples of mean TOI were correlated with 30 samples of mean MAP. In this way, a continuous time-trend of autoregulatory function was calculated for each patient.14–16 MAP has a near-zero or negative correlation with TOI when autoregulation is intact with pressure-reactive cerebral blood flow and volume. In contrast, MAP positively correlates with TOI when autoregulation is impaired, signifying that fluctuations in systemic pressure are able to transmit passively into the cerebral circulation.
Calculation and continuous trending of optimal blood pressure and limits of autoregulation
For the determination of optimal mean arterial pressure (MAPOPT) on an individual basis, a BP trend was recorded alongside the autoregulatory index TOx. The range of an individual’s BP over a 4-hour monitoring period was divided into sections of 5mmHg (e.g., 60–65mmHg); corresponding TOx values were averaged within these groups.17 Using ICM+ software, a parabolic curve was fitted to the binned blood pressure data to identify the MAP with the lowest associated TOx value.18 Figure 1 demonstrates the generation of the optimal BP range in an individual patient. The MAPOPT is the nadir of this curve, which corresponds to the midpoint of the classic autoregulatory curve. Limits of autoregulation (LA) were estimated by applying a threshold for impaired autoregulation (TOx=+0.3)16,19,20. The BP at which TOx crosses this threshold (autoregulation shifting from functional to impaired) yields lower and upper limits of autoregulation (LLA, ULA), corresponding to the region of the autoregulatory curve where cerebral blood flow passively follows changes in systemic pressure. Using a moving 4-hour window that was updated every 1-minute, a continuous time trend of MAPOPT and LA was recorded. In each patient, we calculated the percent time MAP was below the LLA (%time<LLA), within LA, and above the ULA (%time>ULA).
Figure 1. Calculating optimal blood pressure and limits of autoregulation.
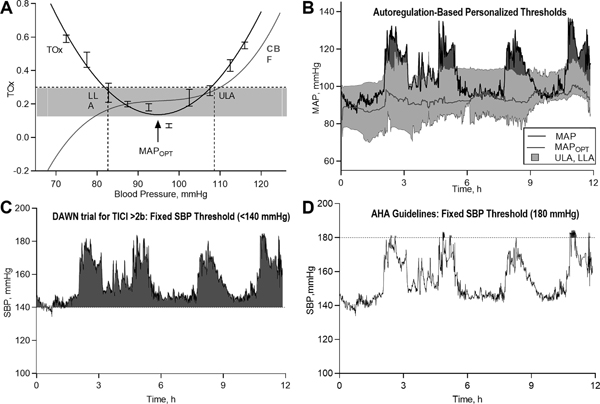
Time-correlation analysis allowed for the calculation of a moving Pearson correlation coefficient between continuous recordings of mean arterial pressure (MAP) and the NIRS-derived tissue oxygenation index (TOI). The resultant tissue oxygenation autoregulatory index (TOx), derived as said rolling coefficient between 30 successive, time-averaged values of MAP and TOI, can then be displayed as a time series alongside MAP and TOI (not shown). Limits of autoregulation (Panel A) were subsequently calculated by dividing MAP values into groups of 5mmHg and plotting them against corresponding TOx indices, resulting in a characteristic U-shaped curve. After superimposing a threshold for impaired autoregulation (TOx=+0.30), intersecting MAP values provide estimates of the lower and upper limits of autoregulation (LLA, ULA), which correspond to the inflection points of the classic autoregulatory curve (red line, CBF=cerebral blood flow). In Panel C, a continuous time trend of optimal MAP (red line), ULA and LLA (red lines surrounding MAPOPT) can be calculated in this manner, while superimposing the patient’s real-time MAP (black line). This trend provides clinicians with a dynamically updating, visual blood pressure target, and areas of relative hypo- or hyperperfusion can be readily interpreted at the bedside (see highlighted red areas between patient’s MAP and ULA, signifying periods in which the patient exceeded personalized limits of autoregulation). This approach can be compared to the current approach to systolic blood pressure (SBP) management, whereby clinicians titrate SBP below certain thresholds, disregarding individual factors like cerebral autoregulation. Panels C and D display the same patient’s blood pressure recording over a 12-hour period; while SBP oscillated below fixed systolic targets of 180 mmHg, as currently recommended, it is clear that the patient’s MAP frequently exceeded personalized targets, potentially rendering an injured brain vulnerable to further damage from relative hyperperfusion. In contrast, the patients SBP was above the SBP threshold of 140 mmHg during periods where his MAP was within limits of autoregulation and further lowering of BP in that setting may result in cerebral hypoperfusion.
Static Blood Pressure Thresholds
To compare our model of identifying optimal BP targets with a more pragmatic approach, we chose several fixed SBP thresholds, including thresholds commonly used in clinical practice,21 in recent EVT trials,4,22 or those recommended by current guidelines.11 We calculated the percent of time that SBP exceeded fixed thresholds of 140 mmHg, 160 mmHg, and 180 mmHg. We applied these thresholds either to the entire group of patients, or to groups stratified by reperfusion status, with lower BP for patients who achieved successful reperfusion (TICI 2b or 3). For the latter tiered approach, we applied BP parameters of <140 mmHg vs. <185 mmHg and <160 mmHg vs. <185 mmHg that were used in the DAWN (DWI or CTP Assessment with Clinical Mismatch in the Triage of Wake Up and Late Presenting Strokes Undergoing Neurointervention) and REVASCAT (Revascularization with Solitaire FR Device versus Best Medical Therapy in the Treatment of Acute Stroke Due to Anterior Circulation Large Vessel Occlusion Presenting within Eight Hours of Symptom Onset) clinical trials, respectively.4,22
Clinical Outcomes
Functional outcome was measured using the mRS at discharge and 90 days. Unfavorable outcome was defined as mRS >2. Endpoints were determined via telephone interview at 3 months by a research associate blinded to monitoring results. We also assessed for shifts across the mRS range.23
Radiographic Outcomes
All patients underwent repeat CT imaging at 24 hours as part of routine clinical care. HT has been associated with poor outcome after EVT.24 We classified HT using the European Cooperative Acute Stroke Study (ECASS) scale25 and divided patients into three groups: no HT, hemorrhagic infarction (HI), and parenchymal hematoma (PH). HT was further classified as symptomatic (sICH) if the hemorrhage was associated with a clinical worsening or an increase of ≥4 points on the NIHSS, as commonly defined.2–4
Statistical analysis
Baseline characteristics of included subjects were summarized by means and standard deviations (SD) for normally distributed continuous variables, medians and interquartile ranges (IQR) for skewed continuous variables, and numbers (%) for categorical variables. We dichotomized mRS scores into favorable (mRS 0–2) and unfavorable (mRS ≥3) outcomes. We used - or Fisher’s exact tests, t- or Mann-Whitney U tests, and Kruskal-Wallis tests as appropriate for unadjusted comparisons. We performed adjusted analyses via ordinal, binary logistic, or linear regression modeling, as appropriate. We accounted for common confounders and known predictors of outcome after LVO stroke, including age, admission NIHSS, Alberta Stroke Program Early CT (ASPECT) score, and thrombolysis in cerebral infarction (TICI) score. All statistics were computed using SPSS (Version 24, IBM Corp). Statistical significance was set at P<.05 (two-tailed) for all analyses, including the primary hypothesis that percent time above fixed thresholds or outside of dynamic BP targets correlate with functional outcome.
Results
Subject characteristics
Ninety patients were initially enrolled in the study (Table 1). Twelve patients were excluded from analysis due to insufficient monitoring time (n=6), poor signal quality (n=5), and early withdrawal of care (n=1). The mean monitoring time was 28.0±18.4 hours. Optimal BP and limits of autoregulation could be calculated for mean of 83.2±14.7% of the total monitoring period. Patients spent a mean of 65.7±22.9% of their monitored time within personalized limits of autoregulation (Supplemental Table I).
Table 1.
Demographic and baseline characteristics.
| Total patients | 90 |
| 90-day outcomes, n (%) | 78 (86.7) |
| Sex, F (%) | 42 (46.7) |
| Age, mean ± SD | 71.6 ± 16.2 |
| Race White Black or African American Hispanic Asian |
72 (80.0) 10 (11.1) 7 (7.8) 1 (1.1) |
| Admission NIHSS, mean ± SD | 13.9 ± 5.7 |
| Admission ASPECTS, mean ± SD | 8.8 ± 1.6 |
| Admission MAP, mean ± SD | 107.3 ± 17.2 |
| Admission Glucose, mean ± SD | 137.3 ± 68.3 |
| Affected Side, Left (%) | 45 (50.0) |
| Occlusion on Angiography*, n (%) ICA tICA ACA ACA+MCA M1 MCA M2 |
5 (5.6) 11 (12.2) 0 (0) 3 (3.3) 43 (47.8) 28 (31.1) |
| Medical History*, n (%) Hypertension Coronary Artery Disease Myocardial Infarction Congestive Heart Failure Atrial Fibrillation Hyperlipidemia Diabetes Mellitus (I & II) Ischemic Stroke Cancer Thyroid Disease Current Smoker Past Smoker |
65 (72.2) 11 (12.2) 6 (6.7) 10 (11.1) 47 (52.2) 36 (40.0) 20 (22.2) 17 (18.9) 14 (15.6) 9 (10.0) 19 (21.1) 19 (21.1) |
| Treated with tPA, n (%) | 38 (42.2) |
| Mean time to reperfusion (minutes), mean ± SD | 575.98 (407.7) |
| Successful recanalization, n (%) | 67 (74.4) |
| TICI Score, n (%) 0 1 2a 2b 3 |
15 (16.7) 3 (3.3) 6 (6.7) 41 (45.6) 25 (27.8) |
| Hemorrhagic transformation, n (%) HI I HI II PH I PH II None |
18 (20.0) 9 (10.0) 7 (7.8) 5 (5.6) 51 (56.7) |
| Symptomatic hemorrhagic transformation, n (%) | 8 (8.9) |
| Cerebral edema, n (%) | 10 (11.1) |
| Patients with 90-day outcomes, n (%) | 53 (81.5) |
| In-hospital mortality, n (%) | 14 (15.6) |
| 90-day mortality, n (%) | 23 (25.6) |
Data are mean (SD) and n (%). SD, standard deviation; NIHSS = National Institutes of Health Stroke Scale; ASPECTS = Alberta Stroke Program Early CT Score; MAP, mean arterial pressure; ICA, internal carotid artery; tICA, terminal internal carotid artery; ACA, anterior cerebral artery; MCA, middle cerebral artery; tPA, alteplase; TICI = thrombolysis in cerebral infarction score; HI = hemorrhagic infarction, PH = parenchymal hematoma.
Percentages may add up to more than 100% due to comorbidity.
Blood pressure, limits of autoregulation, and functional outcome
Twenty-seven (30%) patients achieved functional independence (mRS 0–2) at 3 months. Patients with good outcome were younger (63 vs. 77 years, P<0.001) and had lower admission NIHSS scores (12 vs. 16, P=0.001). They also had lower rates of HT (25.9% vs. 58.0%, P=0.007), had smaller final infarct volumes (35.4 vs. 106.5 mL, P<0.001), and experienced less infarct progression (32.8 vs. 103.2 mL, P=0.001). The average percent time spent within autoregulatory limits among patients with favorable outcomes was 79.0±12.4% compared to 60.0±24.1% among patients with unfavorable outcomes (P<0.001; Supplemental Table II).
Results of the univariate analysis of predictors of functional outcome at discharge and 90 days are presented in Supplemental Tables III&IV. After adjusting for age, admission NIHSS, ASPECT score, and degree of reperfusion, %time>ULA was independently associated with higher (worse) mRS scores at discharge (adjusted OR per 10% time>ULA 1.53, 95% CI 1.13–2.07, P=0.006) and at 90 days (adjusted OR per 10% time>ULA 1.91, 95% CI 1.29–2.84, P=0.001; Table 2, Figure 2A&B). While we observed no significant association between %time<LLA and functional outcome, there was a general trend toward decreasing time within limits of autoregulation with higher scores on the mRS scale (Supplemental Figure I).
Table 2.
Association of hemodynamic variables with functional outcome.
| Likelihood of a shift towards worse outcome on discharge mRS | ||||||
| Variables | OR | 95% CI | p Value | aOR | 95% CI | p Value |
| %time MAP>ULA, per 10-percent | 1.5 | 1.1–2.1 | 0.005 | 1.53 | 1.13–2.07 | 0.006 |
| %time SBP>160, per 10-percent | 1.1 | 1.0–1.3 | 0.148 | 1.1 | 0.9–1.3 | 0.272 |
| %time SBP>180, per 10-percent | 1.2 | 0.9–1.5 | 0.268 | 1.2 | 0.9–1.6 | 0.162 |
| %time SBP>DAWN threshold | 1.0 | 0.9–1.1 | 0.988 | 0.9 | 0.9–1.2 | 0.699 |
| Likelihood of a shift towards worse outcome on 90-day mRS | ||||||
| Variables | OR | 95% CI | p Value | aOR | 95% CI | p Value |
| %time MAP>ULA, per 10-percent | 1.84 | 1.3–2.7 | 0.002 | 1.91 | 1.29–2.84 | 0.001 |
| %time SBP>160, per 10-percent | 1.2 | 1.0–1.4 | 0.050 | 1.1 | 0.9–1.3 | 0.239 |
| %time SBP>180, per 10-percent | 1.0 | 0.74–1.4 | 0.929 | 0.9 | 0.6–1.2 | 0.498 |
| %time SBP>DAWN threshold | 1.1 | 1.0–1.2 | 0.311 | 1.0 | 0.9–1.2 | 0.549 |
aOR, adjusted odd ratio (adjusted for age, admission NIHSS, ASPECT score, and TICI score); OR, odds ratio; MAP, mean arterial pressure; mRS, modified Rankin scale; ULA, upper limit of autoregulation; LA, limits of autoregulation; LLA, lower limit of autoregulation; CI, confidence interval.
Figure 2. Associations of individualized limits of autoregulation with functional outcome at discharge and 90 days, hemorrhagic transformation, and infarct volume.
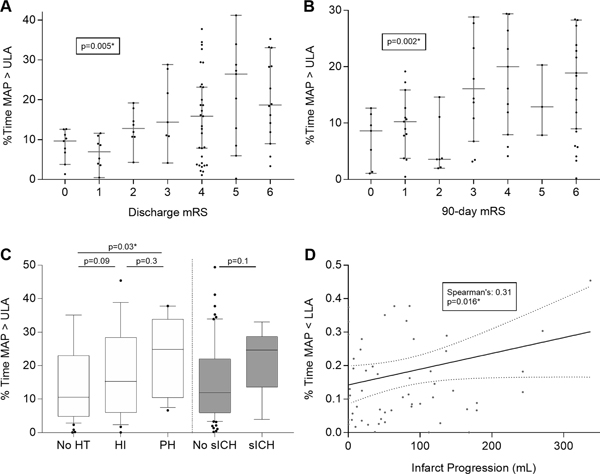
Percent time spent above ULA was plotted as medians with 95% confidence intervals per each mRS score at discharge and 90 days (Panel A&B). Panel C shows the %time MAP>ULA among degrees of hemorrhagic transformation (HT) and symptomatic intracerebral hemorrhage (sICH). Final infarct volume did not correlate with percent time spent below LLA in the subgroup of patients who did not achieve reperfusion (TICI 0, 1 or 2a), nor in those patients who did achieve recanalization (Panel D). * denotes statistical significance.
Exceeding the upper limit of autoregulation and risk of hemorrhagic transformation
HT was seen in 39 (43.3%) of patients and was overall associated with poor outcome. We observed a progressive increase in %time>ULA with worsening grades of HT (11.4% for no HT, 13.5% for HI1&2, and 20.9% for PH1&2; P=0.03; Figure 2C). In addition, patients who developed sICH appeared to spend more time above the ULA when compared to patients without sICH (11.9% vs. 24.6%, P=0.1).
Blood pressure below the lower limit of autoregulation and infarct progression
In the subgroup of patients with baseline CT perfusion imaging, we calculated infarct progression by measuring final infarct volume on CT or MRI at 36–48 hours and subtracting the core infarct on admission. In this subgroup, we observed a significant bivariate correlation between infarct progression and %time<LLA (Spearman’s coefficient 0.31, P=0.016; Figure 2D).
Association between SBP above fixed thresholds with HT and functional outcome
Time spent above fixed SBP thresholds gradually decreased for increasing BP levels. On average patients spent 81.8±24.1% of their monitoring time above 120 mmHg compared to only 6.0±14.7% above 180 mmHg. Using the tiered approach with SBP targets stratified by reperfusion status, patients spent on average 40.3%±35.4% and 17.2%±23.7% of the monitoring time above respective thresholds used in the DAWN and REVASCAT trials (Supplemental Table III). There was no significant association between time spent above any of the fixed SBP thresholds and HT, sICH or functional outcome (Supplemental Tables III–V).
Discussion
In this study of 90 patients with LVO stroke undergoing thrombectomy, we showed that continuous estimation of optimal blood pressure and limits of cerebral autoregulation is feasible. We further demonstrated that exceeding individual and flexible thresholds of autoregulation is associated with hemorrhagic transformation and overall worse functional outcome, even after adjusting for important prognostic covariates in stroke. Every 10% increase in time spent above ULA was associated with a 1.9-fold increase in the odds of shifting towards a worse outcome on the mRS at 90 days. We did not find this association when applying fixed blood pressure thresholds, even when stratifying by reperfusion status.
To date, there are no randomized controlled trials of optimal blood pressure management after EVT, and data to guide treatment approaches are limited. The majority of patients enrolled in recent thrombectomy trials also received intravenous tPA and were managed according to current guidelines with blood pressure below 180/105mmHg for 24 hours.1–3,11,26 However, recanalization rates with EVT are much higher compared to intravenous thrombolysis alone, and it remains unclear if the same BP targets apply. While a higher BP may be acceptable or even beneficial in patients with incomplete reperfusion by promoting perfusion to ischemic territories, it could lead to relative hyperperfusion with consequent cerebral edema and hemorrhage in those patients with complete reperfusion. This phenomenon is well described in chronic ischemia after carotid revascularization27,28 but may also occur in acute stroke.29
Several thrombectomy trials, therefore, used a tiered approach with lower BP targets if successful reperfusion was achieved.4,22,30 However, we did not find a correlation between BP above these limits and any of our radiographic or clinical outcomes. Optimal BP ranges after EVT are likely influenced by numerous factors, and stratifying by reperfusion status alone may be insufficient. For example, chronic hypertension and flow-limiting extracranial carotid disease can shift a patient’s autoregulatory curve towards higher blood pressures,31,32 and aggressively lowering BP after successful thrombectomy in such a patient may result in cerebral hypoperfusion and infarct expansion. In contrast, optimal BP may shift towards lower targets among patients without a history of hypertension or pre-existing large-vessel disease. Our data also suggests that limits of autoregulation are not static, but rather change over time. Within individual patients the limits of autoregulation varied from 60–108 mmHg and 80–131mmHg for LLA and ULA, respectively (Supplemental Table VI). Thus, maintaining the same BP target throughout the acute phase of ischemic stroke may lead to frequent episodes of hypo- and hyperperfusion. Figure 1 shows an example of a patient whose BP remained below the guideline-recommended target but frequently exceeded personalized autoregulatory limits. In addition, the patient’s BP was above the lower BP threshold of 140 mmHg for almost the entire monitoring period. However, BP lowering in this particular patient may lead to a decrease below the LLA with consequent risk of ischemia. While there appears to be general trend towards worse outcome with increasing time above SBP thresholds of 140 mmHg and 160 mmHg, the effect sizes were much smaller when compared to the personalized, autoregulation-based approach and became non-significant when adjusting for important covariates. These findings suggest that selecting a single BP target for all patients may not sufficiently account for patient-specific factors affecting cerebral perfusion after ischemic stroke. Therefore, taking into consideration individual patients’ hemodynamic physiology and maintaining BP within autoregulatory targets may be a better strategy compared to the classical approach of maintaining SBP below a fixed, pre-determined value.
To explore possible mechanisms underlying the association of BP outside autoregulatory limits and poor outcome, we evaluated several short-term imaging endpoints that have strong associations with outcome after stroke. Time spent above the ULA, but not any of the fixed SBP thresholds, was associated with higher rates of HT. This finding is supported by the construct that above the ULA, cerebral vasculature acts as a pressure-passive system, in which increases in cerebral blood flow are not counteracted by vasoconstriction, resulting in periods of hyperperfusion. Furthermore, higher cerebral blood flow after reperfusion therapy, measured with arterial spin labeling MRI, has been shown to increase risk of HT.33 In addition, several retrospective studies reported an association between elevated BP after thrombectomy and HT,34,35 although others did not find this association.6 Differences in autoregulatory function may be one explanation for conflicting results. In our study, elevated BP relative to each patient’s personalized ULA was associated with increased risk of sICH and neurologic worsening, rather than absolute increased BP alone.
BP management below the LLA was associated with greater infarct progression, suggesting that the sustenance of the ischemic brain tissue may be improved by maintaining cerebral perfusion above the LLA. In addition to subtotal reperfusion and autoregulatory impairment, microcirculatory dysfunction and distal embolization are possible mechanisms that also may increase vulnerability to relative hypoperfusion.36,37
This study has several important limitations. First, the sample size was modest, and while the study was significant for its primary outcome, we were not able to adjust for all predictors of poor outcome. The addition of short-term radiographic endpoints and a plausible biological mechanism help to overcome this limitation. Second, 12 patients who were enrolled toward the beginning of our study had to be excluded from analysis due to insufficient recording time or poor signal quality. Technical challenges faced at the beginning of the study have since been overcome. Third, 3-month functional outcomes were available for only 86.7% (78/90) of patients. However, both groups (patients with and without 3-months outcomes) were comparable in terms of baseline characteristics (Supplemental Table VII). Furthermore, a sensitivity analysis imputing 3-month outcomes using the last-observation-carried-forward approach resulted in similar associations and effect sizes between BP targets and outcome (Supplemental Table VIII). Finally, information produced from this study is descriptive and correlational; causation cannot be inferred. Conclusions about whether an autoregulation-guided therapy protocol will improve patient physiology or outcome are not possible at this stage.
Future directions in this area of research should include a feasibility trial of personalized blood pressure management targeting a dynamic MAPOPT. Such a study would need to evaluate if blood pressure interventions during periods of dyautoregulation can restore autoregulatory function by shifting patients to a more favorable position on the autoregulatory curve, thereby increasing time spent within limits of autoregulation. Parallel lines of inquiry have begun in Europe targeting autoregulation in traumatic brain injury (NCT02982122), further suggesting that this approach is timely and feasible in a multicenter clinical trial.
Conclusion
Continuous estimation of limits of autoregulation after EVT is feasible and provides a BP range for individual patients tailored to their own physiology. Exceeding LA, but not fixed SBP thresholds, was associated with HT as well as overall poor functional outcome. This information is particularly important in the evolving landscape of endovascular treatment approaches, in which more patients will require early management in neurological intensive care units. Further research is needed to test autoregulation-based treatment strategies, including tailored pharmacologic blood pressure augmentation and lowering therapies based on patients’ real-time autoregulatory status.
Supplementary Material
Acknowledgments
Funding
This work was supported by American Heart Association Grant # 17MCPRP33460188/Nils Petersen/2017 and by Clinical and Translational Science Awards (CTSA) Grant # KL2 TR001862 from the National Center for Advancing Translational Science (NCATS), a component of the National Institutes of Health (NIH). Its contents are solely the responsibility of the authors and do not necessarily represent the official view of AHA or NIH.
Disclosures
Dr. Petersen declares no competing interests. Dr. Sheth receives NIH support from U24NS107215, U24NS107136, U01NS106513, R01NR018335, AHA support from 17CSA33550004, and grants from Novartis, Biogen, Bard, Hyperfine and Astrocyte. Dr. Sheth reports equity interests in Alva Health. Dr. Falcone is supported by the National Institutes of Health (K76AG059992, R03NS112859 and P30AG021342), the American Heart Association (18IDDG34280056), the Yale Pepper Scholar Award and the Neurocritical Care Society. Research Fellowship. Dr. Jasne participated in the American Heart Association “Fellows in Training” (FIT) program at the 2017 International Stroke Conference, which was partially sponsored by Medtronic. Dr. Johnson serves on the medical advisory board for IschemiaView Inc.
References
- 1.Saver JL, Goyal M, Bonafe A, Diener H-C, Levy EI, Pereira VM et al. Stent-retriever thrombectomy after intravenous t-PA vs. t-PA alone in stroke. N. Engl. J. Med 2015;372:2285–2295. [DOI] [PubMed] [Google Scholar]
- 2.Berkhemer OA, Fransen PSS, Beumer D, van den Berg LA, Lingsma HF, Yoo AJ et al. A Randomized Trial of Intraarterial Treatment for Acute Ischemic Stroke. N. Engl. J. Med 2015;372:11–20. [DOI] [PubMed] [Google Scholar]
- 3.Campbell BCV, Mitchell PJ, Kleinig TJ, Dewey HM, Churilov L, Yassi N et al. Endovascular therapy for ischemic stroke with perfusion-imaging selection. N. Engl. J. Med 2015;372:1009–1018. [DOI] [PubMed] [Google Scholar]
- 4.Jovin TG, Chamorro A, Cobo E, de Miquel MA, Molina CA, Rovira A et al. Thrombectomy within 8 hours after symptom onset in ischemic stroke. N. Engl. J. Med 2015;372:2296–2306. [DOI] [PubMed] [Google Scholar]
- 5.Goyal M, Menon BK, van Zwam WH, Dippel DWJ, Mitchell PJ, Demchuk AM et al. Endovascular thrombectomy after large-vessel ischaemic stroke: a meta-analysis of individual patient data from five randomised trials. The Lancet. 2016;387:1723–1731. [DOI] [PubMed] [Google Scholar]
- 6.Goyal N, Tsivgoulis G, Pandhi A, Chang JJ, Dillard K, Ishfaq MF et al. Blood pressure levels post mechanical thrombectomy and outcomes in large vessel occlusion strokes. Neurology. 2017;89:540–547. [DOI] [PubMed] [Google Scholar]
- 7.Mistry EA, Mistry AM, Nakawah MO, Khattar NK, Fortuny EM, Cruz AS et al. Systolic Blood Pressure Within 24 Hours After Thrombectomy for Acute Ischemic Stroke Correlates With Outcome. J Am Heart Assoc. 2017;6. [DOI] [PMC free article] [PubMed] [Google Scholar]
- 8.Kim TJ, Park H-K, Kim J-M, Lee JS, Park S-H, Jeong H-B et al. Blood pressure variability and hemorrhagic transformation in patients with successful recanalization after endovascular recanalization therapy: A retrospective observational study. Ann Neurol. 2019;85:574–581. [DOI] [PubMed] [Google Scholar]
- 9.Mistry EA, Mayer SA, Khatri P. Blood Pressure Management after Mechanical Thrombectomy for Acute Ischemic Stroke: A Survey of the StrokeNet Sites. Journal of Stroke and Cerebrovascular Diseases. 2018;27:2474–2478. [DOI] [PubMed] [Google Scholar]
- 10.Petersen NH, Silverman A, Wang A, Strander S, Kodali S, Matouk C et al. F. Association of Personalized Blood Pressure Targets With Hemorrhagic Transformation and Functional Outcome After Endovascular Stroke Therapy. JAMA Neurol. 2019. July 29. doi: 10.1001/jamaneurol.2019.2120. [Epub ahead of print] [DOI] [PMC free article] [PubMed] [Google Scholar]
- 11.Powers WJ, Rabinstein AA, Ackerson T, Adeoye OM, Bambakidis NC et al. , American Heart Association Stroke Council. 2018 Guidelines for the Early Management of Patients With Acute Ischemic Stroke: A Guideline for Healthcare Professionals From the American Heart Association/American Stroke Association. Stroke. 2018;49:e46–e110. [DOI] [PubMed] [Google Scholar]
- 12.Al-Rawi PG, Smielewski P, Kirkpatrick PJ. Evaluation of a near-infrared spectrometer (NIRO 300) for the detection of intracranial oxygenation changes in the adult head. Stroke. 2001;32:2492–2500. [DOI] [PubMed] [Google Scholar]
- 13.Yoshitani K, Kawaguchi M, Miura N, Okuno T, Kanoda T, Ohnishi Y et al. Effects of hemoglobin concentration, skull thickness, and the area of the cerebrospinal fluid layer on near-infrared spectroscopy measurements. Anesthesiology. 2007;106:458–462. [DOI] [PubMed] [Google Scholar]
- 14.Czosnyka M, Piechnik S, Richards HK, Kirkpatrick P, Smielewski P, Pickard JD. Contribution of mathematical modelling to the interpretation of bedside tests of cerebrovascular autoregulation. Journal of Neurology, Neurosurgery & Psychiatry. 1997;63:721–731. [DOI] [PMC free article] [PubMed] [Google Scholar]
- 15.Zweifel C, Castellani G, Czosnyka M, Carrera E, Brady KM, Kirkpatrick PJ et al. Continuous assessment of cerebral autoregulation with near-infrared spectroscopy in adults after subarachnoid hemorrhage. Stroke. 2010;41:1963–1968. [DOI] [PubMed] [Google Scholar]
- 16.Lee JK, Kibler KK, Benni PB, Easley RB, Czosnyka M, Smielewski P et al. Cerebrovascular reactivity measured by near-infrared spectroscopy. Stroke. 2009;40:1820–1826. [DOI] [PubMed] [Google Scholar]
- 17.Steiner LA, Czosnyka M, Piechnik SK, Smielewski P, Chatfield D, Menon DK et al. Continuous monitoring of cerebrovascular pressure reactivity allows determination of optimal cerebral perfusion pressure in patients with traumatic brain injury. Critical Care Medicine. 2002;30:733–738. [DOI] [PubMed] [Google Scholar]
- 18.Aries MJH, Czosnyka M, Budohoski KP, Steiner LA, Lavinio A, Kolias AG, Hutchinson PJ et al. Continuous determination of optimal cerebral perfusion pressure in traumatic brain injury. Critical Care Medicine. 2012;40:2456–2463. [DOI] [PubMed] [Google Scholar]
- 19.Steiner LA, Pfister D, Strebel SP, Radolovich D, Smielewski P, Czosnyka M. Near-infrared spectroscopy can monitor dynamic cerebral autoregulation in adults. Neurocrit Care. 2009;10:122–128. [DOI] [PubMed] [Google Scholar]
- 20.Blaine Easley R, Kibler KK, Brady KM, Joshi B, Ono M, Brown C et al. Continuous cerebrovascular reactivity monitoring and autoregulation monitoring identify similar lower limits of autoregulation in patients undergoing cardiopulmonary bypass. Neurol. Res 2013;35:344–354. [DOI] [PMC free article] [PubMed] [Google Scholar]
- 21.Mannava S, Garg A. E-014 Management of Blood Pressure for Acute Ischemic Stroke in the Modern Era of Mechanical Thrombectomy. J Neurointerv Surg. 2016;8:A51.3–A53. [Google Scholar]
- 22.Nogueira RG, Jadhav AP, Haussen DC, Bonafe A, Budzik RF et al. , DAWN Trial Investigators. Thrombectomy 6 to 24 Hours after Stroke with a Mismatch between Deficit and Infarct. N. Engl. J. Med 2018;378:11–21. [DOI] [PubMed] [Google Scholar]
- 23.Saver JL. Novel End Point Analytic Techniques and Interpreting Shifts Across the Entire Range of Outcome Scales in Acute Stroke Trials. Stroke. 2007;38:3055–3062. [DOI] [PubMed] [Google Scholar]
- 24.Nogueira RG, Gupta R, Jovin TG, Levy EI, Liebeskind DS, Zaidat OO et al. Predictors and clinical relevance of hemorrhagic transformation after endovascular therapy for anterior circulation large vessel occlusion strokes: a multicenter retrospective analysis of 1122 patients. J Neurointerv Surg. 2015;7:16–21. [DOI] [PMC free article] [PubMed] [Google Scholar]
- 25.Fiorelli M, Bastianello S, Kummer von R, del Zoppo GJ, Larrue V, Lesaffre E et al. Hemorrhagic Transformation Within 36 Hours of a Cerebral Infarct : Relationships With Early Clinical Deterioration and 3-Month Outcome in the European Cooperative Acute Stroke Study I (ECASS I) Cohort. Stroke. 1999;30:2280–2284. [DOI] [PubMed] [Google Scholar]
- 26.Albers GW, Marks MP, Kemp S, Christensen S, Tsai JP et al. , DEFUSE 3 Investigators. Thrombectomy for Stroke at 6 to 16 Hours with Selection by Perfusion Imaging. N. Engl. J. Med 2018;378:708–718. [DOI] [PMC free article] [PubMed] [Google Scholar]
- 27.van Mook WNKA, Rennenberg RJMW, Schurink GW, van Oostenbrugge RJ, Mess WH, Hofman PAM et al. Cerebral hyperperfusion syndrome. The Lancet Neurology. 2005;4:877–888. [DOI] [PubMed] [Google Scholar]
- 28.Galyfos G, Sianou A, Filis K. Cerebral hyperperfusion syndrome and intracranial hemorrhage after carotid endarterectomy or carotid stenting: A meta-analysis. Journal of the Neurological Sciences. 2017;381:74–82. [DOI] [PubMed] [Google Scholar]
- 29.Hashimoto T, Matsumoto S, Ando M, Chihara H, Tsujimoto A, Hatano T. Cerebral Hyperperfusion Syndrome After Endovascular Reperfusion Therapy in a Patient with Acute Internal Carotid Artery and Middle Cerebral Artery Occlusions. World Neurosurg. 2018;110:145–151. [DOI] [PubMed] [Google Scholar]
- 30.Goyal M, Demchuk AM, Menon BK, Eesa M, Rempel JL, Thornton J et al. Randomized assessment of rapid endovascular treatment of ischemic stroke. N. Engl. J. Med 2015;372:1019–1030. [DOI] [PubMed] [Google Scholar]
- 31.Strandgaard S. Autoregulation of Cerebral Blood-Flow in Hypertensive Patients - Modifying Influence of Prolonged Antihypertensive Treatment on Tolerance to Acute, Drug-Induced Hypotension. Circulation. 1976;53:720–727. [DOI] [PubMed] [Google Scholar]
- 32.Marshall RS, Pavol MA, Cheung YK, Strom I, Slane K, Asllani I et al. Dissociation among hemodynamic measures in asymptomatic high grade carotid artery stenosis. Journal of the Neurological Sciences. 2016;367:143–147. [DOI] [PMC free article] [PubMed] [Google Scholar]
- 33.Okazaki S, Yamagami H, Yoshimoto T, Morita Y, Yamamoto H, Toyoda K et al. Cerebral hyperperfusion on arterial spin labeling MRI after reperfusion therapy is related to hemorrhagic transformation. Journal of Cerebral Blood Flow & Metabolism. 2017;37:3087–3090. [DOI] [PMC free article] [PubMed] [Google Scholar]
- 34.Mistry EA, Mistry AM, Nakawah MO, Khattar NK, Fortuny EM, Cruz AS et al. Systolic Blood Pressure Within 24 Hours After Thrombectomy for Acute Ischemic Stroke Correlates With Outcome. J Am Heart Assoc. 2017;6:e006167. [DOI] [PMC free article] [PubMed] [Google Scholar]
- 35.Butcher K, Christensen S, Parsons M, de Silva DA, Ebinger M et al. , EPITHET Investigators. Postthrombolysis blood pressure elevation is associated with hemorrhagic transformation. Stroke. 2010;41:72–77. [DOI] [PubMed] [Google Scholar]
- 36.Mori E, del Zoppo GJ, Chambers JD, Copeland BR, Arfors KE. Inhibition of polymorphonuclear leukocyte adherence suppresses no-reflow after focal cerebral ischemia in baboons. Stroke. 1992;23:712–718. [DOI] [PubMed] [Google Scholar]
- 37.Ames A, Wright RL, Kowada M, Thurston JM, Majno G. Cerebral ischemia. II. The no-reflow phenomenon. Am. J. Pathol 1968;52:437–453. [PMC free article] [PubMed] [Google Scholar]
Associated Data
This section collects any data citations, data availability statements, or supplementary materials included in this article.