Abstract
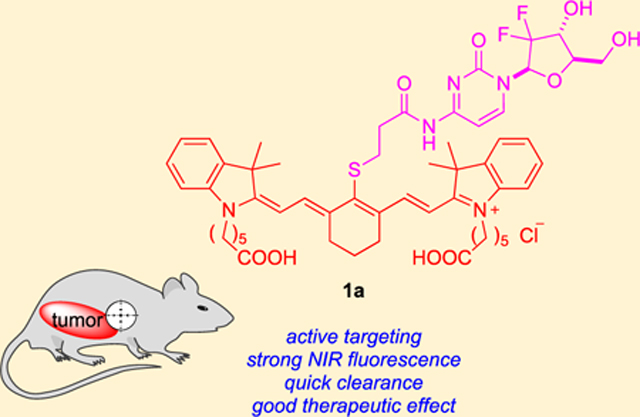
A small subset of heptamethine dyes (cyanine-7 or Cy7) share an intriguing characteristic: preferential tumor accumulation and retention. These dyes absorb in the near-infrared (NIR) region (above 750 nm) and perform active targeting to deliver therapeutic and toxic cargoes to various tumor models in vivo. In this work, four heptamethines 1 were synthesized, which have a gemcitabine fragment attached to the meso-position of the Cy7 core. Theranostic agent 1a was discovered that localized in glioblastoma tumor cells, has absorption maxima in NIR region, and showed similar therapeutic effect to gemcitabine but at one-third the molar dose.
Graphical Abstract
INTRODUCTION
Glioblastoma multiforme (GBM) forms aggressive malignant tumors, and patients with this disease have a 5-year survival rate of only 5.1%.1 There are only four FDA approved drugs for brain tumor therapy: temozolomide (TMZ, 2005),2 lomustine, carmustine, and bevacizumab (2017).3 Combination of TMZ and radiotherapy is the standard of care for GBM, but more effective therapies need to be established since the median survival is 14.6 months, and this requires new strategies to generate preclinical leads.4,5
Gemcitabine (dFdC, or gem) acts against a wide range of solid tumors (FDA approved for breast, non-small-cell lung, ovarian, and pancreatic).4,6 In cells, a triphosphate is formed from this nucleoside, i.e., dFdCTP, which is incorporated into DNA and hence acts as a chain-terminator. Simultaneously, the corresponding diphosphate (dFdCDP) inhibits ribonucleotide reductase (RNR) leading to more favorable gemcitabine/dCTP ratios in cells, improving gemcitabine’s efficacy. Nevertheless, the efficacy of gemcitabine could be improved, especially for GBM.6–9 Gemcitabine has been investigated in preclinical and clinical studies for GBM,4,9 but the therapeutic response tends to be relatively poor for several reasons.4 First, penetration through the blood–brain barrier (BBB) is low, even in the brain-tumor-bearing animals where the BBB may be leaky.10,11 Second, gemcitabine has a short half-life due to enzyme metabolism.6,7 Third, gemcitabine is not actively targeted12 to tumors versus healthy tissue.
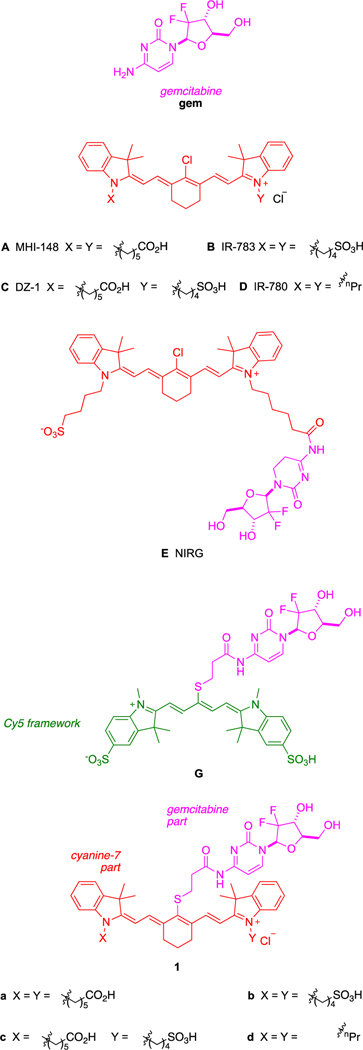
A small set of heptamethine cyanine dyes localize in tumors (MHI-148, A; IR-783, B; DZ-1, C; and IR-780, D) (Figure 1).13–18 The literature on actively targeted12 small molecule gemcitabine derivatives19–21 features an example of a conjugate to one of these tumor-seeking fluorophores (C) tested on GBM, i.e., NIRG, E.15 In mouse models, both E and its parent fluorophore C localized in intracranial GBM tissue and persisted there for over 24 h.
Figure 1.
Background structures and compounds featured in this study.
Conjugate 1a comprises a Cy7 dye framework; a similar compound, G, but based on a Cy5 core, has been reported.22 Conjugate G localized in tumors (from SGC7901 gastric carcinoma cells) and decreased their volume, but the decrease does not appear to have been compared to a gemcitabine control.22 Conjugates such as these based on a Cy5 core (λmaxem ~ 655 nm) are more difficult to observe in vivo than near-IR probes featured in this work. Overall, compound G is not especially relevant to the current study, though the structure is similar.
Our work in this area began with an investigation of meso-Cl displacement in A with various nucleophiles,23 particularly albumin.24 We found that a covalent adduct is formed between A and the free thiol of albumin Cys in PBS buffer at 37 °C. Albumin has a remarkably long half-life in vivo.25 Thus, formation of an albumin adduct in serum after injection, and import of that via albumin receptors,26 which are overexpressed in cancer cells,27,28 explains persistence of A (and presumably B–D) in tumor tissue. These data are confirmed by the independent studies by Canovas et al.29 published simultaneously with ours. We estimate the in vivo half-life of A in the serum of a mouse is around 36 min.
All four fluorophores A–D that show the remarkable tumor-seeking effect described above have a meso-chloride. This led us to wonder if a gemcitabine conjugate formed by displacing this chloride, thereby rendering the conjugate unable to form a covalent complex with albumin, would also localize into tumors in vivo and, if so, if it would persist there. To test these ideas, the meso-gemcitabine adducts 1 were designed. We hypothesized these conjugates would localize in cultured glioblastoma cancer cells if the chloride was not important for short-term uptake, but unlike A, they would not persist in tumors in vivo for long periods because they cannot form covalent adducts with albumin. Consequently, we set out to test if these assertions were true and to simultaneously probe therapeutic effects of 1 in a mouse subcutaneous xenograft model.
RESULTS AND DISCUSSION
Syntheses, ex Vivo Stabilities, and Cellular Studies.
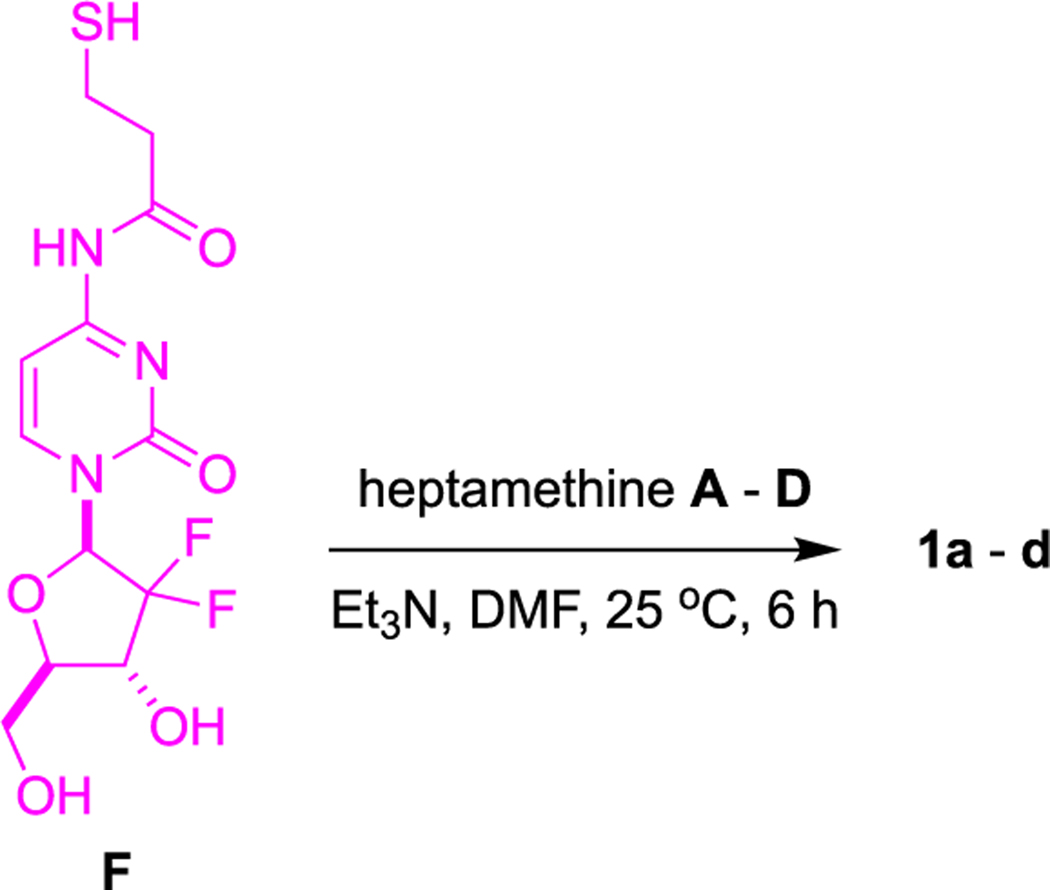
Conjugates 1a–d were prepared by substitution of the meso-Cl in their parent heptamethine cyanine dyes A–D23 using the gemcitabine derivative F19 (Schemes 1 and S1) as nucleophile. Parent dyes A–D and their corresponding conjugates 1a–d showed similar fluorescence quantum yields and UV absorption characteristics (Table S1 and Figure S1); consequently, they have maximal absorbance at good wavelengths, around 795 nm, and sufficient brightness for in vivo diagnostic imaging.
Scheme 1.
Syntheses of Conjugates 1a–d
Literature evidence indicates gemcitabine modifications at the exocyclic amine group do not adversely reduce its cytotoxicity.6,30 To verify this in the current study, we measured the cytotoxicities of gemcitabine and intermediate F with respect to U87 glioblastoma cells. The data obtained in these experiments were very similar (IC50: gem, 8.2 ± 1.7; F, 11.0 ± 1.4 nM; Figure S7a) indicating that formation of the conjugate did not significantly impact the efficacy of the gemcitabine component.
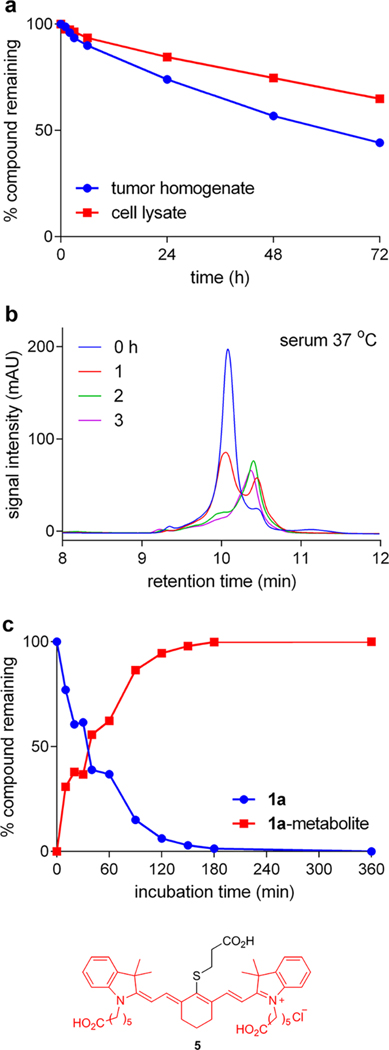
Several experiments were undertaken to test the stabilities of an illustrative conjugate, 1a, when incubated in physiological media. Thus, U87 tumor tissue from control mice (featured in the in vivo experiments described below) was cut into small pieces, homogenized (1 g of tumor per mL of RIPA buffer), then mixed with 1a; the stability of 1a was followed by analytical HPLC using detection at 780 nm corresponding to the fluorophore absorption maxima. Under these conditions the compound had a half-life of around 60 h at 37 °C (Figure 2a). The half-life of 1a was even longer when it was incubated with tumor cell lysate (4 million cells lysed with 1 mL RIPA buffer). These data imply 1a in the tumor may persist in a conjugated form for several hours.
Figure 2.
Conjugate stability of 1a in physiological conditions. Tumor tissue or cultured U87 cells were homogenized with RIPA buffer on ice before centrifuging to collect supernatant. Conjugates were incubated at 50 μM at 37 °C for up to 72 h. The % compound remaining was calculated based on area under curve from the analytical HPLC trace through a C4 column (Figure S4). (a) Conjugate stability of 1a in U87 tumor homogenate and U87 cell lysate. (b) In serum in vitro at 37 °C, conjugate 1a was metabolized to a new compound in ~3 h. (c) The half-life of 1a in mouse serum at 37 °C was determined to be ~1 h. Compound 5 was identified as 1a metabolite by mass spectrometry.
The connection between experiments featuring cell lysates and tumor homogenates to pharmacokinetics is tenuous, but in vitro stability tests in serum at 37 °C probably have more physiological relevance. These experiments show that the conjugate was metabolized to a new compound in 3 h with relatively high fidelity (Figure 2b), via a process that was inhibited by a mixture of proteases and phosphatases (Figure S5b) and was also inhibited at lower temperature (Figure S5c). Mass spectrometric analyses (Figure S6b) showed the metabolite had a molecular mass corresponding to the amide hydrolysis product 5. That assertion was proven by HPLC analyses involving “spiking” the metabolite mixture with synthesized compound 5 and checking coelution (Figure S6c). Thus, the amide bond in 1 that connects gemcitabine to the rest of the conjugate is vulnerable to proteolysis in serum in vitro giving it a half-life of approximately 1 h at 37 °C (Figure 2c).
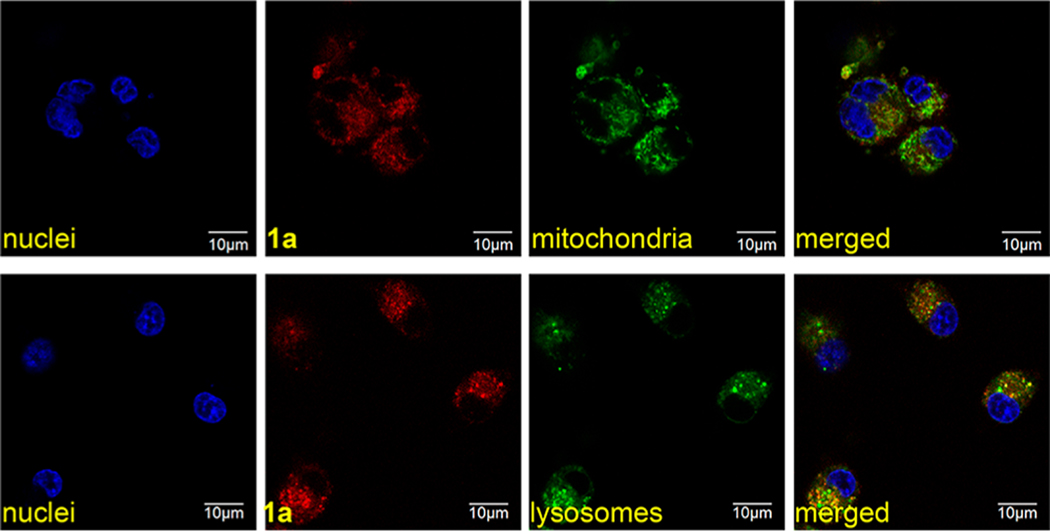
Overall, we concluded that short-term intracellular confocal imaging experiments featuring compounds 1a–d would be indicative of intracellular localization of the conjugates and not simply track free fluorophore liberated from the nucleoside. Data collected from confocal imaging of 1a is illustrative of that obtained for all the samples in the series 1a–d (Figures 3 and S2). Throughout, colocalization in the lysosome and mitochondria was uniformly observed (just as for the parent dyes A–D: Figure S3) except for 1c, which gave no detectable accumulation in the mitochondria. Mitochondrial localization and, by inference, escape from the lysosome, probably enhances cytotoxicity, so conjugates 1a, 1b, and 1d only were considered beyond this point, and 1c was excluded because it did not appear to escape from the lysosome.
Figure 3.
Conjugate 1a uptake and subcellular localization in U87 cells at 37 °C. Pearson’s correlation coefficient (PCC) for colocalization between red (1a) and green (organelle stain) fluorescence was 0.74 with mitochondria and 0.62 with lysosomes.
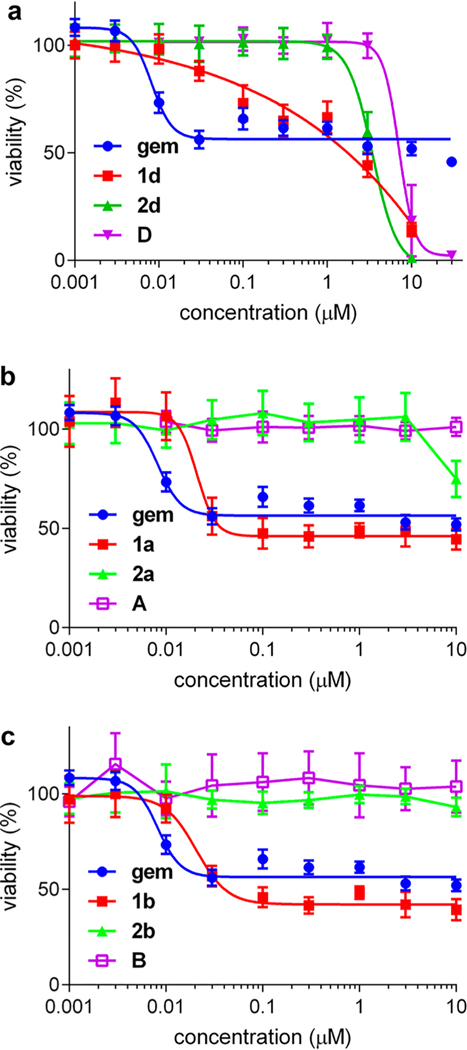
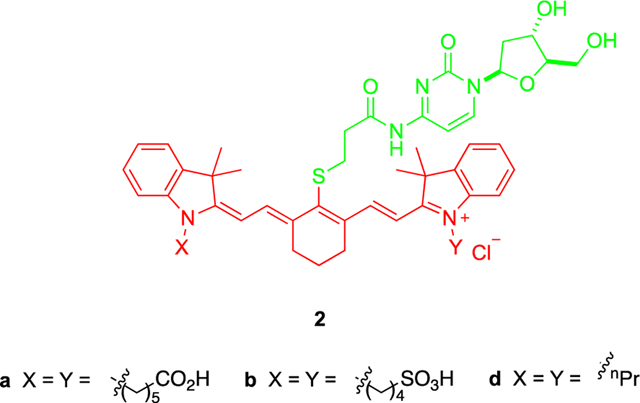
Cytotoxicity data for 1a, 1b, and 1d were measured, and comparisons were made with reference compounds 2a, 2b, and 2d which were specifically prepared for this purpose (Scheme S2). Conjugates 2 feature the same dye as the key compounds 1, but the nucleoside cargo, cytidine, is innocuous.
Cytotoxicity data for the gemcitabine-derivative 1d relative to its cytidine control 2d led us to exclude this compound from further studies for the following reasons. Both the free dye D and the control 2d are cytotoxic at <10 μM, whereas none of the other dyes A–C are at these levels (Figures S7b and 4a). Moreover, compounds 1a and 1b proved to be significantly more toxic than their parent dyes A and B, and their cytidinebased controls 2a and 2b (Figure 4b and Figure 4c). Conjugates 1a and 1b were less cytotoxic than gemcitabine, but the difference was not great because all three of those compounds were observed to have IC50 values in the 0.01 – 0.02 μM range. The cytotoxicity of gemcitabine on U87 cells has some variance (about 0.01–0.5 μM)31 and often stabilizes at certain values before 100% apparent cell death;9 consequently, for the purposes of this study, the IC50 values quoted throughout are calibrated relative to the lowest concentration beyond which no further cell death appears to occur. On the basis of these data either compound 1a or 1b could have been selected for in vivo studies; conjugate 1a was in fact chosen because there is literature32 that indicates A has a superior tumor-to-muscle imaging contrast index relative to B. To further validate the therapeutic effect of conjugate 1a in vitro, cytotoxicity measurements on other glioblastoma cells (LN18, LN229) as well as control cells (HEK293) were conducted (Figure S8). The results indicate enhanced cytotoxicity of 1a on glioblastoma cells compared to control cells.
Figure 4.
Cytotoxicity of conjugates 1, their cytidine analogs 2, and their parent dyes. (a) Compounds 2d and D were shown to be significantly toxic below 10 μM (IC50: 2d, 3.4 ± 0.4; D, 7.1 ± 1.7 μM). Conversely, in the sets 1a, 2a, and A, and 1b, 2b, and B, gemcitabine and compounds 1 are significantly more cytotoxic than the controls 2 and the free dyes (parts b and c, respectively). IC50 values are the following: gem, 8.2 ± 1.7; 1a, 20.9 ± 5.0; 1b, 20.7 ± 3.2 nM).
In Vivo Studies.
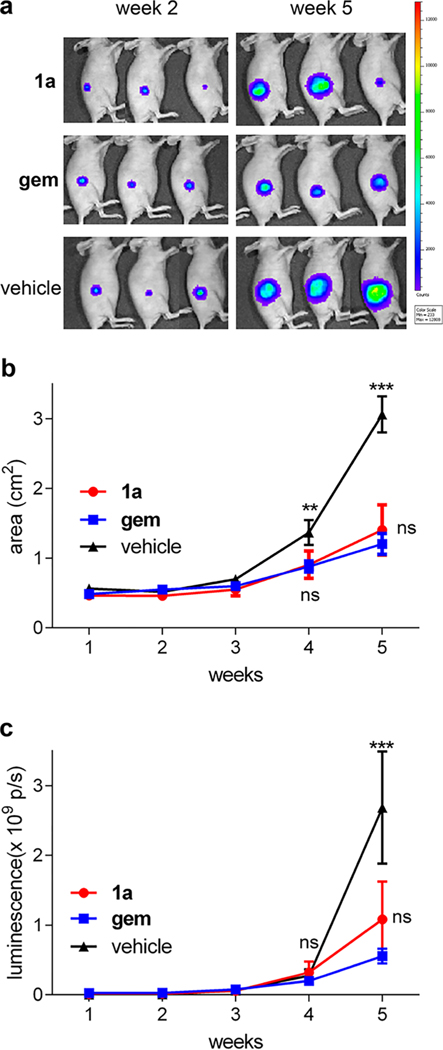
A xenograft mouse model was used to examine the effects of lead compound 1a on tumor growth in vivo. U87 glioma cells stably expressing luciferase and RFP reporters (U87-luc-RFP) were injected subcutaneously into the flanks of Fox1nu mice. In the key experiments, the test compound (1a or gem, 10 mg/kg) or vehicle control was administered intravenously via retro-orbital vein at days 4 and 8 after tumor inoculation and then weekly for a total of six injections. No significant body weight loss was observed among mice in all treatment groups (Figure S11). Tumor burden was evaluated using weekly bioluminescent imaging of mice 1–5 weeks after drug or vehicle administration. Administration of 1a or gem significantly reduced tumor burden (Figure 5). There was no significant difference in tumor size in mice injected with gem or 1a on mg/kg basis, but in terms of moles of drugs delivered, 1a afforded the similar effect at under a third of the dose of gem (molecular weight of 1a, 1034.6, is 3.45 greater than that of gemcitabine hydrochloride, 299.66).
Figure 5.
Therapeutic effect of 1a. (a) Luminescence images of mice harboring U87-RFP-Luc subcutaneuous tumors and treated with indicated compounds were acquired with an IVIS Spectrum in vivo imaging system (PerkinElmer) at 2 and 5 weeks after drug administration. (b) Mean tumor size (cm2) with SEM over a 5-week period after drug administration (n = 3). Two-way ANOVA with Bonferroni posttest shows statistically significant differences between 1a or gem compared with vehicle control group at 4 weeks (**p < 0.01) and 5 weeks (***p < 0.001). (c) Mean tumor luminescence (photons per second, p/s) with SEM over a week period (n = 3). Two-way ANOVA with Bonferroni posttest shows statistically significant differences between 1a or gem and the vehicle group at 5 weeks (p < 0.001).
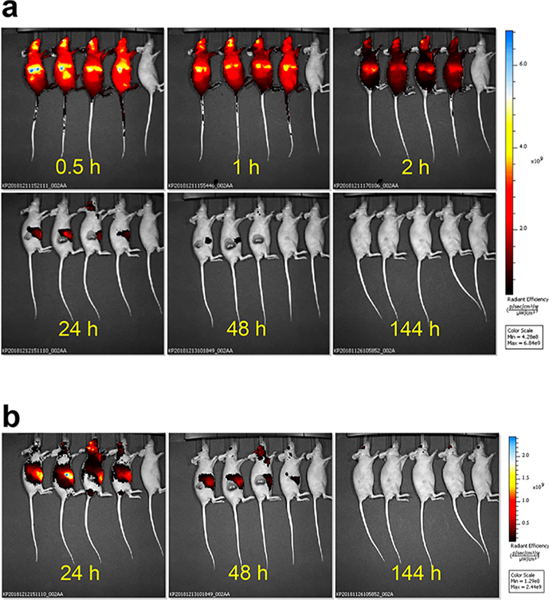
Localization of 1a in vivo was monitored by fluorescence imaging of tumor-bearing mice at different times postinjection. Cyanine fluorescence was observed throughout the mice 30 min after drug injection, with maximal signal in the liver and tumor, and at the site of injection (retro-orbital vein; Figure 6a, mice 1–4). Conjugate 1a mostly cleared from the mouse after 24 h (Figure 6a); imaging at 48 h after drug injection revealed residual 1a fluorescence signal that was ~10-fold lower than the signal observed at 30 min postinjection and ~100-fold lower at 144 h (Figure 6b).
Figure 6.
Localization/clearance of 1a in vivo. (a) Mice were injected with 10 mg/kg 1a with an uninjected control (last mouse in each view). Images were taken at 0.5, 1, 2, 24, 48, and 144 h after intravenous injection, and their fluorescence intensities are normalized to be on the same scale. (b) Images at 10× lower scale show persistence of fluorescence in 1a-treated mice, indicating residual drug localization over extended periods.
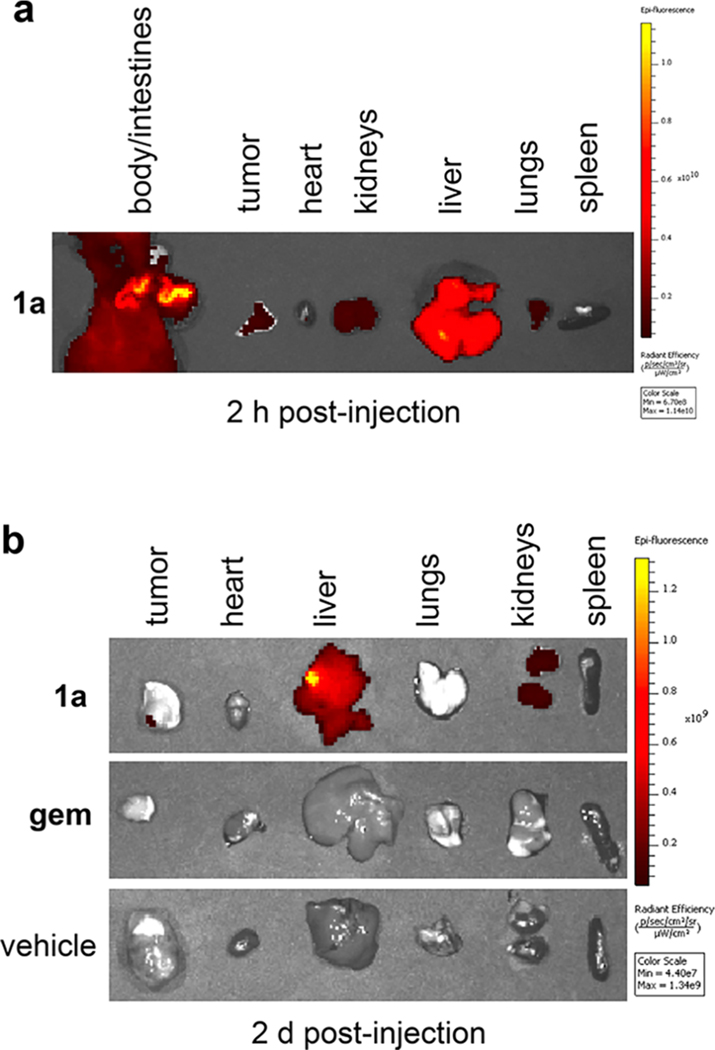
Tumor tissue and organs of the mice injected with 1a were dissected and imaged to further visualize the localization of the drug conjugated to the fluorescent dye. One of the 1a-treated mice was analyzed 2 h after intravenous injection; the fluorophore had localized to the tumor as well as the intestines, kidneys, liver, and lungs (Figure 7a). Two days after injecting 1a, some signal was still detected in the tumor, and significant signal was also observed in the liver and kidneys (Figures 7b and S10c).
Figure 7.
Localization of 1a post-mortem via fluorescence imaging on tissues: (a) dissected 2 h after intravenous injection of 1a; (b) removed from 1a-, gem-, and vehicle-injected mice 2 d after intravenous injection.
CONCLUSIONS
Data presented above indicate that the conjugate 1a hydrolyzes with a half-life of approximately 1 h in serum at 37 °C to give free gemcitabine and fluorophore 5. However, fluorescence in the tumor implant is near maximal around 30 min after intravenous injection, indicating that some of conjugate 1a is imported into tumor cells in vivo. This assertion is consistent with the observation that the molar efficacy of the conjugate is significantly greater than gemcitabine with respect to reduction of tumor burden in these models. Conjugate 1a is cleared from the tumor more quickly than E15 and other fluorophores like MHI-148 that feature a meso-Cl,33 consistent with our original hypothesis.
In related studies, we23 and others29 have found Cy7 dyes with a meso-chloride react with albumin (t1/2 ~ 30 min at 37 °C) to give a covalent adduct. Displacement of meso-chloride is impossible for conjugates 1 and G (no meso-Cl). In previous work we have shown that dyes in this series that have a meso-chloride can form conjugates with serum albumin, and the albumin adducts persist in tumors for extended periods.24,29 Thus, the presence of a meso-Cl, covalent albumin binding or not, manifests itself in this study by the residence time of the fluorophore in the tumor.
Overall, it is advantageous to conjugate gemcitabine with tumor seeking dyes like A at meso-position if relatively quick clearance is important to reduce the off-target effect and toxicity to normal organs, and this approach was shown here to give greater molar efficacy of 1a relative to gemcitabine. Alternatively, if the goal is to increase the residency time in tumors, then a better strategy might be via conjugates like E that we suggest form covalent adducts with albumin in serum.
EXPERIMENTAL SECTION
General Experimental Procedure.
All reactions were carried out under an inert atmosphere (nitrogen, or argon where stated) with dry solvents under anhydrous conditions. Glassware for anhydrous reactions was dried in an oven at 140 °C for minimum 6 h prior to use. Dry solvents were obtained by passing the previously degassed solvents through activated alumina columns. Reagents were purchased at a high commercial quality (typically 97% or higher) and used without further purification unless otherwise stated.
Flash chromatography was performed using silica gel (230–400 mesh). Analytical thin layer chromatography (TLC) was carried out on Silicycle silica gel plates and visualized by UV, ninhydrin, para-methoxybenzaldehyde, and/or potassium permanganate stain. A reversed phase column on preparation high performance liquid chromatography (prepHPLC) was also applied to purify compounds in 10–90% MeCN/water gradient with 0.1% trifluoroacetic acid over 20 min. The purity of the compounds 1a–d and 2a,c,d were confirmed by LC/MS, in 10–90% MeCN/water gradient with 0.1% formic acid over 10 min. LC traces at 254 nm are shown in the Supporting Information. All the compounds had ≥95% purity.
High field NMR spectra were recorded with Bruker Avance III at 400 MHz for 1H and at 101 MHz for 13C for all compounds except for compound 5. NMR spectra of 5 were taken with Bruker Avance 500 at 500 MHz for 1H and 126 MHz for 13C. All spectra were calibrated using residual nondeuterated solvent as an internal reference (CDCl3, 1H NMR = 7.24, 13C NMR = 77.0; MeOD-d4, 1H NMR = 3.30, 13C NMR = 49.0; DMSO-d6, 1H NMR = 2.50, 13C NMR = 39.5). The following abbreviations were used to explain the multiplicities: s = singlet, d = doublet, t = triplet, q = quartet, quint = quintet, dd = double doublet, dt = double triplet, dq = double quartet, m = multiplet, br = broad. All statistical analyses were carried out by GraphPad Prism 6.0 (GraphPad Software). Results are represented as the mean ± SD.
Electrospray ionization mass spectrometry (ESI-MS) data were collected on triple-stage quadrupole instrument in a positive mode. Paper spray mass spectrometry data were obtained with LTQ XL mass spectrometer (Thermo Fisher Scientific, San Jose, CA). Instrumental conditions used for the positive-mode mass spectrometry is specified as the following: paper spray voltage, 3.5 kV; heated-capillary temperature, 275 °C; heated-capillary voltage, 33 V; tube lens voltage, 65 V. Both the full-scan and tandem mass spectra were acquired, and the corresponding m/z values confirmed the structure of each species. The qualitative filter paper was purchased from VWR (catalog no. 28310–026). Paper was cut into an isosceles triangle shape with 10 mm height and 5 mm base. A copper clip was employed as both the paper holder and the spray voltage conductor. The distance from the paper tip to the mass spectrometer inlet was kept to be 5 mm.
Cell Culture.
LN18 and LN229 cells were cultured on 75 cm2 tissue culture flasks in Dulbecco’s modified Eagle medium (DMEM, ATCC) supplement with 5% fetal bovine serum (FBS). HEK293 and U87 cells were cultured on 75 cm2 tissue culture flasks in Dulbecco’s modified Eagle medium/nutrient mixture F-12 Ham (DMEM/F12, Millipore Sigma) supplement with 10% fetal bovine serum (FBS). All cells were cultured in a humidified incubator at 37 °C with 5% CO2 and 95% air.
Compound Syntheses and Characterization. N-(1-((2R,4R,5R)-3,3-Difluoro-4-hydroxy-5-(hydroxymethyl)-tetrahydrofuran-2-yl)-2-oxo-1,2-dihydropyrimidin-4-yl)-3-mercaptopropanamide (F).
Compound F was prepared via the protocol previously published.19 Briefly, 2-(1H-benzotriazole-1-yl)-1,1,3,3-tetramethylaminium tetrafluoroborate (TBTU, 1.2 g, 1.2 equiv) and compound H19 (1.1 g, 3.0 mmol, 1.0 equiv) were dissolved in N,N-dimethylformamide (DMF, 0.3 M) in an ice bath, and gemcitabine hydrochloride (0.90 g, 3.0 mmol, 1.0 equiv) and N,N-diisopropylethylamine (iPr2NEt, 1.1 mL, 2.0 equiv) were then added to the reaction mixture. The mixture was stirred at room temperature for 18 h. Product was purified via flash chromatography (2–5% MeOH in CH2Cl2) with 63% yield (1.1 g). Protecting group of the thiol in the product (0.59 g, 1.0 mmol) was then removed under acidic conditions in 1:3 (v/v) trifluoroacetic acid (TFA)/CH2Cl2 (0.2 M) on ice for 1 h, with triethylsilane (Et3SiH, 0.39 mL, 2.4 equiv) as scavenger. After removal of the solvents, the mixture was washed with diethyl ether 5 mL × 2 to get compound F (0.36 g as 1.0 equiv TFA salt, 80% yield). 1H NMR (400 MHz, MeOD) δ 8.17 (d, J = 7.9 Hz, 1H), 6.28 (t, J = 8.1 Hz, 1H), 6.16 (d, J = 7.9 Hz, 1H), 5.50 (dt, J = 13.5, 6.9 Hz, 1H), 4.27 (dd, J = 6.7, 3.1 Hz, 1H), 3.95 (d, J = 11.1 Hz, 1H), 3.80 (dd, J = 12.8, 3.2 Hz, 1H), 2.85–2.72 (m, 4H). 13C NMR (101 MHz, MeOD) δ 171.66, 145.40, 130.47, 129.25, 127.29, 122.73, 95.82, 81.80, 71.07 (dd, J = 31.8, 16.8 Hz), 60.57, 38.94, 20.00. 162.29, 85.88 (dd, J = 40.0, 22.0 Hz) from TFA, 66.87, 15.41 from Et2O.
Syntheses of 1a–d.
Compounds B (no. 543292, Sigma-Aldrich) and D (no. AB332015, abcr GmbH) were commercially available, and compounds A and C were prepared by the protocol previously described.34 As shown in Scheme 1, equal equivalents of compound F and representative free heptamethine dyes A–D were dissolved in DMF (0.06 M), followed by 2.0 equiv of triethylamine (Et3N) and stirred at 25 °C for 6 h. Solvent was removed in vacuum, and compound was purified via prepHPLC and lyophilized to get 1a–d (30–40% yield).
1-(5-Carboxypentyl)-2-((E)-2-((E)-3-(2-((E)-1-(5-carboxypentyl)-3,3-dimethylindolin-2-ylidene)ethylidene)-2-((3-((1-((2R,4R,5R)-3,3-difluoro-4-hydroxy-5-(hydroxymethyl)-tetrahydrofuran-2-yl)-2-oxo-1,2-dihydropyrimidin-4-yl)-amino)-3-oxopropyl)thio)cyclohex-1-en-1-yl)vinyl)-3,3-dimethyl-3H-indol-1-ium (1a).
1H NMR (400 MHz, DMSO) δ 8.66 (s, 2H), 8.24 (d, J = 7.6 Hz, 1H), 7.56 (d, J = 7.4 Hz, 2H), 7.46–7.37 (m, 6H), 7.30–7.20 (m, 3H), 6.34–6.23 (m, 1H), 6.19–6.08 (m, 1H), 4.23–4.10 (m, 6H), 3.95–3.85 (m, 1H), 3.85–3.71 (m, 1H), 3.71–3.59 (m, 1H), 3.10–3.02 (m, 2H), 2.78 (t, J = 6.5 Hz, 2H), 2.70–2.59 (m, 4H), 2.30 (t, J = 7.3 Hz, 1H), 2.21 (t, J = 7.3 Hz, 4H), 1.92–1.80 (m, 2H), 1.77–1.51 (m, 22H), 1.46–1.35 (m, 4H). 13C NMR (101 MHz, DMSO) δ 174.22, 171.69, 171.64, 162.65, 154.87, 154.01, 144.53, 142.13, 140.83, 132.92, 128.51, 124.80, 122.34, 111.16, 95.93, 94.56, 81.09, 58.87, 58.78, 48.70, 43.48, 36.70, 33.45, 33.05, 31.72, 27.41, 27.36, 27.33, 26.58, 25.66, 24.12, 24.06, 20.37. Measured M+ (C54H66F2N5O9S+) (m/z): 998.4531. Calculated M+: 998.4544 (1.3 ppm).
2-((E)-2-((E)-2-(3-(1-((2R,4R,5R)-3,3-Difluoro-4-hydroxy-5-(hydroxymethyl)tetrahydrofuran-2-yl)-2-oxo-1,2-dihydropyrimidin-4-ylamino)-3-oxopropylthio)-3-((E)-2-(3,3-dimethyl-1-(4-sulfobutyl)indolin-2-ylidene)ethylidene)cyclohex-1-enyl)-vinyl)-3,3-dimethyl-1-(4-sulfobutyl)-3H-indolium (1b).
1H NMR (400 MHz, DMSO) δ 9.99 (s, 1H), 8.99 (s, 1H), 8.74–8.62 (m, 2H), 8.26 (d, J = 7.6 Hz, 1H), 8.16 (d, J = 7.9 Hz, 1H), 7.72–7.61 (m, 1H), 7.57 (dd, J = 15.2, 7.3 Hz, 2H), 7.47–7.35 (m, 3H), 7.32–7.20 (m, 2H), 6.34 (dd, J = 14.2, 6.2 Hz, 2H), 6.26 (d, J = 7.9 Hz, 1H), 6.18–6.03 (m, 1H), 4.27–4.12 (m, 5H), 3.96–3.85 (m, 1H), 3.80 (d, J = 12.7 Hz, 1H), 3.65 (dd, J = 12.8, 3.3 Hz, 1H), 3.17 (s, 1H), 3.08 (t, J = 6.4 Hz, 1H), 2.99 (t, J = 6.8 Hz, 1H), 2.78 (t, J = 6.5 Hz, 1H), 2.72–2.52 (m, 8H), 1.89–1.71 (m, 12H), 1.71–1.55 (m, 12H). 13C NMR (101 MHz, DMSO) δ 172.22, 171.72, 171.65, 162.66, 159.27, 154.89, 154.00, 146.77, 144.78, 142.18, 140.91, 140.85, 133.09, 128.51, 124.74, 122.28, 111.29, 101.32, 95.99, 94.76, 58.78, 58.71, 50.68, 48.74, 48.71, 48.56, 43.58, 27.42, 25.97, 25.75, 22.38. Measured M+ (C50H62F2N5O11S3+) (m/z): 1042.3564. Calculated M+: 1042.3571 (0.7 ppm).
2-((E)-2-((E)-3-((E)-2-(1-(5-Carboxypentyl)-3,3-dimethylindolin-2-ylidene)ethylidene)-2-(3-(1-((2R,4R,5R)-3,3-difluoro-4-hydroxy-5-(hydroxymethyl)tetrahydrofuran-2-yl)-2-oxo-1,2-dihydropyrimidin-4-ylamino)-3-oxopropylthio)cyclohex-1-enyl)vinyl)-3,3-dimethyl-1-(4-sulfobutyl)-3H-indolium (1c).
1H NMR (400 MHz, DMSO) δ 8.70 (d, J = 14.2 Hz, 1H), 8.63 (d, J = 14.0 Hz, 1H), 8.24 (d, J = 7.6 Hz, 1H), 7.55 (dd, J = 10.2, 7.6 Hz, 2H), 7.49–7.33 (m, 5H), 7.29−7.20 (m, 4H), 6.38 (d, J = 14.3 Hz, 1H), 6.25 (d, J = 14.1 Hz, 1H), 6.14 (t, J = 7.5 Hz, 1H), 4.25–4.10 (m, 5H), 3.91–3.86 (m, 1H), 3.80 (d, J = 11.4 Hz, 2H), 3.67 (d, J = 3.5 Hz, 1H), 3.64 (d, J = 3.5 Hz, 1H), 3.08 (t, J = 6.5 Hz, 2H), 2.78 (t, J = 6.5 Hz, 2H), 2.70–2.60 (m, 4H), 2.54 (d, J = 7.2 Hz, 2H), 2.21 (t, J = 7.3 Hz, 2H), 2.06 (s, 1H), 1.90–1.79 (m, 4H), 1.79–1.68 (m, 4H), 1.67–1.62 (m, 12H), 1.62–1.53 (m, 2H), 1.45–1.35 (m, 2H). 13C NMR (101 MHz, DMSO) δ 174.31, 172.32, 171.71, 171.12, 162.73, 154.94, 154.11, 145.28, 144.86, 144.07, 142.27, 142.10, 141.01, 140.75, 133.52, 132.69, 128.61, 128.52, 125.47, 125.06, 124.57, 122.90, 122.34, 118.01, 117.22, 111.53, 110.96, 101.87, 100.75, 96.05, 81.14, 68.45, 58.83, 50.65, 48.92, 48.60, 43.80, 43.38, 36.83, 33.51, 31.77, 27.54, 27.49, 27.42, 27.37, 26.57, 26.05, 25.79, 25.71, 24.18, 22.49, 20.47. Measured M+ (C52H64F2N5O10S2+) (m/z): 1020.4040. Calculated M+: 1020.4057 (1.7 ppm).
2-((E)-2-((E)-2-((3-((1-((2R,4R,5R)-3,3-Difluoro-4-hydroxy-5-(hydroxymethyl)tetrahydrofuran-2-yl)-2-oxo-1,2-dihydropyrimidin-4-yl)amino)-3-oxopropyl)thio)-3-(2-((E)-3,3-dimethyl-1-propylindolin-2-ylidene)ethylidene)cyclohex-1-en-1-yl)vinyl)-3,3-dimethyl-1-propyl-3H-indol-1-ium (1d).
1H NMR (400 MHz, DMSO) δ 8.71–8.63 (m, 2H), 8.24 (d, J = 7.6 Hz, 1H), 7.57 (d, J = 7.4 Hz, 2H), 7.47–7.37 (m, 4H), 7.31–7.20 (m, 3H), 6.39–6.25 (m, 2H), 6.14 (t, J = 7.5 Hz, 1H), 4.24–4.10 (m, 6H), 3.94–3.60 (m, 4H), 3.07 (t, J = 6.6 Hz, 2H), 2.77 (t, J = 6.5 Hz, 2H), 2.64 (t, J = 5.6 Hz, 4H), 1.89–1.60 (m, 19H), 1.00–0.92 (m, 6H). 13C NMR (101 MHz, DMSO) δ 171.91, 171.88, 171.62, 162.65, 154.83, 154.01, 144.83, 144.59, 142.27, 140.80, 132.93, 128.49, 124.78, 122.83, 122.34, 111.24, 101.24, 95.91, 81.12, 68.44, 58.78, 48.74, 44.93, 36.70, 31.63, 27.46, 27.40, 25.73, 20.36, 11.05. Measured M+ (C48H58F2N5O5S +) (m/z): 854.4091. Calculated M+: 854.4121 (3.5 ppm).
Syntheses of 2a,b,d.
Compounds 2a,b,d were prepared in the same way as for compounds 1 described above (Scheme S2). Briefly, TBTU (3.86 g, 1.2 equiv) and compound H (3.49 g, 1.0 equiv) were dissolved in DMF (0.3 M) in an ice bath. 2′-Deoxycytidine (2.27 g, 10.0 mmol, 1.0 equiv) and iPr2NEt (2.10 mL, 1.2 equiv) were then added to the reaction mixture, and the mixture was stirred at room temperature for 18 h. Product compound 3 was purified via flash chromatography (2–4% MeOH in CH2Cl2) with 22% yield (1.20 g). Protecting group of the thiol in 3 was then removed under acidic conditions in 1:3 (v/v) TFA/CH2Cl2 (0.2 M) on ice for 1 h, with Et3SiH (2.4 equiv) as scavenger. After removal of the solvents, the sample was washed with diethyl ether 5 mL × 2 to get compound 4 (quantitative).
Then equal equivalents of compound 4 and representative free heptamethine dye A, B, or D were dissolved in DMF (0.06 M), followed by 2.0 equiv of Et3N, and the mixture was stirred at 25 °C for 6 h. Solvent was removed in vacuum, and compound was purified via prep-HPLC and lyophilized to get 2a, 2b, or 2d (30–40% yield).
1-(5-Carboxypentyl)-2-((E)-2-((E)-3-(2-((E)-1-(5-carboxypentyl)-3,3-dimethylindolin-2-ylidene)ethylidene)-2-((3-((1-((2R,4S,5R)-4-hydroxy-5-(hydroxymethyl)tetrahydrofuran-2-yl)-2-oxo-1,2-dihydropyrimidin-4-yl)amino)-3-oxopropyl)-thio)cyclohex-1-en-1-yl)vinyl)-3,3-dimethyl-3H-indol-1-ium (2a).
1H NMR (400 MHz, DMSO) δ 8.67 (d, J = 14.0 Hz, 2H), 8.37 (d, J = 7.5 Hz, 1H), 7.57 (d, J = 7.4 Hz, 2H), 7.46–7.36 (m, 5H), 7.31–7.21 (m, 2H), 7.18 (d, J = 7.5 Hz, 1H), 6.29 (d, J = 14.2 Hz, 2H), 6.07 (t, J = 6.3 Hz, 1H), 4.27–4.10 (m, 5H), 3.90–3.82 (m, 1H), 3.58 (qd, J = 12.0, 3.8 Hz, 1H), 3.06 (t, J = 6.4 Hz, 2H), 2.76 (t, J = 6.2 Hz, 2H), 2.69–2.59 (m, 4H), 2.31–2.15 (m, 5H), 1.99–1.80 (m, 3H), 1.78–1.35 (m, 28H), 1.27–1.18 (m, 1H). 13C NMR (101 MHz, DMSO) δ 174.20, 171.74, 171.43, 161.93, 154.85, 154.09, 145.18, 144.62, 142.13, 140.85, 133.01, 128.51, 124.79, 122.37, 111.18, 101.23, 95.34, 87.99, 86.20, 69.92, 60.87, 48.75, 43.51, 40.89, 36.63, 33.51, 31.84, 27.42, 26.60, 25.73, 25.68, 24.15, 20.40. Measured M+ (C54H68N5O9S+) (m/z): 962.4721. Calculated M+: 962.4732 (1.1 ppm).
2-((E)-2-((E)-3-((E)-2-(3,3-Dimethyl-1-(4-sulfobutyl)indolin-2-ylidene)ethylidene)-2-(3-(1-((2R,4S,5R)-4-hydroxy-5-(hydroxymethyl)tetrahydrofuran-2-yl)-2-oxo-1,2-dihydropyrimidin-4-ylamino)-3-oxopropylthio)cyclohex-1-enyl)vinyl)-3,3-dimethyl-1-(4-sulfobutyl)-3H-indolium (2b).
1H NMR (400 MHz, DMSO) δ 9.73–9.54 (m, 1H), 8.89–8.67 (m, 4H), 8.23 (d, J = 7.9 Hz, 1H), 8.11–7.75 (m, 3H), 7.70–7.55 (m, 3H), 7.49–7.36 (m, 3H), 7.25 (t, J = 7.3 Hz, 2H), 6.35 (d, J = 14.2 Hz, 1H), 6.16 (d, J = 7.9 Hz, 1H), 6.10–5.98 (m, 1H), 4.29–4.13 (m, 4H), 3.85 (q, J = 3.4 Hz, 1H), 3.59 (dd, J = 9.5, 3.6 Hz, 1H), 2.99 (t, J = 6.8 Hz, 1H), 2.70–2.62 (m, 4H), 2.60–2.51 (m, 6H), 2.28–2.02 (m, 3H), 1.90–1.63 (m, 24H). 13C NMR (101 MHz, DMSO) δ 172.22, 171.73, 159.23, 154.82, 147.59, 146.87, 144.77, 144.41, 142.20, 140.90, 133.11, 128.51, 124.75, 122.34, 111.29, 101.39, 99.49, 93.75, 88.05, 85.82, 69.74, 60.74, 50.71, 48.74, 43.57, 40.43, 34.48, 27.43, 26.01, 25.70, 22.41. Measured M+ (C50H64N5O11S3+) 1006.3757 (m/z). Calculated M+: 1006.3759 (0.2 ppm).
2-((E)-2-((E)-3-(2-((E)-3,3-Dimethyl-1-propylindolin-2-ylidene)ethylidene)-2-((3-((1-((2R,4S,5R)-4-hydroxy-5-(hydroxymethyl)tetrahydrofuran-2-yl)-2-oxo-1,2-dihydropyrimidin-4-yl)amino)-3-oxopropyl)thio)cyclohex-1-en-1-yl)-vinyl)-3,3-dimethyl-1-propyl-3H-indol-1-ium (2d).
1H NMR (400 MHz, DMSO) δ 8.98 (d, J = 16.3 Hz, 1H), 8.74–8.66 (m, 2H), 8.26 (d, J = 7.8 Hz, 1H), 7.73–7.66 (m, 1H), 7.60 (d, J = 7.4Hz, 2H), 7.47–7.37 (m, 4H), 7.29–7.22 (m, 1H), 6.39–6.27 (m, 1H), 6.23 (d, J = 7.8 Hz, 1H), 6.07 (dd, J = 13.7, 6.9 Hz, 1H), 4.29–4.12 (m, 5H), 3.85 (dd, J = 7.1, 3.5 Hz, 1H), 3.59 (ddd, J = 21.8, 12.0, 3.7 Hz, 2H), 3.03–2.94 (m, 2H), 2.69–2.60 (m, 3H), 2.58–2.51 (m, 2H), 2.31–2.09 (m, 2H), 2.08 (s, 2H), 1.89–1.72 (m, 8H), 1.70–1.64 (m, 12H), 1.08–1.02 (m, 1H), 0.99–0.93 (m, 5H). 13C NMR (101 MHz, DMSO) δ 172.18, 171.99, 159.55, 154.82, 147.33, 146.69, 144.70, 142.30, 140.88, 132.94, 128.50, 124.80, 122.41, 111.28, 101.34, 93.69, 88.07, 85.82, 69.70, 60.68, 52.61, 48.80, 44.97, 34.49, 32.35, 30.63, 27.45, 25.79, 20.40, 11.09. Measured M+ (C48H60N5O5S+) (m/z): 818.4293. Calculated M+: 818.4310 (2.1 ppm).
N- (1 - ((2R,4S,5R)-4-Hydroxy-5-(hydroxymethyl) - tetrahydrofuran-2-yl)-2-oxo-1,2-dihydropyrimidin-4-yl)-3-(tritylthio)propenamide (3).
1H NMR (400 MHz, DMSO) δ 8.31 (d, J = 7.4 Hz, 1H), 7.40–7.28 (m, 12H), 7.28–7.21 (m, 3H), 7.15 (d, J = 7.5 Hz, 1H), 6.10 (t, J = 6.3 Hz, 1H), 5.20 (d, J = 15.2 Hz, 1H), 5.05–4.96 (m, 1H), 4.27–4.15 (m, 1H), 4.09–3.96 (m, 1H), 3.86 (q, J = 3.7 Hz, 1H), 3.66–3.50 (m, 2H), 3.28 (d, J = 9.5 Hz, 1H), 2.38–2.23 (m, 3H), 2.09–1.95 (m, 2H). 13C NMR (101 MHz, DMSO) δ 171.68, 161.89, 154.31, 145.01, 144.29, 129.01, 127.98, 126.69, 95.13, 87.79, 86.12, 69.78, 66.13, 60.79, 40.79, 35.18, 26.50.
N- (1 - ((2R, 4S, 5R)-4-Hydroxy-5-(hydroxymethyl) - tetrahydrofuran-2-yl)-2-oxo-1,2-dihydropyrimidin-4-yl)-3-mercaptopropanamide (4).
1H NMR (400 MHz, DMSO) δ 8.33 (d, J = 7.4 Hz, 1H), 7.84 (d, J = 7.0 Hz, 1H), 7.20 (d, J = 7.4 Hz, 1H), 7.09 (d, J = 7.0 Hz, 1H), 6.10 (t, J = 6.2 Hz, 1H), 4.31–4.15 (m, 1H), 3.86 (d, J = 3.5 Hz, 1H), 3.59 (qd, J = 11.9, 3.8 Hz, 2H), 2.86−2.62 (m, 5H), 2.38 (m, 1H), 2.34–2.22 (m, 1H), 2.08–1.90 (m, 1H). 13C NMR (101 MHz, DMSO) δ 172.01, 162.04, 154.30, 145.04, 95.25, 87.89, 86.15, 69.89, 60.91, 40.86, 40.35, 18.90. Measured M + H (m/z): 316.0963. Calculated M + H: 316.0962 (0.3 ppm).
Preparation of 2-((E)-2-((E)-2-((2-Carboxyethyl)thio)-3-(2-((E)-1-(5-carboxypentyl)-3,3-dimethylindolin-2-ylidene)-ethylidene)cyclohex-1-en-1-yl)vinyl)-1-(5-carboxypentyl)-3,3-dimethyl-3H-indol-1-ium (5).
2.0 equiv of 3-mercaptopropionic acid and 1.0 equiv of heptamethine dye A were dissolved in DMF (0.1 M), followed by 3.0 equiv of Et3N, and the mixture was stirred at 25 °C for 6 h. Solvent was removed in vacuum, and compound was purified via prep-HPLC and lyophilized to get 5 (4.0 mg, 20% yield). 1H NMR (500 MHz, DMSO) δ 8.71 (d, J = 14.1 Hz, 2H), 7.60 (d, J = 7.3 Hz, 2H), 7.45–7.38 (m, 4H), 7.29–7.23 (m, 2H), 6.30 (d, J = 14.2 Hz, 2H), 4.18 (t, J = 7.2 Hz, 4H), 2.99 (t, J = 6.9 Hz, 2H), 2.64 (t, J = 5.9 Hz, 4H), 2.55–2.51 (m, 2H), 2.24–2.13 (m, 4H), 1.88–1.80 (m, 2H), 1.77–1.71 (m, 4H), 1.70 (s, 12H), 1.62–1.53 (m, 5H), 1.45–1.34 (m, 4H), 1.25 (s, 2H). 13C NMR (126 MHz, DMSO) δ 174.29, 172.33, 171.86, 154.94, 144.75, 142.18, 141.58, 140.92, 135.35, 132.99, 128.55, 124.84, 122.44, 111.21, 101.29, 48.80, 43.50, 43.29, 33.52, 27.41, 26.64, 25.70, 24.18, 20.49. Measured M+ (C45H57N2O6S+) (m/z): 753.3922. Calculated M+: 753.3932 (1.3 ppm).
Photophysical Properties of 1.
Compounds 1 were solubilized as DMSO stock solutions before diluting to 1 μM in PBS buffer. Absorbance and fluorescence spectra of each compound were measured at the same concentration first (Figure S1a). The absorbance spectrum was taken with a Cary 100 Bio UV−visible spectrophotometer (absorbance region 500–900 nm, blank solvent as baseline), and the fluorescence spectrum was taken by Cary Eclipse fluorescence spectrophotometer (excited with 750 nm light and emission region of 780–900 nm, blank solvent as baseline). Extinction coefficient (ε) of compounds 1 were calculated based on Lambert−Beer’s law (Table S1). Different concentrations of each compound were then prepared with A750 lying in the range between 0.01 and 0.1 (X axis in Figure S1b), and corresponding fluorescence spectrum was taken with area under curve calculated (Y axis in Figure S1b). Fluorescence quantum yield (Φ, in Table S1) of each compound was then calculated based on the equation shown in Figure S1.35 The brightness of each conjugate equals ε × Φ.
Subcellular Localization of Conjugates 1 and Dyes (A−D).
U87 cells were seeded in a 4-well imaging chamber (Lab-Tek no. 155383, ThermoFisher) as 10 000 per well and incubated at 37 °C overnight. 20 μM test compound (conjugates 1 or free dyes A–D) were prepared in FluoroBrite DMEM medium (ThermoFisher) and added to the imaging chamber after removing the original culture medium and incubated at 37 °C for 45 min. The medium was removed and cells were washed with Hank’s balanced salt solution (HBSS) buffer twice. Then cells were incubated with either LysoTracker (1:10 000 dilution, no. L5726, Invitrogen) or Mito-Tracker (1:15 000 dilution, no. M5714, Invitrogen) for 15 min at 37 °C before the HBSS wash. 0.5 mL of FluoroBrite DMEM medium was then added to the imaging chamber followed by 1 drop of NucBlue Live Cell Stain ReadyProbes reagent (no. R37605, Invitrogen). 5 min after incubation, the medium was removed and washed with HBSS buffer once, and fresh FluoroBrite DMEM medium was added.
All images were taken by a confocal fluorescence microscope (Olympus 1000) with 60× (water immerse, NA 1.20) objective, with excitation laser applied: 405 nm for nuclei stain, 488 nm for Lyso- or Mito-tracker, 633 nm for tested near-infrared dye or conjugate in the Microscopy and Imaging Center at Texas A&M University. Pearson’s correlation coefficient (PCC) was used to quantify colocalization of the tested fluorescent compound and stained organelle.36,37 PCC for the region of interest in each set of image was calculated by the Coloc 2 plug-in in Fiji software.
Solubility Determination of 1a.
U87 cell lysate and tumor homogenate were prepared to check the conjugate 1a stability. ~2 g of U87 tumor tissue from a mouse model was cut into small pieces and incubated with 2 mL of RIPA buffer (no. 89901, Thermofisher) on ice for 15 min before being blended. The blended mixture was then centrifuged down, and the supernatant was taken out and filtered through a 0.2 μm mesh filter as the tumor homogenate. To generate U87 cell lysate, U87 cells were cultured in a 75 cm2 tissue culture flask to 80% confluency. After removal of the culturing medium, cells were washed with 8 mL of cold PBS buffer twice and then incubated with 1 mL of RIPA buffer on ice for 25 min. Mixtures were scratched and transferred into a 1.5 mL Eppendorf tube and centrifuged down (12 500g, 4 °C, 20 min) to collect the supernatant as cell lysate. 1a was prepared as 50 μM in U87 tumor homogenate or cell lysate and incubated at 37 °C for up to 72 h. At designed incubation time, 5 μL samples were injected to analytical C4 HPLC column (0.50 mL/min flow rate, 5% MeCN/95% water to 90% MeCN/10% water gradient with 0.1% TFA in 15 min), and traces of absorbance at 780 nm were collected (Figure S4). Area under the curves for 1a was normalized and plotted in GraphPad Prism 6.0 software (Figure 2).
Stability of 1a in mouse serum was also tested in the same way by solubilizing 1a in commercial mouse serum and checked traces of absorbance at 780 nm (Figure S5a). Conjugate 1a was metabolized generating a new compound with longer retention time. When protease and phosphatase inhibitor cocktail (no. 78440, Thermo Fisher) were premixed with serum (10% in serum), the metabolism of 1a was inhibited; incubating 1a in serum at low temperature also inhibited the metabolism (Figure S5b,c).
In Vitro Cytotoxicity.
U87 cells were seeded in 96-well plates as 5000 cells/well (50 μL) and incubated in the incubator overnight. Various concentrations of gemcitabine (gem), its derivative F, conjugates 1a–d, 2a, 2b, 2d as well as free heptamethine dyes A–D were prepared in 50 μL of protein-free hybridoma medium (PFHM II) and added to cells to make final concentrations from 0.001 to 10 μM. All plates were incubated for 72 h, and cell viability was tested with AlamarBlue assay (Invitrogen). Briefly, in a well containing 100 μL of medium, 10 μL of AlamarBlue reagent was added, and the mixture was incubated for 2 h. Fluorescence intensity (Ex/Em 560/590 nm) was measured on a microplate reader (BioTek Synergy H4). Results are processed through GraphPad Prism 6.0 software. Cytotoxicity of dye D was also observed in other’s work.38
To further investigate the tumor targeting effect of compound 1a in vitro, cytotoxicity tests of gem, 1a, 2a, and A against more glioblastoma cell lines LN18 and LN229 as well as a control cell line HEK293 were conducted. Cells were seeded on 96-well plates as 2500 cells/well (50 μL) and incubated in the incubator overnight. Various concentrations of gem, 1a, 2a, and A were prepared in 50 μL of protein-free hybridoma medium (PFHM II) and added to cells to make final concentrations from 0.0001 to 10 μM. All plates were incubated for 72 h, and cell viability was tested with AlamarBlue assay (Invitrogen).
In Vivo Tumor Model Settings.
All animal experiments were performed under approved protocols in compliance with the guidelines established by the Institutional Animal Care and Use Committee (IACUC 2018–0483).
Mice were anesthetized with isoflurane and then imaged for fluorescence or luminescence on an IVIS Spectrum (in vivo imaging system; PerkinElmer). For luminescence imaging, mice were subcutaneously injected with D-luciferin (15 mg/mL; PerkinElmer, no. 122796) in μL at 10× the mouse weight. During imaging mice remained anesthetized by isoflurane. Fluorescence was measured by radiant efficiency, and luminescence was measured by counts. Red fluorescence protein (RFP) from the U87 cells was captured at an excitation wavelength of 570 nm and an emission wavelength of 620 nm. The near IR dye fluorescence was captured at an excitation wavelength of 745 nm and an emission wavelength of 840 nm. Images were captured and data were analyzed using Living Image software (PerkinElmer).
In Vivo Therapeutic Study.
7-week-old Foxn1 nu females were ordered from Jackson Lab. 5 ×10⁵ U87-RFP-LUC cells were injected subcutaneously into the right flank of the mice. Four days later (day 4) intravenous injections of the drugs and vehicle were administered through retro-orbital injections. The mice were injected again 4 days later (day 8), and the injections were subsequently administered once weekly. Compounds were administered at a concentration of 10 mg/kg for 5 weeks. Tumor growth was monitored by luminescence and fluorescence (RFP; 570–620 nm) imaging, and drug clearance/localization of 1a was monitored by the fluorescence imaging (745–840 nm).
A cocktail vehicle (2% DMSO, 9% ethanol, 9% BSA in PBS buffer) was applied to solubilize 1a and gem for retro-orbital injections. 1a was prepared as 3 mM solution, and gem was prepared as 10 mM solution. The volume (<100 μL) of each compound administered was calculated based on the body weight of each mouse to deliver 10 mg/kg dose.
Supplementary Material
ACKNOWLEDGMENTS
Financial support was provided by a DoD BCRP Breakthrough Award (Grant BC141561), CPRIT (Grant RP180875), The Robert A. Welch Foundation (Grant A-1121), The National Science Foundation (NSF, Grant CHE1608009), NIH Grant R01EY029645, and the Texas A&M University T3-Grants Program (246292-00000). NMR instrumentation at Texas A&M University was supported by a grant from the NSF (Grant DBI-9970232) and the Texas A&M University System. The use of the Microscopy and Imaging Center facility at Texas A&M University is acknowledged. The Olympus FV1000 confocal microscope acquisition was supported by the Office of the Vice President for Research at Texas A&M University.
ABBREVIATIONS USED
- Cy7
heptamethine dye
- NIR
near-infrared
- GBM
glioblastoma multiforme
- TMZ
temozolomide
- dFdC or gem
gemcitabine
- RNR
ribonucleotide reductase
- PCC
Pearson’s correlation coefficient
Footnotes
ASSOCIATED CONTENT
Supporting Information
The Supporting Information is available free of charge on the ACS Publications website at DOI: 10.1021/acs.jmedchem.9b01147.
Characterization of all compounds, photophysical properties of compounds 1, subcellular localization of compounds 1 and their parent dyes, stability test of 1a, and more in vitro cytotoxicity and in vivo tumor model study details (PDF)
Molecular formula strings (CSV)
The authors declare no competing financial interest.
REFERENCES
- (1).Zhu P; Du XL; Lu G; Zhu J-J Survival Benefit of Glioblastoma Patients After FDA Approval of Temozolomide Concomitant with Radiation and Bevacizumab: A Population-based Study. Oncotarget 2017, 8, 44015–44031. [DOI] [PMC free article] [PubMed] [Google Scholar]
- (2).Cohen MH; Johnson JR; Pazdur R Food and Drug Administration Drug Approval Summary: Temozolomide Plus Radiation Therapy for the Treatment of Newly Diagnosed Glioblastoma Multiforme. Clin. Cancer Res 2005, 11, 6767–6771. [DOI] [PubMed] [Google Scholar]
- (3).Davis Mary E Glioblastoma: Overview of Disease and Treatment. Clin. J. Oncol. Nurs 2016, 20, S2–S8. [DOI] [PMC free article] [PubMed] [Google Scholar]
- (4).Bastiancich C; Bastiat G; Lagarce F Gemcitabine and Glioblastoma: Challenges and Current Perspectives. Drug Discovery Today 2018, 23, 416–423. [DOI] [PubMed] [Google Scholar]
- (5).Stupp R; Hegi ME; Mason WP; van den Bent MJ; Taphoorn MJB; Janzer RC; Ludwin SK; Allgeier A; Fisher B; Belanger K; Hau P; Brandes AA; Gijtenbeek J; Marosi C; Vecht CJ; Mokhtari K; Wesseling P; Villa S; Eisenhauer E; Gorlia T; Weller M; Lacombe D; Cairncross JG; Mirimanoff RO Effects of Radiotherapy with Concomitant and Adjuvant Temozolomide versus Radiotherapy Alone on Survival in Glioblastoma in a Randomised Phase III Study: 5-year Analysis of the EORTC-NCIC Trial. Lancet Oncol. 2009, 10, 459–466. [DOI] [PubMed] [Google Scholar]
- (6).Moysan E; Bastiat G; Benoit J-P Gemcitabine versus Modified Gemcitabine: A Review of Several Promising Chemical Modifications. Mol. Pharmaceutics 2013, 10, 430–444. [DOI] [PubMed] [Google Scholar]
- (7).Plunkett W; Huang P; Xu Y-Z; Heinemann V; Grunewald R; Gandhi V Gemcitabine: Metabolism, Mechanisms of Action, and Self-potentiation. Semin. Oncol 1995, 22, 3–10. [PubMed] [Google Scholar]
- (8).Pulido J; Sobczak AJ; Balzarini J; Wnuk SF Synthesis and Cytostatic Evaluation of 4-N-Alkanoyl and 4-N-Alkyl Gemcitabine Analogs. J. Med. Chem 2014, 57, 191–203. [DOI] [PMC free article] [PubMed] [Google Scholar]
- (9).Rieger J; Durka S; Streffer J; Dichgans J; Weller M Gemcitabine Cytotoxicity of Human Malignant Glioma Cells: Modulation by Antioxidants, BCL-2 and Dexamethasone. Eur. J. Pharmacol 1999, 365, 301–308. [DOI] [PubMed] [Google Scholar]
- (10).Kerr JZ; Berg SL; Dauser R; Nuchtern J; Egorin MJ; McGuffey L; Aleksic A; Blaney S Plasma and Cerebrospinal Fluid Pharmacokinetics of Gemcitabine After Intravenous Administration in Nonhuman Primates. Cancer Chemother. Pharmacol 2001, 47, 411–414. [DOI] [PubMed] [Google Scholar]
- (11).Apparaju SK; Gudelsky GA; Desai PB Pharmacokinetics of Gemcitabine in Tumor and Non-tumor Extracellular Fluid of Brain: an In Vivo Assessment in Rats Employing Intracerebral Microdialysis. Cancer Chemother. Pharmacol 2007, 61, 223–229. [DOI] [PubMed] [Google Scholar]
- (12).Peer D; Karp JM; Hong S; Farokhzad OC; Margalit R; Langer R Nanocarriers as an Emerging Platform for Cancer Therapy. Nat. Nanotechnol 2007, 2, 751–760. [DOI] [PubMed] [Google Scholar]
- (13).Yang X; Shi C; Tong R; Qian W; Zhau HE; Wang R; Zhu G; Cheng J; Yang VW; Cheng T; Henary M; Strekowski L; Chung LWK Near IR Heptamethine Cyanine Dye-Mediated Cancer Imaging. Clin. Cancer Res 2010, 16, 2833–2844. [DOI] [PMC free article] [PubMed] [Google Scholar]
- (14).Zhang C; Liu T; Su Y; Luo S; Zhu Y; Tan X; Fan S; Zhang L; Zhou Y; Cheng T; Shi C A Near-infrared Fluorescent Heptamethine Indocyanine Dye with Preferential Tumor Accumulation for In Vivo Imaging. Biomaterials 2010, 31, 6612–6617. [DOI] [PubMed] [Google Scholar]
- (15).Wu JB; Shi C; Chu GC-Y; Xu Q; Zhang Y; Li Q; Yu JS; Zhau HE; Chung LWK. Near-Infrared Fluorescence Heptamethine Carbocyanine Dyes Mediate Imaging and Targeted Drug Delivery for Human Brain Tumor. Biomaterials 2015, 67, 1–10. [DOI] [PMC free article] [PubMed] [Google Scholar]
- (16).Shi C; Wu JB; Pan D Review on Near-infrared Heptamethine Cyanine Dyes as Theranostic Agents for Tumor Imaging, Targeting, and Photodynamic Therapy. J. Biomed. Opt 2016, 21, 050901. [DOI] [PubMed] [Google Scholar]
- (17).Zhang E; Luo S; Tan X; Shi C Mechanistic Study of IR780 Dye as a Potential Tumor Targeting and Drug Delivery Agent. Biomaterials 2014, 35, 771–778. [DOI] [PubMed] [Google Scholar]
- (18).Kushal S; Wang W; Vaikari VP; Kota R; Chen K; Yeh T-S; Jhaveri N; Groshen SL; Olenyuk BZ; Chen TC; Hofman FM; Shih JC Monoamine Oxidase A (MAO A) Inhibitors Decrease Glioma Progression. Oncotarget 2016, 7, 13842–13853. [DOI] [PMC free article] [PubMed] [Google Scholar]
- (19).Dasari M; Acharya AP; Kim D; Lee S; Lee S; Rhea J; Molinaro R; Murthy N H-Gemcitabine: A New Gemcitabine Prodrug for Treating Cancer. Bioconjugate Chem. 2013, 24, 4–8. [DOI] [PMC free article] [PubMed] [Google Scholar]
- (20).Yang Z; Lee Jae H; Jeon HM; Han JH; Park N; He Y; Lee H; Hong KS; Kang C; Kim JS Folate-Based Near-Infrared Fluorescent Theranostic Gemcitabine Delivery. J. Am. Chem. Soc 2013, 135, 11657–11662. [DOI] [PubMed] [Google Scholar]
- (21).Quinn BA; Wang S; Barile E; Das SK; Emdad L; Sarkar D; De SK; Morvaridi SK; Stebbins JL; Pandol SJ; Fisher PB; Pellecchia M Therapy of Pancreatic Cancer via an EphA2 Receptor-Targeted Delivery of Gemcitabine. Oncotarget 2016, 7, 17103–17110. [DOI] [PMC free article] [PubMed] [Google Scholar]
- (22).Zhang X; Zhao N; Wang B; Tian Z; Dai Y; Ning P; Chen D Structure-inherent Near-infrared Fluorescent Probe Mediates Apoptosis Imaging and Targeted Drug Delivery In Vivo. Dyes Pigm. 2017, 138, 204–212. [Google Scholar]
- (23).Lin C-M; Usama SM; Burgess K Site-specific Labeling of Proteins with Near-IR Dyes. Molecules 2018, 23, 2900. [DOI] [PMC free article] [PubMed] [Google Scholar]
- (24).Usam SM.; Li C-M.; Burges K. On the Mechanisms of Update of Tumor-seeking Cyanine Dyes. Bioconjugate Chem. 2018, 29, 3886–3895. [DOI] [PubMed] [Google Scholar]
- (25).Levitt DG; Levitt MD Human Serum Albumin Homeostasis: a New Look at the Roles of Synthesis, Catabolism, Renal and Gastrointestinal Excretion, and the Clinical Value of Serum Albumin Measurements. Int. J. Gen. Med 2016, 9, 229–255. [DOI] [PMC free article] [PubMed] [Google Scholar]
- (26).Liu Z; Chen X Simple Bioconjugate Chemistry Serves Great Clinical Advances: Albumin as a Versatile Platform for Diagnosis and Precision Therapy. Chem. Soc. Rev 2016, 45, 1432–1456. [DOI] [PMC free article] [PubMed] [Google Scholar]
- (27).Frei E Albumin Binding Ligands and Albumin Conjugate Uptake by Cancer Cells. Diabetol. Metab. Syndr 2011, 3, 11. [DOI] [PMC free article] [PubMed] [Google Scholar]
- (28).Stehle G; Sinn H; Wunder A; Schrenk HH; Schutt S; Maier-Borst W; Heene DL The Loading Rate Determines Tumor Targeting Properties of Methotrexate-albumin Conjugates in Rats. Anti-Cancer Drugs 1997, 8, 667–685. [PubMed] [Google Scholar]
- (29).Canovas C; Bellaye P-S; Moreau M; Romieu A; Denat F; Goncalves V Site-specific Near-infrared Fluorescent Labelling of Proteins on Cysteine Residues with Meso-chloro-substituted Heptamethine Cyanine Dyes. Org. Biomol. Chem 2018, 16, 8831–8836. [DOI] [PubMed] [Google Scholar]
- (30).Koolen SLW; Witteveen PO; Jansen RS; Langenberg MHG; Kronemeijer RH; Nol A; Garcia-Ribas I; Callies S; Benhadji KA; Slapak CA; Beijnen JH; Voest EE; Schellens JHM Phase I Study of Oral Gemcitabine Prodrug (LY2334737) Alone and in Combination with Erlotinib in Patients with Advanced Solid Tumors. Clin. Cancer Res 2011, 17, 6071–6082. [DOI] [PubMed] [Google Scholar]
- (31).Shin DH; Xuan S; Kim W-Y; Bae G-U; Kim J-S CD133 Antibody-conjugated Immunoliposomes Encapsulating Gemcitabine for Targeting Glioblastoma Stem Cells. J. Mater. Chem. B 2014, 2, 3771–3781. [DOI] [PubMed] [Google Scholar]
- (32).Luo S; Tan X; Fang S; Wang Y; Liu T; Wang X; Yuan Y; Sun H; Qi Q; Shi C Mitochondria-Targeted Small-Molecule Fluorophores for Dual Modal Cancer Phototherapy. Adv. Funct. Mater 2016, 26, 2826–2835. [Google Scholar]
- (33).Lv Q; Wang D; Yang Z; Yang J; Zhang R; Yang X; Wang M; Wang Y Repurposing Antitubercular Agent Isoniazid for Treatment of Prostate Cancer. Biomater. Sci 2019, 7, 296–306. [DOI] [PubMed] [Google Scholar]
- (34).Usama SM; Thavornpradit S; Burgess K Optimized Heptamethine Cyanines for Photodynamic Therapy. ACS Appl. Bio Mater 2018, 1, 1195–1205. [DOI] [PubMed] [Google Scholar]
- (35).Mottram LF; Maddox E; Schwab M; Beaufils F; Peterson BR A Concise Synthesis of the Pennsylvania Green Fluorophore and Labeling of Intracellular Targets with O6-Benzylguanine Derivatives. Org. Lett 2007, 9, 3741–3744. [DOI] [PubMed] [Google Scholar]
- (36).Adler J; Parmryd I Quantifying Colocalization by Correlation: The Pearson Correlation Coefficient Is Superior to the Mander’s Overlap Coefficient. Cytometry, Part A 2010, 77, 733–742. [DOI] [PubMed] [Google Scholar]
- (37).Dunn KW; Kamocka MM; McDonald JH A Practical Guide to Evaluating Colocalization in Biological Microscopy. Am. J. Physiol 2011, 300, C723–C742. [DOI] [PMC free article] [PubMed] [Google Scholar]
- (38).Wang Y; Liu T; Zhang E; Luo S; Tan X; Shi C Preferential Accumulation of the Near Iinfrared Heptamethine Dye IR-780 in the Mitochondria of Drug-resistant Lung Cancer Cells. Biomaterials 2014, 35, 4116–4124. [DOI] [PubMed] [Google Scholar]
Associated Data
This section collects any data citations, data availability statements, or supplementary materials included in this article.


