Abstract
The increasing awareness of the adverse effects associated with radiation exposure in computed tomography (CT) has necessesitated the quantification of dose delivered to patients for better risk assessment in the clinic. The current methods for dose quantification used in the clinic are approximations, lacking realistic models for the irradiation conditions utilized in the scan and the anatomy of the patient being imaged, which limits their relevance for a particular patient. The established gold-standard technique for individualized dose quantification uses Monte Carlo (MC) simulations to obtain patient-specific estimates of organ dose in anatomically realistic computational phantoms to provide patient-specific estimates of organ dose. Although accurate, MC simulations are computationally expensive, which limits their utility for time-constrained applications in the clinic. To overcome these shortcomings, a real-time GPU-based MC tool based on FDA’s MC-GPU framework was developed for patient and scanner-specific dosimetry in the clinic. The tool was validated against (1) AAPM’s TG-195 reference datasets and (2) physical measurements of dose acquired using TLD chips in adult and pediatric anthropomorphic phantoms. To demonstrate its utility towards providing individualized dose estimates, it was integrated with an automatic segmentation method for generating patient-specific models, which were then used to estimate patient- and scanner-specific organ doses for a select population of 50 adult patients using a clinically relevant CT protocol. The organ dose estimates were compared to corresponding dose estimates from a previously validated MC method based on Penelope. The dose estimates from our MC tool agreed within 5% for all organs (except thyroid) tabulated by TG-195 and within 10% for all TLD locations in the adult and pediactric phantoms, across all validation cases. Compared against Penelope, the organ dose estimates agreed within 3% on average for all organs in the patient population study. The average run duration for each patient was estimated at 23.79 s, representing a significant speedup (~700×) over existing non-parallelized MC methods. The accuracy of dose estimates combined with a significant improvement in execution times suggests a feasible solution utilizing the proposed MC tool for real-time individualized dosimetry in the clinic.
Keywords: computed tomography, Monte Carlo, radiation dose, real-time, patient-specific, GPU
1. Introduction
The use of computed tomography (CT) has increased significantly in recent years, with more than 85 million scans conducted per year in the United States alone (Hall and Brenner 2012). This increased usage can be attributed to the enormous potential of CT for aiding the screening, diagnosis, and treatment of multiple disorders in both adult and pediatric patients. Despite its advantages, the increased usage of CT has also led to a proportional increase in the burden associated with medical radiation exposure, necessitating the evaluation of risk to patients for better care in the clinic. The first step towards evaluating the risk from medical radiation exposure is the accurate quantification of radiation dose imparted to patients during a CT scan.
The current clinical scanners display volume CT dose index (CTDIvol) and dose length product (DLP) as metrics of radiation burden to the patient. Although these metrics take some of the scan parameters (tube voltage, tube current, gantry rotation time, pitch and bowtie filter) into account, they are agnostic to patient size and anatomy, and hence not representative of the actual dose absorbed by the patient (McCollough et al 2012). To overcome this shortcoming, a size-specific dose estimate (SSDE) (Brink and Morin 2012) can be computed using the CTDIvol and size-dependent conversion factors to account for the patient size while estimating the dose imparted to patients. Although this is a step forward in the direction of patient-specific dosimetry, the SSDE still does not account for patient anatomy and cannot be directly used to estimate organ dose, the most relevant metric for gauging the radiation risk to the patient from a CT scan (Costello et al 2013).
Several studies (Turner et al 2010, Li et al 2012, Tian et al 2013) have attempted to translate these machine-derived quantities (CTDIvol and DLP) obtained in the clinic to organ dose estimates using protocol, patient, and organ-specific dose coefficients. While these studies have been promising towards approximating patient-specific dose estimates, they usually utilize phantom matching methods, thereby representing the dose delivered to the closest matched patient model in the phantom library and not the actual patient being imaged.
Beyond the patient anatomy, the existing metrics for estimating organ dose in the clinic are also limited by the lack of an exact model for the irradiation conditions of a CT scan. This is especially true for scans utilizing the tube current modulation (TCM) technique. The traditional method for quantifying the radiation burden from a TCM scan uses a CTDIvol value estimated using the average tube current and ignores the local variations of the dose field for each organ (Li et al 2014). Although several approximation techniques (International Electrotechnical Commission 2009, Tian et al 2016) have been introduced to account for this shortcoming, they are at best approximations only, which may not fully account for the varying contribution of scatter and precise fluctuations in tube current.
The current gold standard for CT dosimetry utilizes Monte Carlo (MC) simulations in association with anatomically realistic computational phantoms to provide patient-specific estimates of organ dose. Although accurate, this technique of using MC simulations for dose estimations is computationally expensive, leading to turnaround times in the order of hours for simulating a single patient. This prohibitive nature of the MC technique limits its utility towards time constrained applications in the clinic. The existing simulation tools (Chen et al 2012, Morato et al 2017) that attempt to overcome this barrier by parallelizing the simulations are not patient- or scanner-specific, which limits the relevance of the dose estimates for a particular patient.
To address these shortcomings, we propose a validated GPU-based MC tool based on the MC-GPU (Badal and Badano 2009) framework, developed by FDA, for real-time patient- and scanner-specific dosimetry in the clinic. The tool implements parallelized x-ray transport models in association with realistic implementations of scanner-specific CT components to obtain accurate dose estimates in voxelized patient-specific computational models. To demonstrate the utility of the tool towards providing individualized dose estimates, it was integrated with an automatic segmentation methodology for constructing patient-specific models from CT imaging datasets, which were then simulated using a clinically relevant protocol to provide organ dose estimates for those patients. The timing information for each of these scans was also established to gauge the feasibility for application in the time-constrained environment of the clinic.
2. Methods
The development of the GPU-based MC tool was performed in three phases: validation of the MC-GPU framework against existing reference datasets, modification of the MC-GPU framework for modeling scanner-specific geometry and components, and post-development validation of the MC tool against dose measurements acquired on a physical CT scanner using TLD chips placed in anthropomorphic phantoms. The validated MC tool was then used to provide individualized dose estimates for a select population of adult patients using a clinical scan protocol.
2.1. Validation of MC-GPU framework against AAPM TG-195 reference datasets
For the validation of MC-GPU (v.1.3) framework, we utilized the AAPM TG-195’s ‘Monte Carlo Reference Data Sets for Imaging Research’ (Sechopoulos et al 2015) with ‘Case 5: CT with a Voxelized Solid’ as our chosen benchmark. This case aims to verify the accuracy of voxel-based x-ray transport and related interaction characteristics by reporting absorbed energies for each organ in a voxelized phantom from reference simulations performed using four common MC packages—GEANT4, MCNP, EGSnrc and Penelope.
For performing the validation tests involving the ‘continuous’ source, the default MC-GPU kernel code was modified to rotate the source by a random angle, sampled uniformly between 0° and 360° for each photon emitted from the x-ray source. For each of the validation tests described in the TG-195 report, a corresponding simulation was performed using 109 histories to achieve statistical accuracy within 1% for the energy deposited in all organs (except the adrenals) tabulated in the report. The energy deposited per history estimated from the simulations was then compared against values from the TG-195 dataset and the resulting differences were quantified to validate MC-GPU against other MC packages.
2.2. Modelling of scanner-specific geometry and components
Post validation, the source code for the MC-GPU framework was modified to model a realistic CT scanner by incorporating parametric implementations for scanner-specific geometry and components. This primarily involved the inclusion of a bowtie filter and TCM functionality, since the dose absorbed by the patient is highly sensitive to variations in the irradiation field.
For modelling the bowtie filter, a custom program was written using MATLAB to convert the filter profiles into probability functions for sampling photon energies and directions at a point x-ray source. The script utilizes the scanner-specific bowtie material and geometry descriptions to generate a post-bowtie matrix containing attenuated polyenergetic x-ray spectra for all angles along the fan direction within the confines of the beam. The post-bowtie matrix serves as an input to the MC tool and is used as the basis for sampling the initial energy and direction along the fan angle for each photon tracked in the simulation. Ignoring the non-uniformity in the irradiation field due to anode heel effect, the direction of the photons along the cone angle were sampled from a uniform distribution. This is justified since the variation of the irradiation field along the cone angle is minimal compared to the variation along the fan angle due to limited beam width along that direction.
The implementation of the TCM functionality utilized an existing MATLAB program to generate combined longitudinal and angular modulation profiles as a function of the projection angle (Li et al 2014). The program utilizes the polyenergetic x-ray spectrum, scanner-specific geometry, and combined attenuation of the patient and the bowtie filter to produce TCM profiles that resemble their proprietary clinical counterparts. The generated modulation profiles were further normalized to the peak current value of the distribution. The TCM profiles obtained from the program were used as input to the MC tool and served as the basis for scaling the number of photons simulated for each projection angle. For cases where the projection angles used in the simulation did not align with the angles tabulated in the TCM profile, a linear interpolation scheme between the nearest data points was used to obtain the corresponding modulation value.
The design of the MC tool provides the functionality to operate all the incorporated scanner-specific components (bowtie filter and TCM) in a parametric fashion using the script-based operational structure of MC-GPU, making the tool flexible to model the different commercial or prototype CT scanners. A simple schematic summarizing the functionality of the proposed tool is shown in figure 1.
Figure 1.
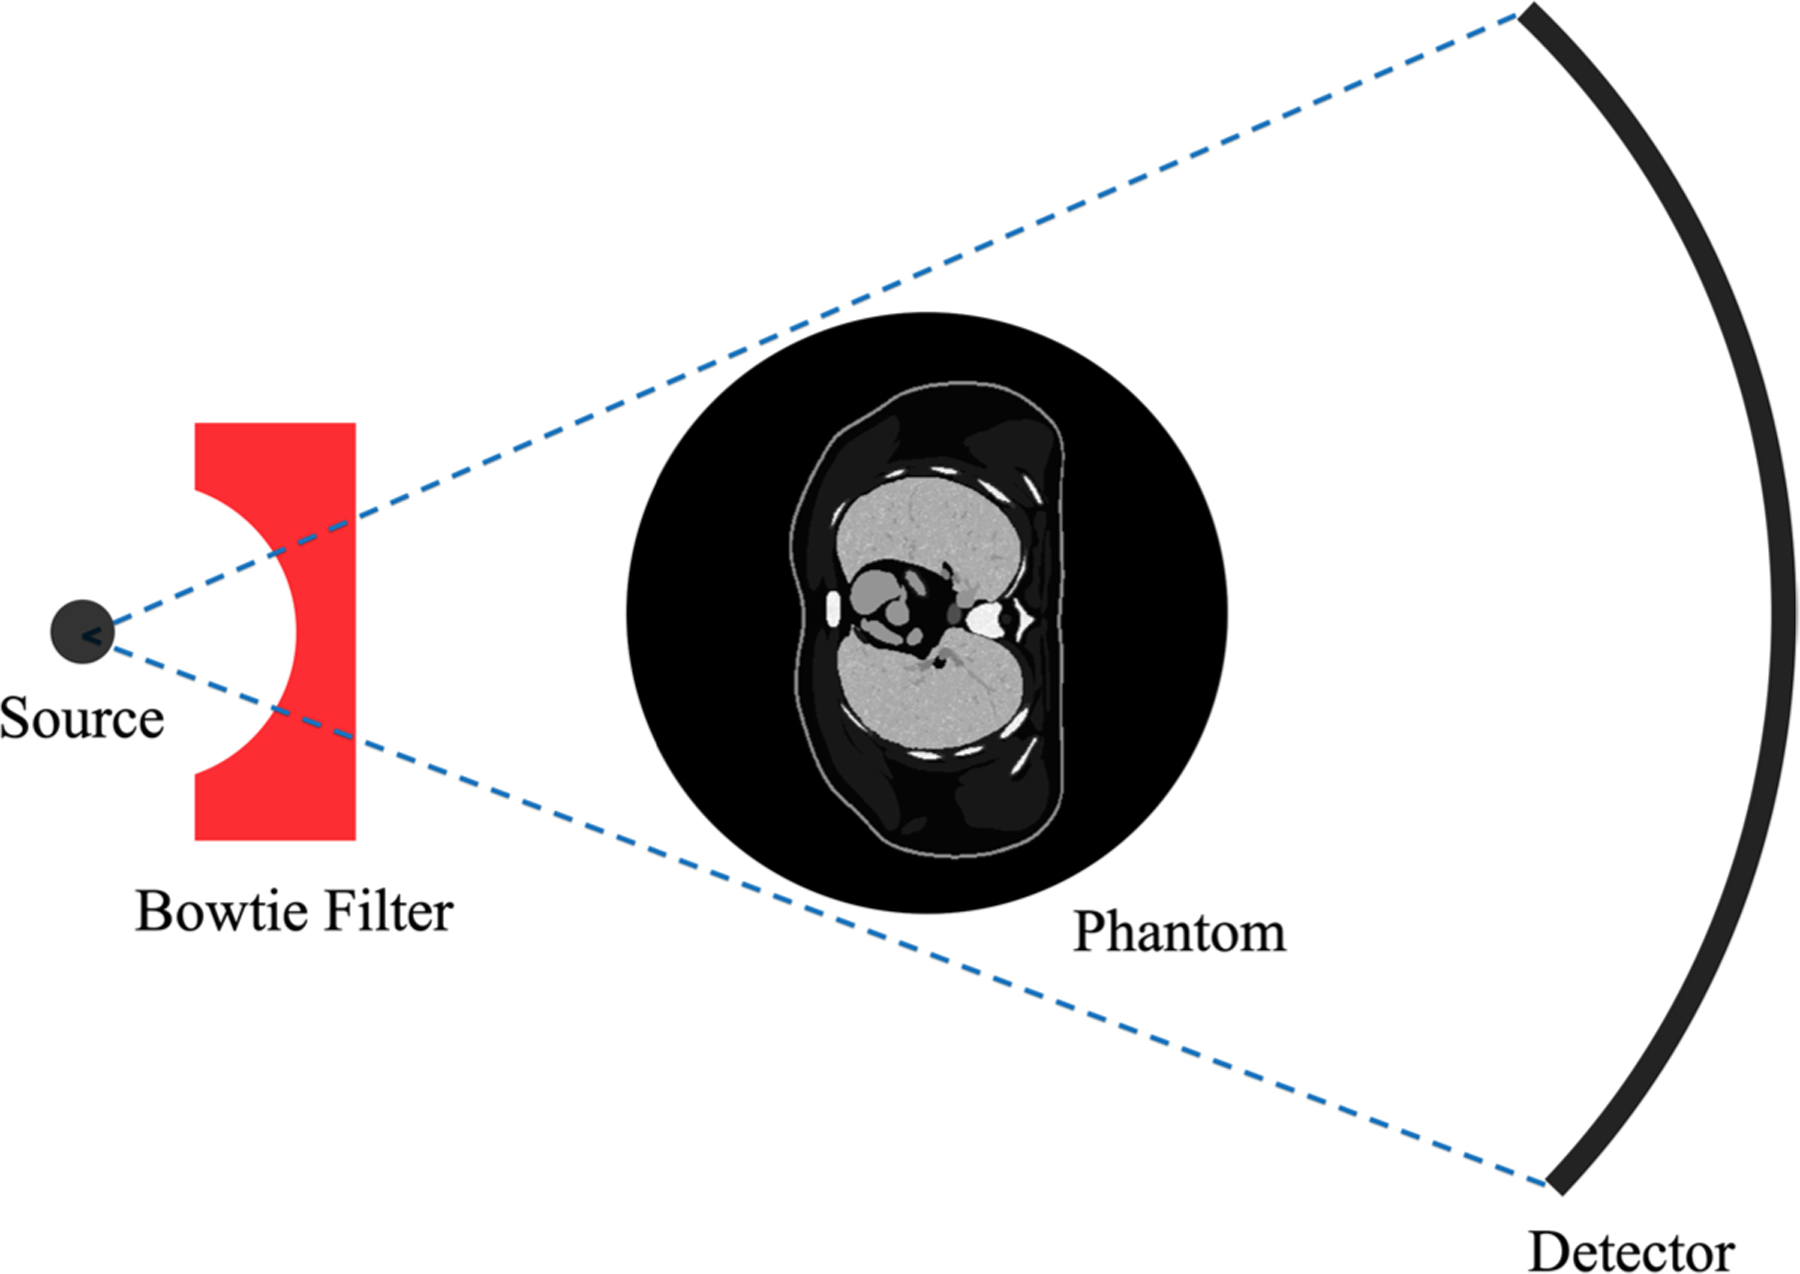
A simple schematic for the GPU-based MC tool developed in this study. The photons are generated at the source and filtered with a scanner-specific bowtie filter using a probability matrix defining the post-bowtie irradiation field. In case of TCM, the number of photons generated at the source is modulated according to the attenuation profile of the phantom. The photons are then tracked through the phantom to obtain an estimate for the dose absorbed in each voxel.
2.3. Validation against physical dose measurements
To gauge the accuracy of our MC tool towards providing dose estimates in human anatomical structures, we further validated its dose estimates against measurements acquired on a physical CT scanner using TLD chips placed in adult and pediatric anthropomorphic phantoms.
For the dose measurements, we utilized a pediatric 5 year old (y.o.) phantom and an adult male phantom (ATOM, Models 701D and 705D, Norfolk, VA), as shown in figure 2. The phantoms were comprised of 25 mm thick axial slices, with through-holes at various organ locations. For selected organ locations (lung, heart, bone marrow, liver, spleen, stomach, kidney, and bladder) in both the pediatric and adult phantoms, three TLD chips (TLD-100, Thermoscientific, Oakwood Village, OH) were sandwiched between the supplied plugs and placed in the corresponding hole. The TLD locations were carefully selected to validate MC radiation transport at different depths and material mediums in the phantoms. The empty holes containing no TLD chips were filled with plugs made of the surrounding material. The mean of the absorbed dose registered by the three TLDs placed in each hole was used as an estimate of the absorbed dose at that location. The standard error for the measurement at a single location was computed using the standard deviation of the dose registered by the three TLDs in that location.
Figure 2.
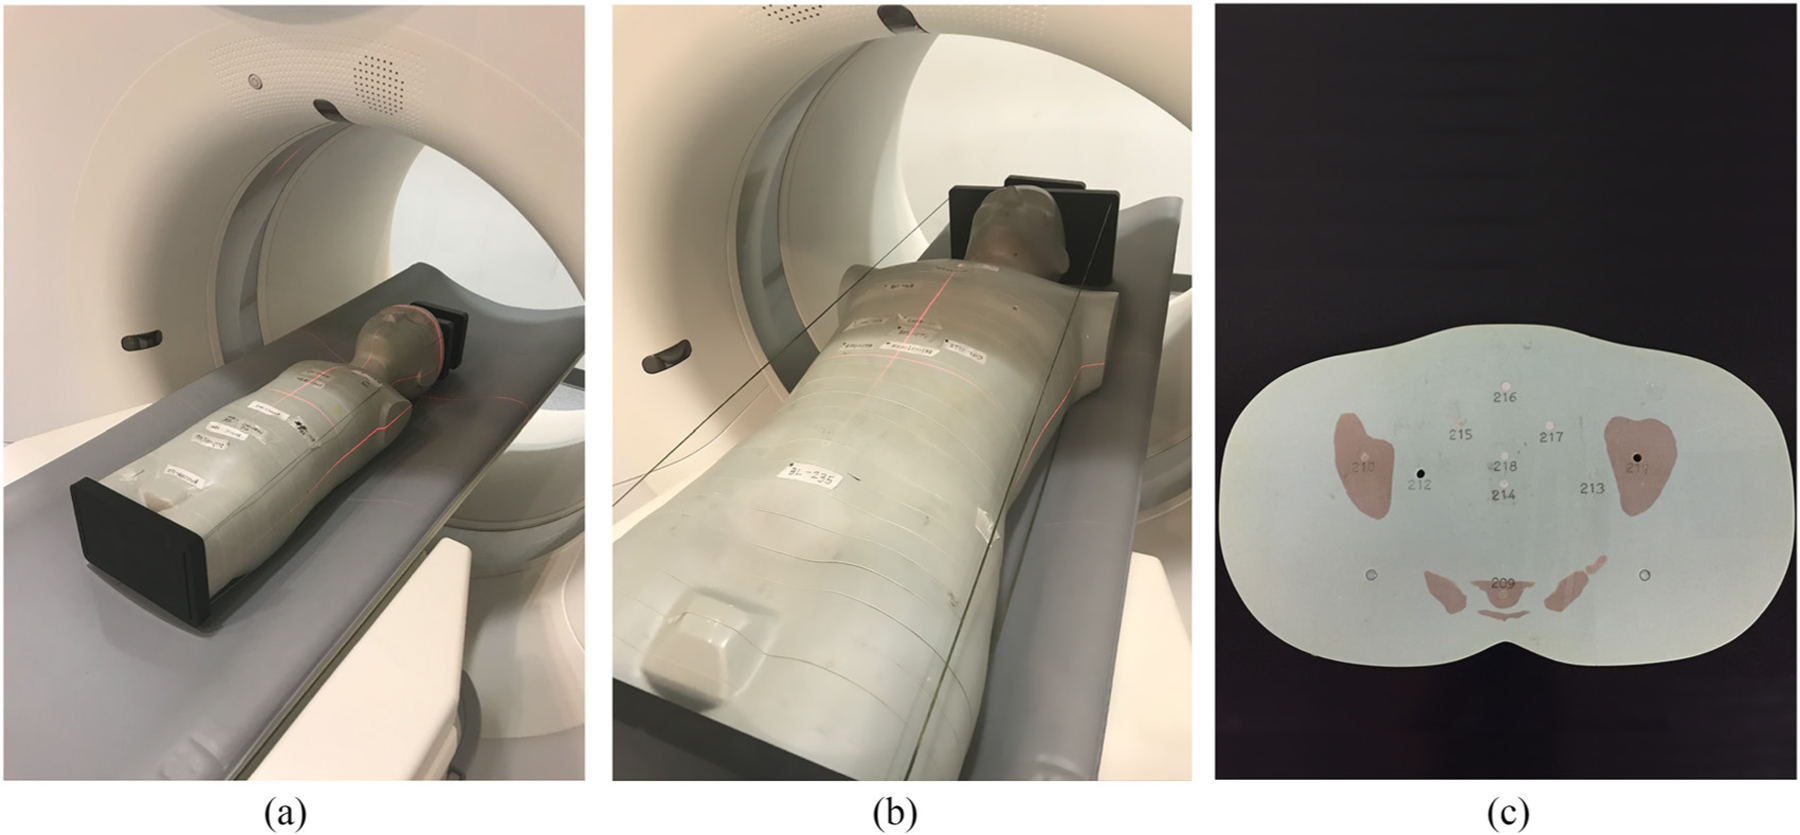
Dose measurements in (a) a pediatric 5 y.o. phantom and (b) an adult male phantom performed on the Definition Flash (Siemens Healthineers, Germany) scanner. (c) Each of the phantoms was made of 25 mm axial slices with through-holes at organ locations for TLD placement.
The phantoms with the TLDs inserted at various organ locations were then scanned helically using a clinical CT system (Definition Flash, Siemens Healthineers, Germany) at 80 and 120 kV using the chest–abdomen–pelvis (CAP) protocol at constant tube current. The details of the protocols used to scan the adult and the pediatric phantoms are summarized in table 1. The CAP protocol was specifically chosen for this study so that all the TLD locations were within the primary irradiation field of the x-ray source. Uncertainty in the dose measured by the TLDs was reduced using higher x-ray tube current, lower pitch (compared to typical clinical protocols), and multiple repetitive runs for each protocol. A lower pitch value also helped reduce the uncertainty from the unknown starting angle for the x-ray tube. The dose values registered by the TLDs were eventually scaled down by the number of runs used for each protocol for comparison with the simulated dose values.
Table 1.
Scan settings used on the Definition Flash (Siemens Healthineers, Germany) scanner for acquiring TLD dose measurements in adult and pediatric phantoms using a clinical CAP protocol.
| Pediatric phantom | Adult phantom | |
|---|---|---|
| Scan type | Helical | Helical |
| Body region | Chest-abdomen-pelvi s | Chest-abdomen-pelvis |
| kV | 80, 120 | 80, 120 |
| mA | 611, 170 | 491, 142 |
| Gantry rotation period (s) | 0.5 | 0.5 |
| Bowtie filter | Narrow | Standard |
| Collimation (mm) | 19.2a, 38.4 | 38.4 |
| Pitch | 0.8 | 0.8 |
A smaller collimation setting of 19.2 mm (compared to 38.4 mm) was accidently selected for acquiring the dose measurement at 80 kV for the pediatric phantom.
Following the dose measurements, the CT images acquired on the scanner were used to create computational models for the adult and pediatric phantoms. The method used for creating the computational models was similar to the one described by Segars et al for creating the original XCAT phantoms (Segars et al 2010). The segmented regions from the CT images included soft tissue, lung, bone, spinal cord, and spinal disk. The locations corresponding to the TLD chips were manually segmented as cylindrical volumes. To account for the attenuation from the CT table, a corresponding region for both the table interior and exterior was also manually segmented from the CT images. Following the segmentation, a 3D polygonal model for each of the regions was created and voxelized at resolutions comparable to the acquired CT images (axial: 0.98 mm, longitudinal: 0.75 mm). Each segmented region was assigned material properties (elemental composition and density) based on the definitions available in the CIRS manual. The tissue-equivalent TLD regions were assigned material properties corresponding to soft tissue. The interior and exterior of the CT table were assigned the general material properties of acrylic foam and carbon fiber respectively.
To validate the dose estimates from the MC tool, the computer models generated using the CT images were simulated with scanner geometry and coverage reproduced from the physical scans. Since the tube starting angles for the physical helical scans were unknown, each of the simulations was repeated four times, with the starting angle differing by 90° for each run. The number of histories per projection used for the simulation was 108 to achieve a statistical accuracy (standard error) within 1% for each of the TLD locations. The energy deposited at each TLD location used to calculate dose represents kerma (kinetic energy released per unit mass) at a photon energy cut-off of 0.5 keV and does not account for secondary electron transport. This is a good approximation since the typical range of photons below the energy cut-off and secondary electrons at CT energies are significantly lower than the voxel size used for the simulation (Gupta 2015). In addition to accumulating the deposited energy, the incident spectrum to each TLD location was also tabulated to obtain the correct energy response factor (relative to Co-60) for each of the physical TLD chips used in the measurement (Nunn et al 2008).
To correct for the measurement uncertainties in the magnitudes of the proprietary photons per mAs values (N) that were used to scale the dose per history obtained from the MC simulations, an output calibration factor (OCF) for each protocol used for TLD measurement was computed by calibrating the simulated CTDIvol values for a given protocol against the corresponding values displayed on the CT console as
For simulating the CTDIvol values used for computing the OCFs, a computational model representing a physical CTDI phantom (a PMMA cylinder of 1.19 g cm−3 density, 32 cm diameter, and 15 cm length) was generated, simulated for a given protocol and the dose to the air inserts combined to produce the corresponding CTDIvol value (McCollough et al 2008). This is similar to the method described by Li et al (2011), where dose measurements in the air cavity of the ion chamber were used to correct for the inconsistencies in the magnitudes of the pre-bowtie spectra. The OCFs were then used to compute the corrected photons per mAs values (N′) as
The corrected photons per mAs values were used to scale the dose per history values obtained from MC simulations for each of the different tube starting angles and the values were averaged to obtain dose estimates for each of the TLD locations for all validation cases. The obtained dose estimates were compared to the dose measured by the TLD chips at the corresponding locations and the differences were quantified as percentages.
2.4. Individualized dosimetry for a select population of patients
To demonstrate the capability of the developed MC tool towards providing individualized dose estimates in the clinic, we simulated clinical CT acquisitions for a population of 50 adult patient models (age range, 18 to 78 y.o.; weight range, 52–117 kg; sex (M/F), 31/19). The patient-specific models constituting the population were constructed using automatic segmentation (Fu et al 2018) of randomly selected CAP CT datasets from the Duke University imaging database (Segars et al 2013). Sample slices from the CT image dataset for one of the patients used in this study along with the corresponding masks for the automatically segmented organs are shown in figure 3. The patient models were selected to represent the variability in body habitus and anatomy observed in a clinical patient population. The organs and anatomical structures segmented from the imaging datasets included lungs, soft tissue organs (heart, liver, kidneys, spleen, gallbladder, and stomach), and bones (ribs, spine, sternum, pelvis, clavicle, and femur). The voxel size for the patient models was chosen to be 2.5 and 5 mm in the in-plane and longitudinal directions, respectively, balancing the trade-off between the speed of automatic segmentation and accuracy of dose estimates.
Figure 3.
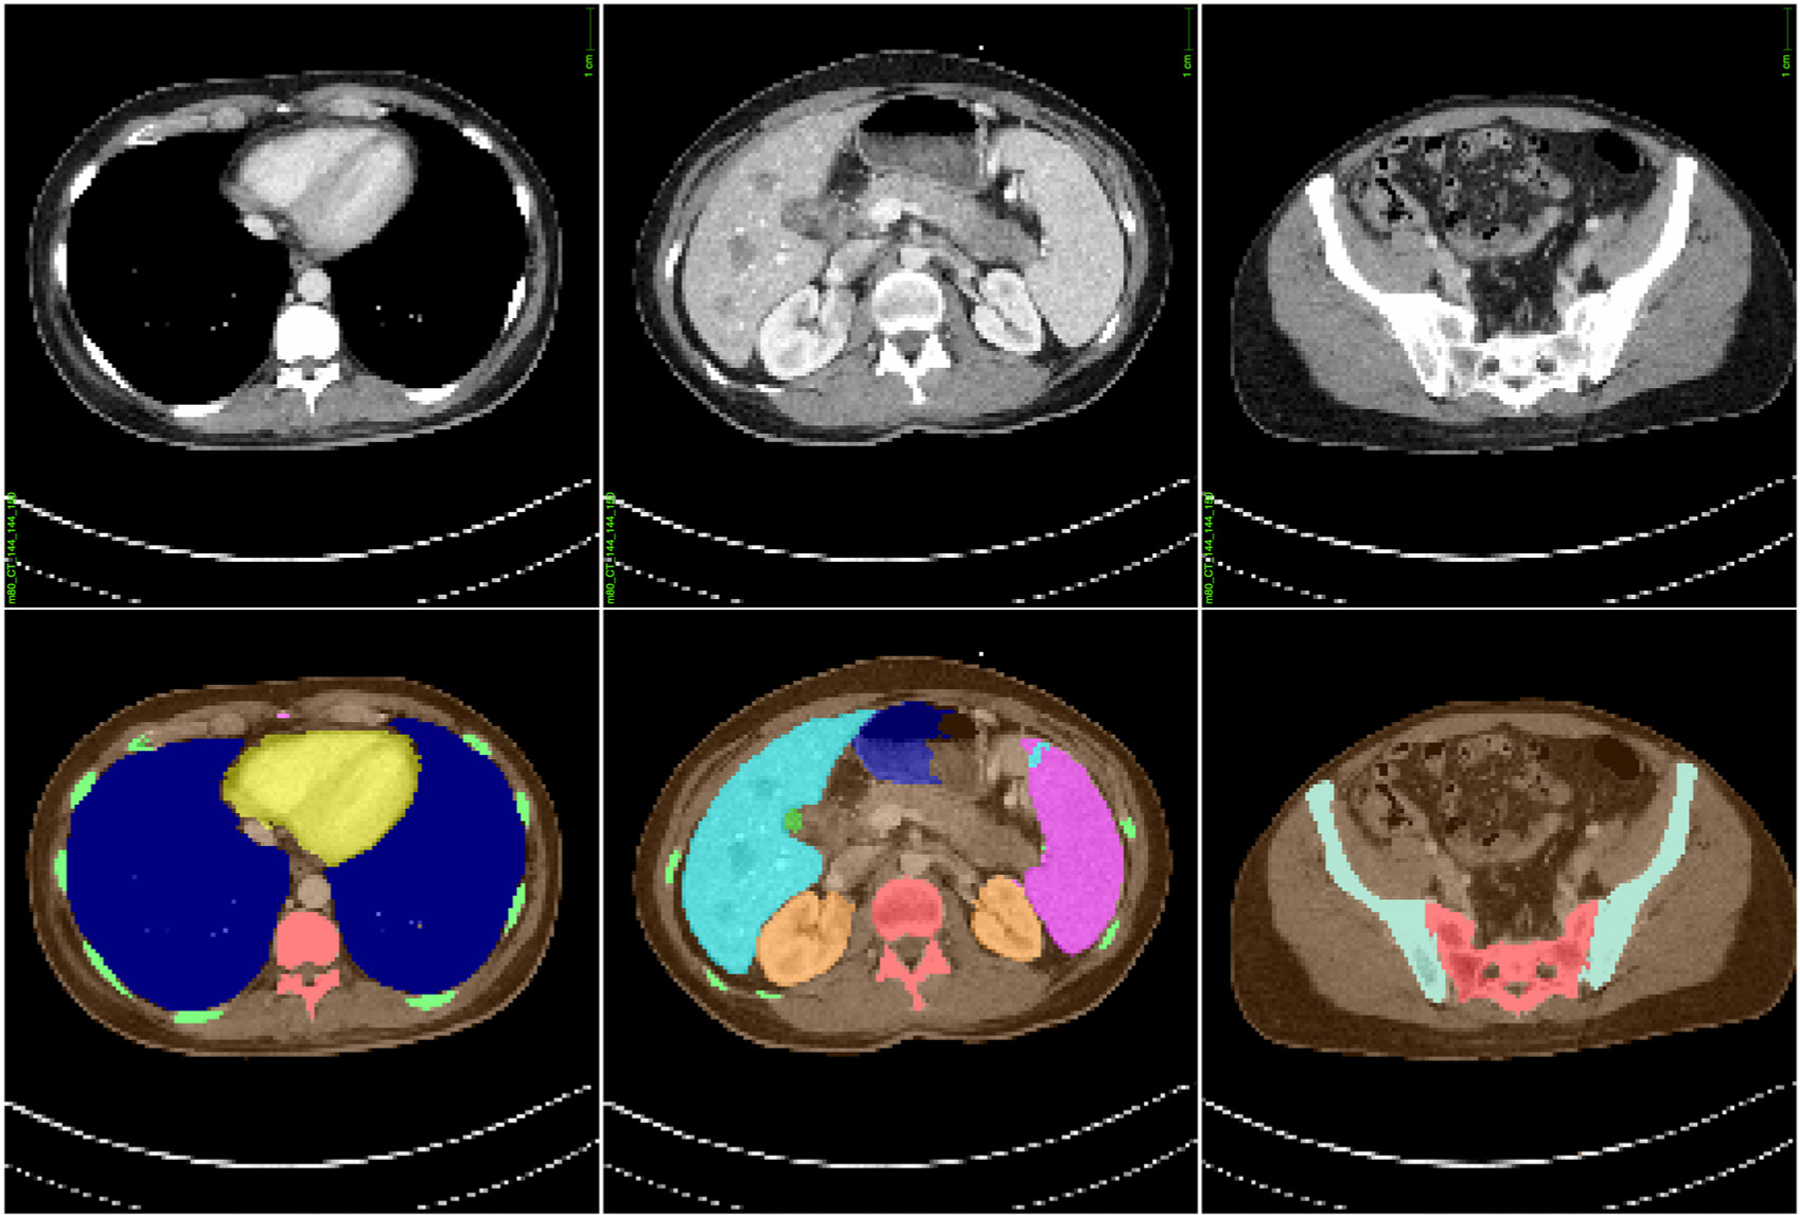
Sample slices from the CAP CT image dataset (top) for one of the patients used in this study along with corresponding masks (bottom) for automatically segmented organs used for generating models of patient-specific anatomy. The models constructed from imaging datasets of the patient population were simulated with the MC tool developed in this study to demonstrate a framework for individualized dose estimations in CT.
Once the CT images were segmented and the corresponding patient models were constructed, the models were simulated for dose using a CAP protocol analogous to the one using which the images were acquired. Similar to the validation study performed in the section 2.3, this involved modelling the scanner-specific geometry and components for the scanner (Definition Flash, Siemens Healthineers, Germany) and simulating the patient models using a tube voltage of 120 kV filtered with a standard bowtie, pitch of 0.8, and collimation of 38.4 mm. For estimating organ doses for each of the patient models, simulations were performed using 106 histories per projection to keep the standard error within 1% for all organs. The simulations were performed on a machine with Intel® Xeon® CPU E5–2620 v4 2.10GHz, 64 GB DDR4 (2400 MHz) memory, and a single NVIDIA GeForce GTX Titan X GPU.
The organ dose values per history obtained from the simulation were corrected using the OCF computed for the adult 120 kV protocol in section 2.3 and then normalized to the units of mGy/100 mAs. As an additional validation step, the organ dose estimates were also compared against corresponding dose estimates from a previously validated MC method based on Penelope (Li et al 2011). In addition to tabulating organ doses, the run duration for simulating each of the patient models for dose was also tabulated to quantify the real-time capabilities of our MC tool. This duration included the time required for code initialization, x-ray transport for all histories and generating the dose report. The mean of the run durations from all 50 patients in the patient population was used to calculate the speedup achieved over an analogous non-parallelized dose estimation method (Li et al 2011).
3. Results
3.1. Validation of MC-GPU against TG-195 reference datasets
Figure 4 shows the percentage differences between the energy deposited per history in different organs as estimated by the various MC packages (EGSnrc, Geant4, MCNP, Penelope and MC-GPU) and the mean energy deposition value reported by AAPM’s TG-195. For the discrete case, the differences in the estimates for the energy deposited using MC-GPU and the reported mean values were found to range between −0.29% and 1.42% for the 56.4 keV monoenergetic source, and between −0.53% and 4.20% for the 120 kV Bremsstrahlung source across all projection angles and organs except thyroid. For thyroid, the differences were relatively higher compared to other organs, with maximum differences of 9.67% and 7.42% for the 56.4 keV monoenergetic and 120 kV beams respectively.
Figure 4.
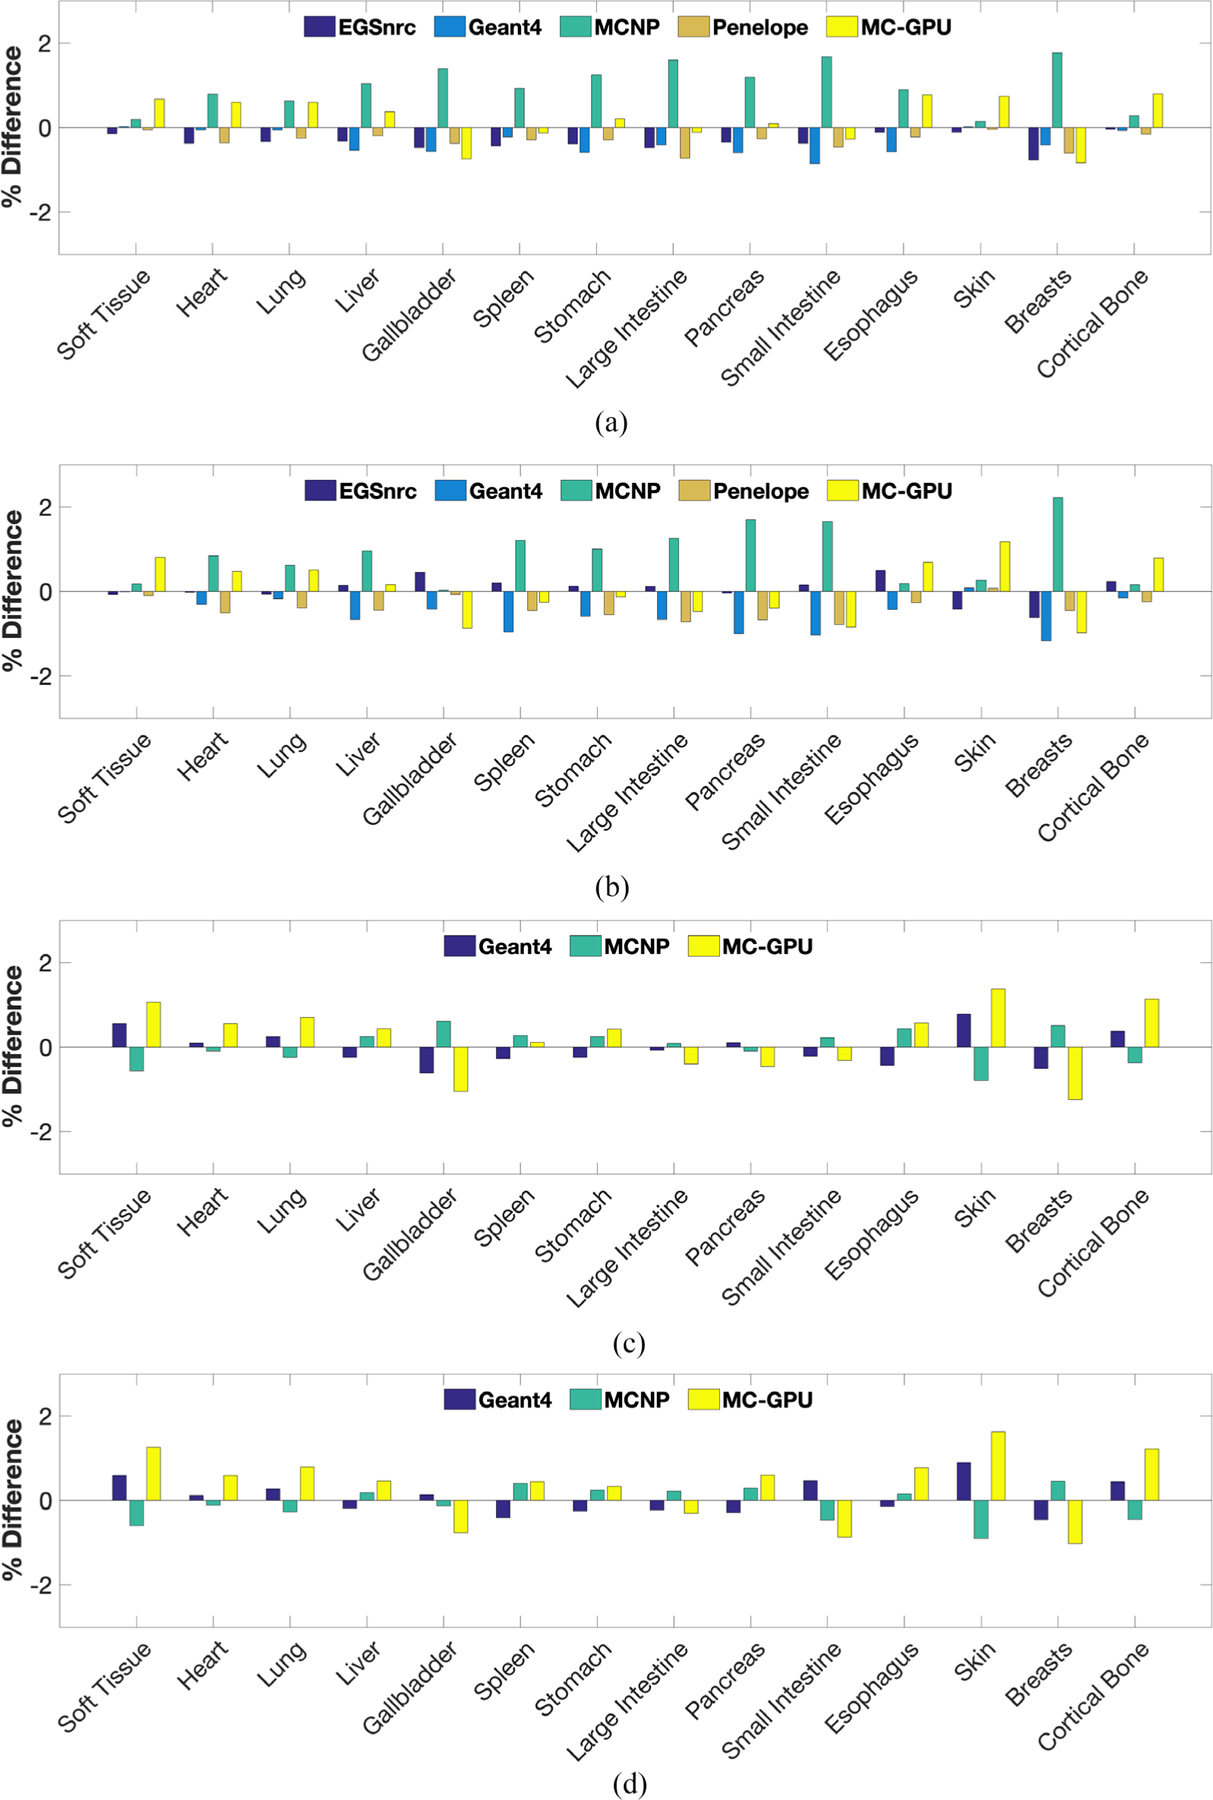
Percentage difference between the energy deposited per photon in different organs as estimated by the various MC packages (EGSnrc, Geant4, MCNP, Penelope and MC-GPU) and the mean energy deposition value as reported by AAPM’s TG-195. The percentage differences for thyroid, thymus and adrenals were excluded from the plot due to space constraints. (a) Source configuration: discrete, 56.4 keV (monoenergetic); projection Angle: 0°. (b) Source configuration: discrete, 120 kV (Bremsstrahlung); projection Angle: 0°. (c) Source configuration: random, 56.4 keV (monoenergetic). (d) Source configuration: random, 120 kV (Bremsstrahlung).
Similarly, for the continuous case involving uniform sampling of photon directions, the differences between the estimates from MC-GPU and the reported values ranged between −1.24% and 3.17%, and −1.06% and 2.14% for the 56.4 keV monoenergetic and 120 kV beam respectively across all organs except thyroid. For thyroid, the differences were observed to be 9.89% and 8.36% for the 56.4 keV monoenergetic and 120 kV beams, respectively.
3.2. Validation against physical dose measurements in anthropomorphic phantoms
OCF values computed at 80 and 120 kV tube voltages for both the adult and the pediatric phantoms were near unity with less than 0.01 standard error in the simulated dose estimates. The measured and simulated doses at all organ locations for the 5 y.o. pediatric and the adult male anthropomorphic phantoms scanned at 80 kV and 120 kV using a CAP protocol are shown in figure 5. As mentioned in section 2.3, the higher measured doses (compared to typical clinical values) are a result of the higher x-ray tube current value and lower pitch used during irradiation for reducing the uncertainty in the TLD measurements. On average, the doses estimated using our tool agreed with the dose measured using TLDs within 10% across all validation cases, however, consistently underestimating the measured doses. Table 2 summarizes the related differences between the measured and simulated dose values (averaged over all starting angles and TLD locations) for the pediatric and adult anthropomorphic phantoms.
Figure 5.
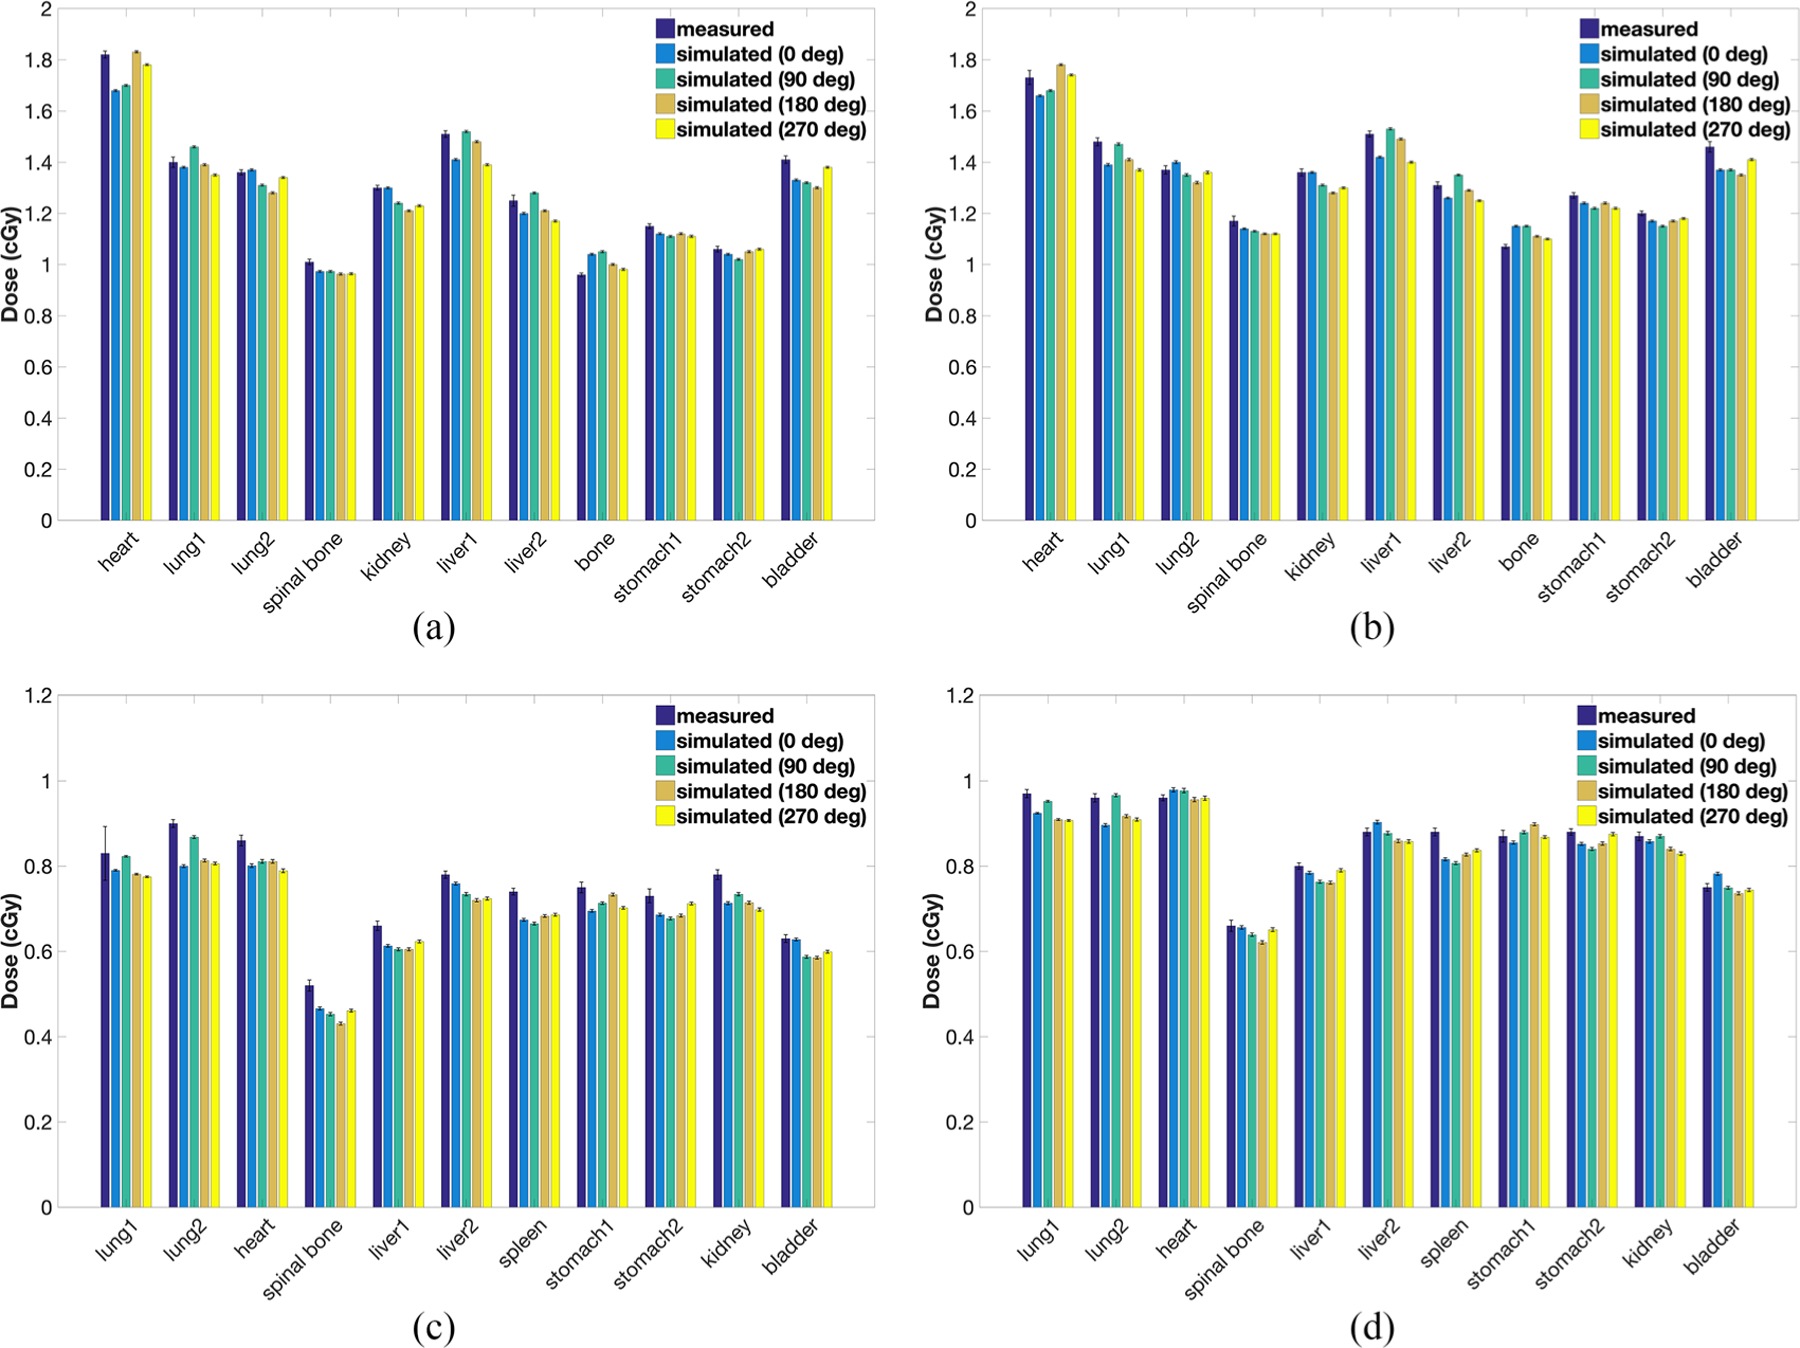
Measured and simulated doses (for all tube starting angles) in selected inserts for a (a) pediatric 5 y.o. phantom scanned at (a) 80 kV and (b) 120 kV, and an adult male phantom scanned at (c) 80 kV and (d) 120 kV using a CAP protocol. The error bars represent the standard error associated with the dose values. The high dose values are a result of the high tube current and low pitch used to reduce the uncertainty in absorbed dose measured by the TLDs. (a) Phantom: pediatric (5 y.o.), tube voltage: 80 kV. (b) Phantom: pediatric (5 y.o.), tube voltage: 120 kV. (c) Phantom: adult, tube voltage: 80 kV. (d) Phantom: adult, tube voltage: 120 kV.
Table 2.
Summary of the differences between the measured and simulated dose values for the pediatric and adult anthropomorphic phantoms at 80 and 120 kV. The average difference represents the difference averaged over all tube starting angles and TLD locations used in this study.
| Pediatric phantom | Adult phantom | |||
|---|---|---|---|---|
| 80 kV | 120 kV | 80 kV | 120 kV | |
| Range | (−5.3%, 6.1%) | (−5.9%, 5.7%) | (−12.5%, −5.0%) | (−6.3%, −0.4%) |
| Average | −2.4% | −2.2% | −7.1% | −2.3% |
3.3. Individualized dosimetry for a select population of patients
The auto-segmentation model worked successfully for all 50 patient datasets used in this study. Figure 6 shows the organ dose estimates for a select population of patients scanned using a clinical CAP protocol. The dose estimates shown in figure 6 were obtained from simulations using the real-time MC tool proposed in this study and a previously validated MC method based on Penelope. The average differences between the dose estimates from these methods were observed to agree within 3% for all organs. Figure 7 summarizes the run durations for simulating each of the patient models in the patient population. On average, the tool requires 23.79 s to simulate a single patient, representing a speedup of ~700 × over existing non-parallelized MC tools. The details of the speedup computation, comparing our tool to an existing CPU-based MC method based on Penelope (Li et al 2011), are summarized in table 3.
Figure 6.
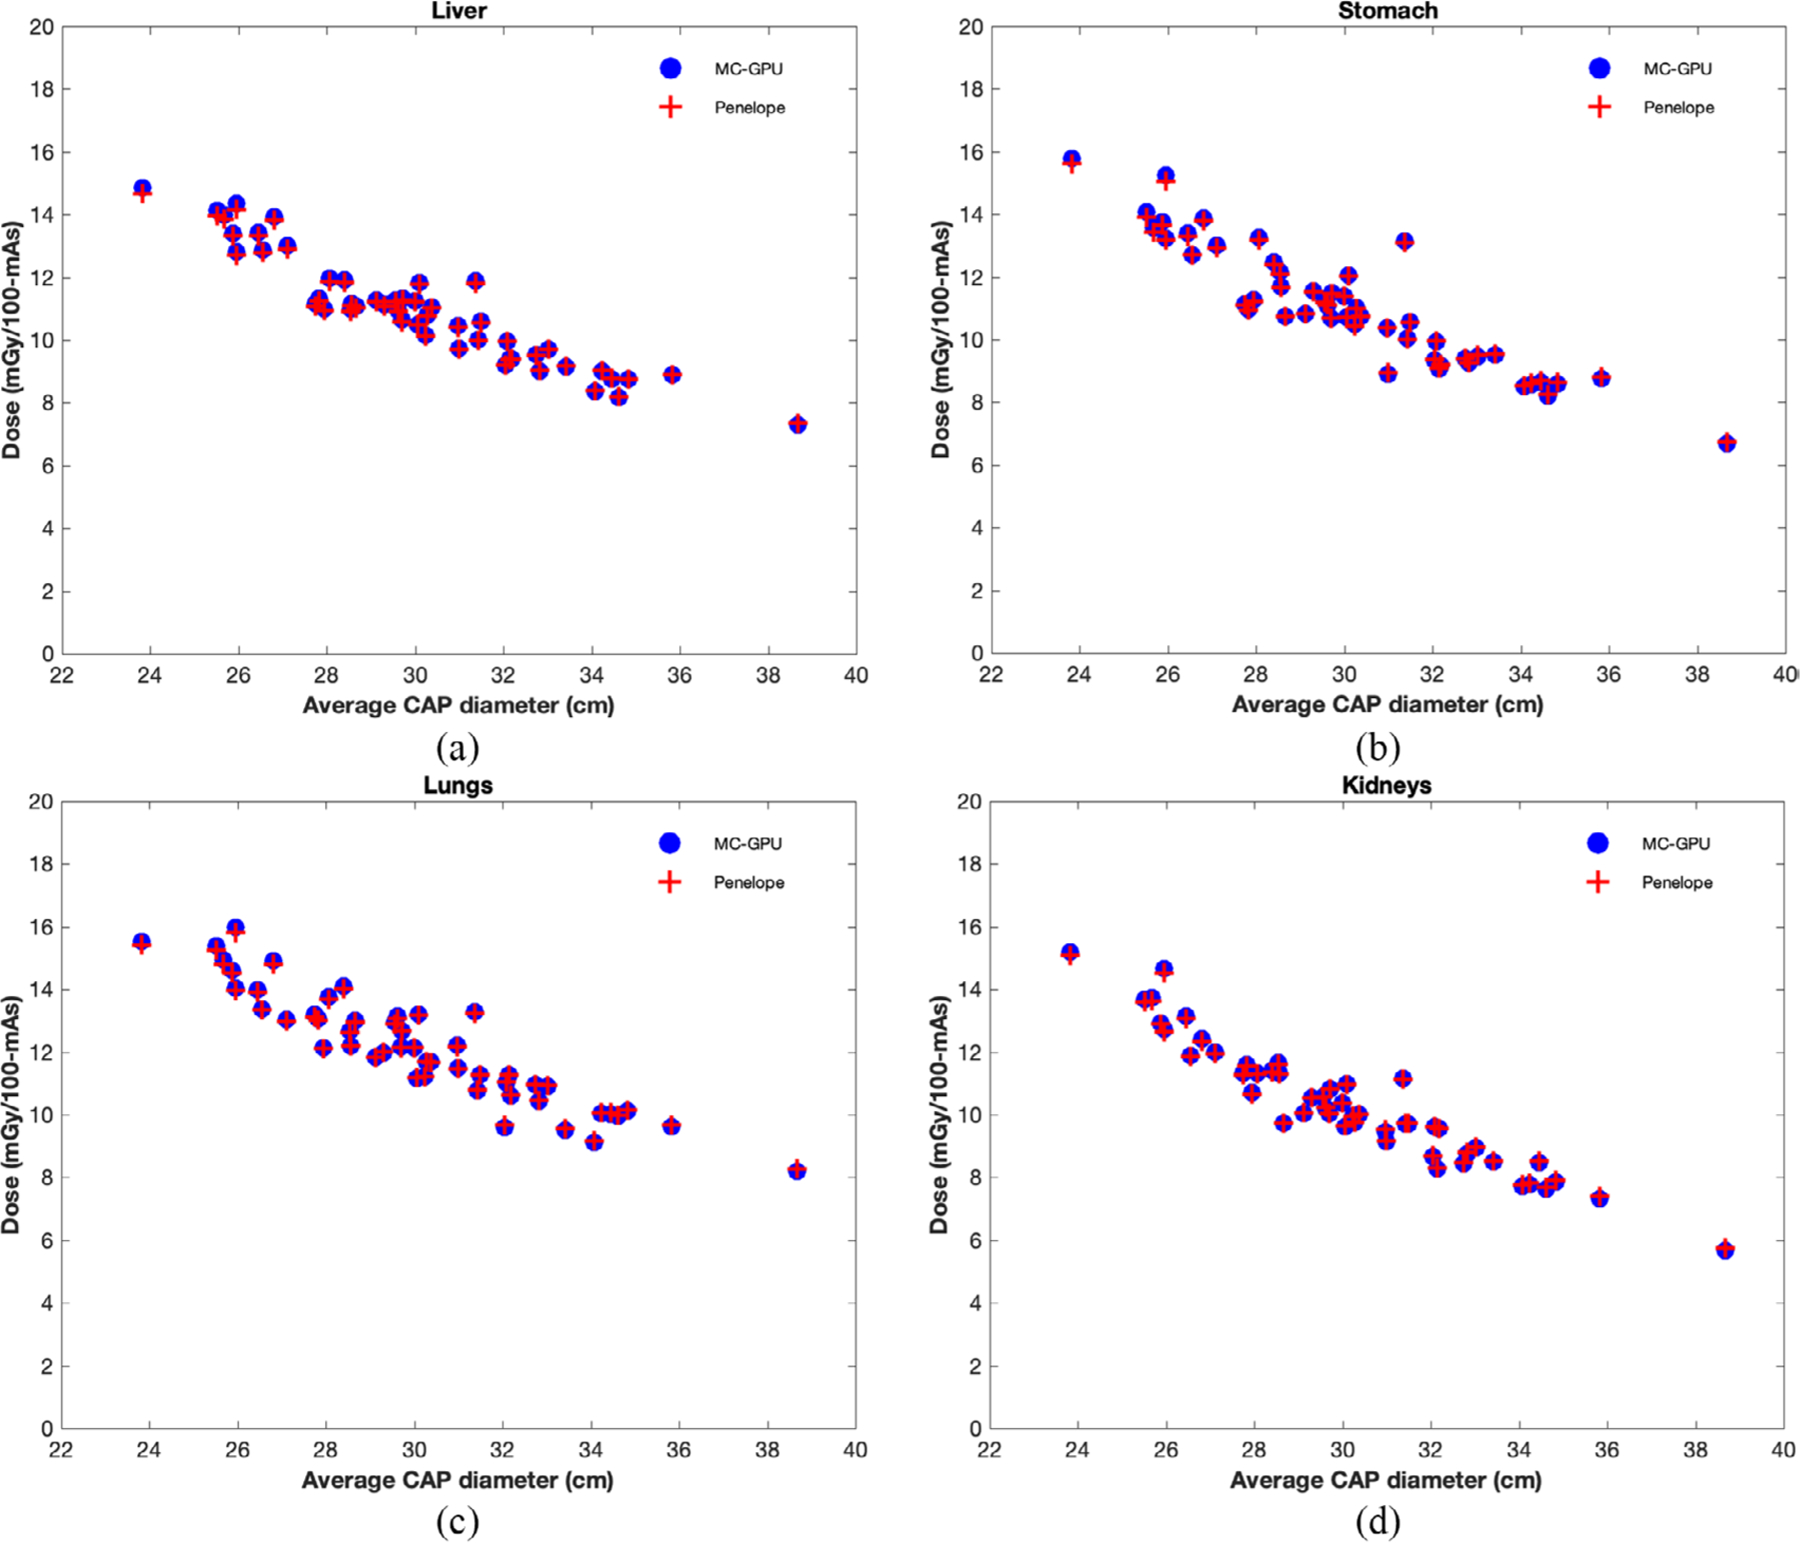
Individualized organ dose estimates (in units of mGy/100 mAs) plotted against average CAP diameter for a select population of 50 adult patient models simulated using a clinical CAP protocol. The dose estimates from the GPU-based MC tool proposed in this study were also compared to estimates from a previously validated tool based on Penelope as an additional validation step.
Figure 7.
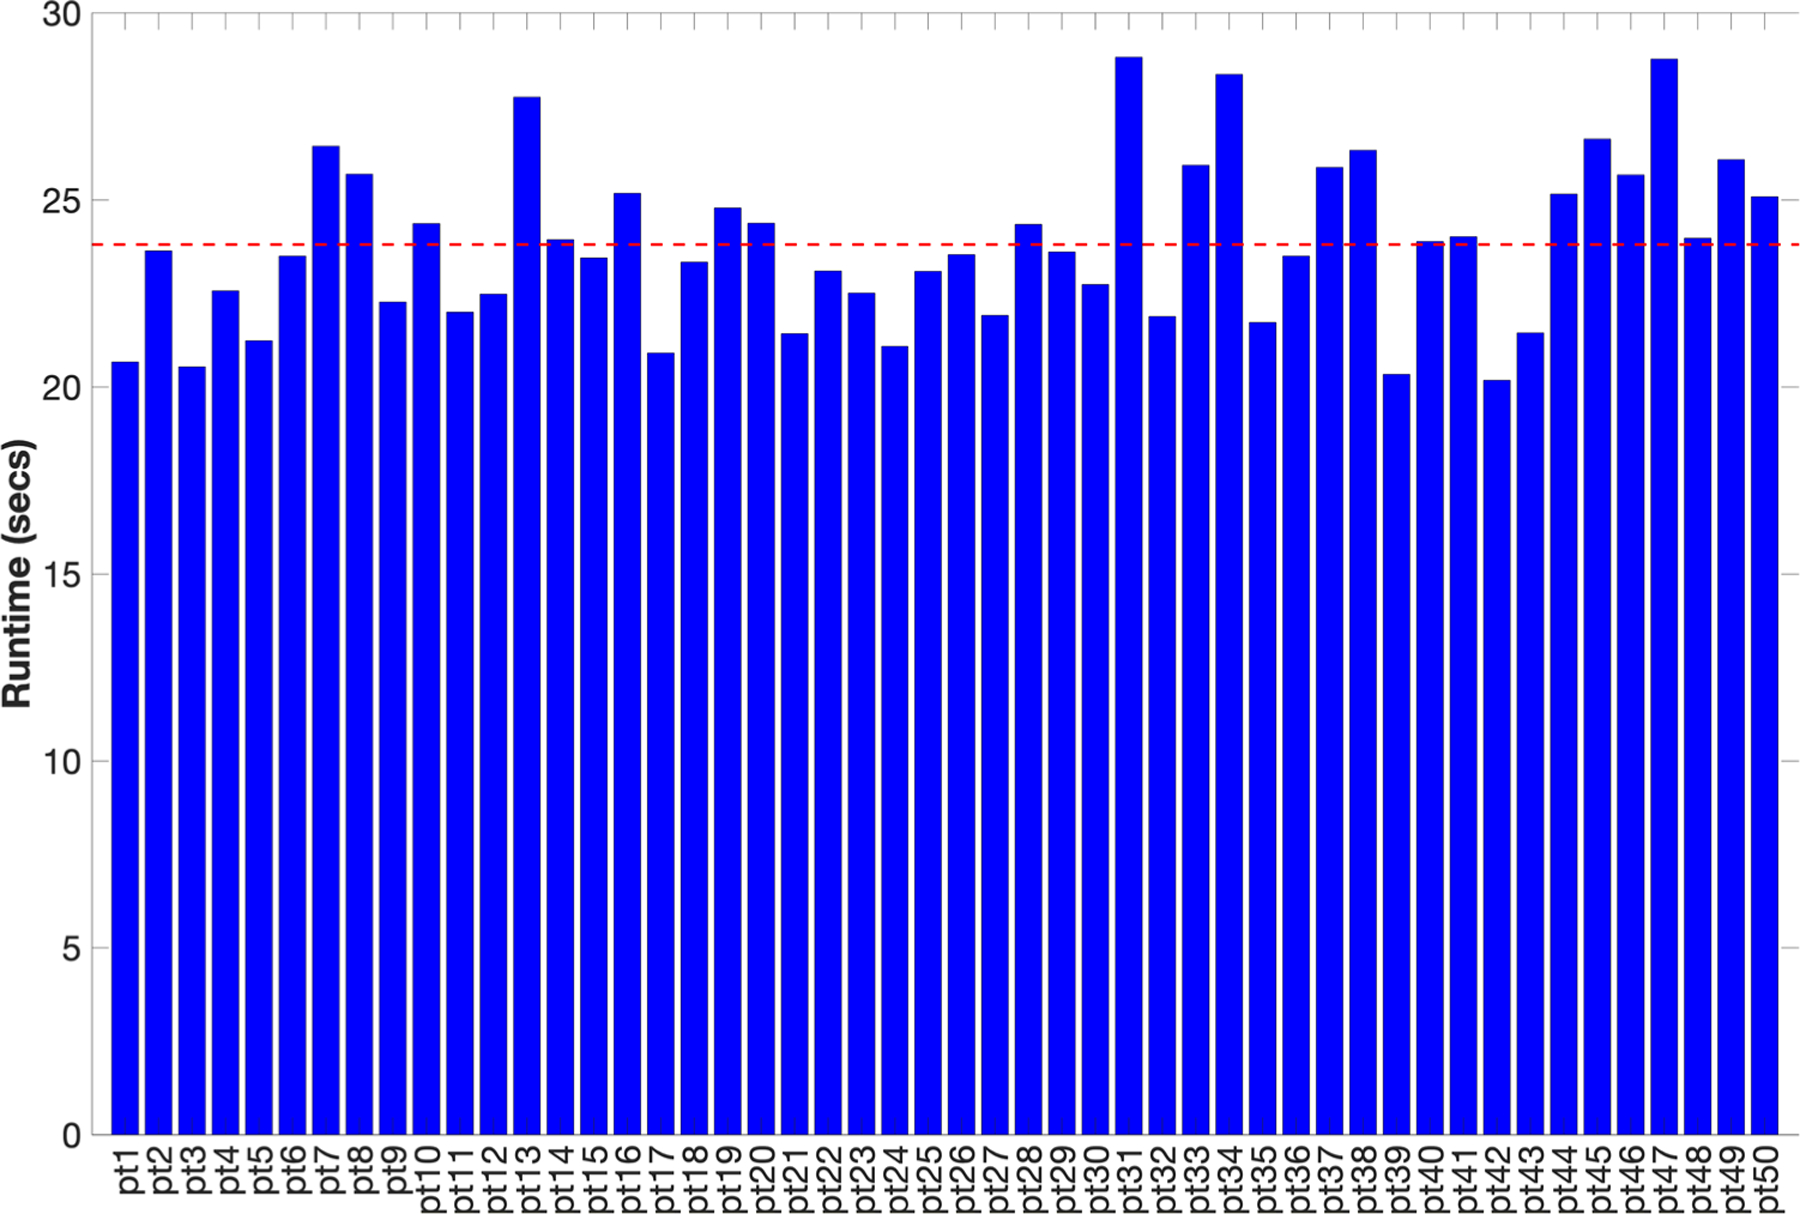
Run durations (in seconds) for simulating a clinical CAP protocol for all 50 patients in the patient population used for this study. The horizontal red line represents the runtime averaged across all patients, which was used for the speedup computation summarized in table 3.
Table 3.
Summary of the computation for calculating the average speedup of the GPU-based MC tool proposed in this study over an existing non-parallelized MC tool based on Penelope.
| Average execution time (s) | Histories simulated | Standard error | |
|---|---|---|---|
| MC-GPU | ~23.8 | ~4.3 × 10⁸ | ≤1% |
| Penelope | ~16 616 | ~4.3 × 10⁸ | ≤1% |
4. Discussion
In this study, we developed a GPU-based MC tool for real-time patient and scanner-specific CT dosimetry in the clinic. To ensure the accuracy of the dose estimates, the method was validated in two ways, first using AAPM’s TG-195 reference datasets and then using TLD measurements in anthropomorphic phantoms acquired on a physical scanner. We also demonstrated the utility of this tool towards providing real-time individualized organ dose estimates by simulating dose for a select population of patients using a clinical protocol.
The validation of the MC-GPU framework using TG-195 reference datasets yielded energy deposition values that are in concordance with values reported using other commonly used MC packages (Geant4, MCNP, EGSnrc and Penelope), with differences within 5% across all organs (except thyroid) and validation cases. The higher inconsistency for thyroid was a result of the size and relative positioning of thyroid relative to the primary irradiation field, where it registered fewer photons leading to higher errors in the estimated energy values. Since the TG-195 does not specify an explicit criterion for considering a MC package validated, we considered agreements within 5% as an acceptable validation threshold for the pre-development stage.
The validation of dose estimates against TLD measurements acquired in anthropomorphic phantoms yielded simulated dose values that were in good agreement with the measured dose values. The simulated dose values agreed with the measured dose values within 10% for all TLD locations and validation cases, with the exception of the spinal bone insert for the adult phantom scanned at 80 kV for which the difference was ~12.5%. Although the difference between the simulated and the measured dose for the spinal bone insert is of the same order of magnitude as the differences for other inserts used in the study, a large relative error (compared to other TLD locations) is observed due to the relatively small value of dose deposited in that insert. We also observed a variation in the simulated dose values as a function of the tube starting angle, an effect which has already been observed for pitches in the range 0.75–1.5 in a different study (Zhang et al 2009), which adds to the uncertainty of the simulated dose values. The simulated dose values are also affected by the errors in the OCF used to calibrate the magnitudes of the proprietary photons per mAs values, where the unaccounted uncertainties (such as in CTDIvol,console) could lead to underestimation of uncertainty in the simulated dose values. Given the complexity of the measurement and the uncertainties in the various inputs to the simulation (which includes uncertainties in the x-ray spectrum, bowtie profile and material properties of the phantom), an agreement within 10% of the measured data is considered a good match for validation (Deak et al 2008).
To gauge the capability of the proposed GPU-based MC tool for providing individualized dose estimates, a select population of 50 adult patients was automatically segmented and simulated for estimating organ doses. The dose values agreed with estimates from a previously validated MC method (based on Penelope) within 3% for all organs, providing additional evidence for the accuracy of dose estimates obtained using our tool. In addition, the average run duration of 23.79 s represents a significant speedup (~700×) over existing non-parallelized MC methods, making it an eligible candidate for time-constrained applications in the clinic. Combined with automated image segmentation approaches (similar to the one used in this study) to generate patient-specific anatomical models, the proposed tool facilitates a feasible framework for real-time individualized dosimetry in the clinic, providing a significant improvement over existing approximation-based methods for dose quantification.
This study has some limitations. First, the post-bowtie spectrum model used in the tool does not account for the anode heel effect, which leads to non-uniformities in the irradiation field along the direction of the cone angle. Since the absorbed dose is sensitive to variations in the irradiation field, ignoring the anode heel effect could lead to inaccuracies in the estimates for absorbed dose. Second, the TCM functionality in our tool relies on the modulation profiles generated using the model by Li et al (2014), which may not fully represent the modulation schemes used by different scanners in the clinic, potentially leading to additional inaccuracies in the estimates of absorbed dose. Our method, however, can use the actual mA profile that may be provided by the scanner. Third, the current version of the tool exclusively tallies kerma in each voxel for estimating absorbed dose without accounting for any secondary electron transport, making it unsuitable for microdosimetric applications. A microdosimetric treatment is especially important for estimating absorbed doses in the presence of contrast material (Boone and Hernandez 2017), which is administered to enhance image contrast for a majority of the scans conducted in the clinic (Sahbaee et al 2017).
In addition to real-time dosimetry in the clinic, the developed MC tool can also be integrated with an imaging platform (Abadi et al 2018) to conduct virtual clinical trials for task-based optimization of image quality versus dose in CT. Since conducting a virtual clinical trial usually requires simulating an exhaustive population of patient models using multiple protocols on different scanners, using a rapid MC method that is patient- and scanner-specific (similar to the one developed in this study) would provide a significant improvement in terms of realism and efficiency. Although beyond the scope of this study, the proposed methods could be easily extended to model a variety of other x-ray-based imaging modalities such as radiography, tomosynthesis, fluoroscopy and mammography, enabling a comprehensive framework for dose quantification in the clinic.
5. Conclusion
In this study, we successfully developed a GPU-based real-time MC tool for patient- and scanner-specific dosimetry in the clinic, which was validated in two ways using MC reference datasets and physical dose measurements in anthropomorphic phantoms. By estimating patient-specific organ doses for a select population of 50 adult patients covering a wide range of patient anatomy, age, and sex, we demonstrated the capability of this tool for providing accurate individualized organ dose estimates in clinical scenarios. The significantly reduced run durations for our tool represent a notable speedup over existing non-parallelized MC methods, thus making it an ideal candidate for time-constrained dosimetry requirements of the clinic.
Acknowledgments
The authors are grateful to Cliff Hammer at the University of Wisconsin Medical Radiation Research Center (UWMRRC), whose technical assistance was crucial for acquiring and interpreting the TLD measurements acquired for validation purposes. The authors are also grateful to Terry Yoshizumi and Giao Nguyen of the Radiation Safety Division at Duke University for lending the ATOM anthropomorphic phantoms used in this study, and to Juan Carlos Ramirez-Giraldo of Siemens Healthineers for helping with the scans. The authors also recognize the invaluable contribution of Jocelyn Hoye and Francesco Ria of Carl E Ravin Advanced Imaging Laboratories at Duke University for facilitating the research conducted in this study. The research reported in this document was supported by the National Institutes of Health under award number R01EB001838. We also gratefully acknowledge the support of NVIDIA Corporation with the donation of the GeForce GTX Titan X GPU used for conducting simulations discussed in this study.
References
- Abadi E, Harrawood B, Sharma S, Kapadia A, Segars W P and Samei E 2018. DukeSim: a realistic, rapid, and scanner-specific simulation framework in computed tomography IEEE Trans. Med. Imaging 38 1457–65 [DOI] [PMC free article] [PubMed] [Google Scholar]
- Badal A and Badano A 2009. Accelerating Monte Carlo simulations of photon transport in a voxelized geometry using a massively parallel graphics processing unit Med. Phys 36 4878–80 [DOI] [PubMed] [Google Scholar]
- Boone J M and Hernandez A M 2017. The effect of iodine-based contrast material on radiation dose at CT: it’s complicated Radiology 283 624–7 [DOI] [PMC free article] [PubMed] [Google Scholar]
- Brink J A and Morin R L 2012. Size-specific dose estimation for CT: how should it be used and what does it mean? Radiology 265 666–8 [DOI] [PubMed] [Google Scholar]
- Chen W, Kolditz D, Beister M, Bohle R and Kalender W A 2012. Fast on-site Monte Carlo tool for dose calculations in CT applications Med. Phys 39 2985–96 [DOI] [PubMed] [Google Scholar]
- Costello J E, Cecava N D, Tucker J E and Bau J L 2013. CT radiation dose: current controversies and dose reduction strategies Am. J. Roentgenol 201 1283–90 [DOI] [PubMed] [Google Scholar]
- Deak P, van Straten M, Shrimpton P C, Zankl M and Kalender W A 2008. Validation of a Monte Carlo tool for patient-specific dose simulations in multi-slice computed tomography Eur Radiol. 18 759–72 [DOI] [PubMed] [Google Scholar]
- Fu W, Segars W P, Abadi E, Sharma S, Kapadia A J and Samei E 2018. From patient-informed to patient-specific organ dose estimation in clinical computed tomography Proc. SPIE 10573 1057315 [Google Scholar]
- Gupta S 2015. Calculation of the range of electrons for parts of human body over the energy range of 30–1000 keV Int. J. Eng. Technol. Manag. Appl. Sci 3(Special Issue) 298–302 [Google Scholar]
- Hall E J and Brenner D J 2012. Cancer risks from diagnostic radiology: the impact of new epidemiological data Br. J. Radiol 85 e1316–7 [DOI] [PMC free article] [PubMed] [Google Scholar]
- International Electrotechnical Commission 2009. Medical Electrical Equipment - Part 2–44: Particular Requirements for the Basic Safety and Essential Performance of X-Ray Equipment for Computed Tomography (Geneva: International Electrotechnical Commission; ) www.iec.ch (Accessed: 4 October 2018) [Google Scholar]
- Li X et al. 2011. Patient-specific radiation dose and cancer risk estimation in CT: part I. Development and validation of a Monte Carlo program Med. Phys 38 397–407 [DOI] [PMC free article] [PubMed] [Google Scholar]
- Li X et al. 2012. Effects of protocol and obesity on dose conversion factors in adult body CT Med. Phys 39 6550–71 [DOI] [PMC free article] [PubMed] [Google Scholar]
- Li X, Segars W P and Samei E 2014. The impact on CT dose of the variability in tube current modulation technology: a theoretical investigation Phys. Med. Biol 59 4525. [DOI] [PMC free article] [PubMed] [Google Scholar]
- McCollough C et al. 2008. The Measurement, Reporting, and Management of Radiation Dose in CT (American Association of Physicists in Medicine: College Park, MD: ) www.aapm.org/pubs/reports/RPT_96.pdf (Accessed: 29 July 2019) [Google Scholar]
- McCollough C H et al. 2012. Achieving routine submillisievert CT scanning: report from the summit on management of radiation dose in CT Radiology 264 567–80 [DOI] [PMC free article] [PubMed] [Google Scholar]
- Morato S, Garcia C, Juste B, Miro R and Verdu G 2017. Dose calculation in computerized tomography 2017 39th Annual Int. Conf. of the IEEE Engineering in Medicine and Biology Society (IEEE) pp 560–3 [DOI] [PubMed] [Google Scholar]
- Nunn AA, Davis SD, Micka JA and DeWerd LA 2008. LiF:Mg,Ti TLD response as a function of photon energy for moderately filtered x-ray spectra in the range of 20–250 kVp relative to C60 Med. Phys 35 1859–69 [DOI] [PubMed] [Google Scholar]
- Sahbaee P, Segars WP, Marin D, Nelson R C and Samei E 2017. The effect of contrast material on radiation dose at CT: part I. Incorporation of contrast material dynamics in anthropomorphic phantoms Radiology 283 739–48 [DOI] [PMC free article] [PubMed] [Google Scholar]
- Sechopoulos I et al. 2015. Monte Carlo reference data sets for imaging research: Executive summary of the report of AAPM Research Committee Task Group 195 Med. Phys 42 5679–91 [DOI] [PubMed] [Google Scholar]
- Segars W P, Sturgeon G, Mendonca S, Grimes J and Tsui BMW 2010. 4D XCAT phantom for multimodality imaging research Med. Phys 37 4902–15 [DOI] [PMC free article] [PubMed] [Google Scholar]
- Segars W P. et al. Population of anatomically variable 4D XCAT adult phantoms for imaging research and optimization. Med. Phys. 2013;40:043701. doi: 10.1118/1.4794178. [DOI] [PMC free article] [PubMed] [Google Scholar]
- Tian X, Li X, Segars WP, Frush DP, Paulson EK and Samei E 2013. Dose coefficients in pediatric and adult abdominopelvic CT based on 100 patient models Phys. Med. Biol 58 8755–68 [DOI] [PubMed] [Google Scholar]
- Tian X, Segars WP, Dixon RL and Samei E 2016. Convolution-based estimation of organ dose in tube current modulated CT Phys. Med. Biol 61 3935. [DOI] [PMC free article] [PubMed] [Google Scholar]
- Turner A C et al. 2010. The feasibility of a scanner-independent technique to estimate organ dose from MDCT scans: using CTDIvol to account for differences between scanners Med. Phys 37 1816–25 [DOI] [PMC free article] [PubMed] [Google Scholar]
- Zhang D et al. 2009. Reducing radiation dose to selected organs by selecting the tube start angle in MDCT helical scans: a Monte Carlo based study Med Phys. 36 5654–64 [DOI] [PMC free article] [PubMed] [Google Scholar]


