

Abstract
Background
Child malnutrition accounted by poor dietary diversity is common in developing countries contributing for child morbidity and mortality. It also has an impact on child growth and development. Almost all nutritional related problems are preventable by implementing infant and child feeding strategies. The first two years of life are particularly important to reverse the nutritional problems by achieving dietary diversity feeding.
The study aimed to assess dietary diversity and its associated factors among 6–23 months old children in Sinan Woreda, Northwest Ethiopia.
Methods
We conducted community based cross-sectional study among children aged 6–23 months in Sinan Woreda from February 16 to March 10, 2016. Random sampling technique was used to select 740 samples. Data on children’s dietary diversity of the last 24 h were collected through interview of mothers. Data were entered into EpiData version 3.1 and analysis was performed using SPSS version 20. The bivariate and multivariable logistic regression analyses were done to identify the independent factors associated with sub-optimal dietary diversity among children aged 6–23 months.
Results
Seven hundred thirty six samples were included in the analysis with the response rate of 99%. Optimum dietary diversity was observed in 13% children. The dominant food groups consumed were grains. Availability of media sources at household [Adjusted Odds Ratio (AOR) = 2.77 (1.65–4.68)], availability of cow milk in the household [AOR = 2.39 (1.31–4.35)], women’s involvement in decision-making at household level [AOR = 2.07 (1.02–4.20)], institutional delivery service utilization [AOR = 2.40 (1.24–4.67)], receiving assisted delivery service [AOR = 2.36 (1.12–4.98)], receiving postnatal care [AOR = 2.07 (1.18–3.63)], distance far from the health center [AOR = 3.11 (1.66–5.83)] and meal frequency being four and above [AOR = 3.31 (1.53–7.18)] were associated with dietary diversity.
Conclusion
This study concluded that optimum dietary diversity among children aged 6–23 months in Sinan Woreda is low. Meal frequency is positively associated with dietary diversity. Women involvement at household decision making improves dietary diversity of children. Ensuring maternal health service utilization can contribute for better dietary diversity of children aged 6–23 months. Large scale an interventional based research has to be conducted.
Keywords: Children aged 6–23 months, Dietary diversity, Sinan Woreda
Background
Globally, malnutrition affects social and economic development of a country. It is one of the commonest causes of under-five mortality, accounting for 45% of the 5.9 million deaths of under-five children in 2015 [1]. Those who survived from chronic malnutrition were suffering from wasting, irreversible physical and mental development [2–7]. Infant and young child feeding is a key area to improve child survival and promote healthy growth and development. The first two years of a child’s life are particularly important, as optimal nutrition during this period lowers morbidity and mortality, reduces the risk of chronic disease, and fosters better development overall [3].
The Sustainable Development Goals (SDGs) aimed to ensure healthy lives and promote well-being for all children. The SDG 3 target 3.2 aimed to end preventable deaths of newborns and under five year children by 2030 [8]. United Nations has emphasized that implementations to achieve the SDGs should acknowledge the nutrition priorities in which all of the SDGs have relations with nutrition. Improvements in human nutrition represent both a maker and a marker of sustainable development [9].
Improvement in human nutrition can be achieved through dietary diversity. Dietary diversity scores of the individuals reflect nutrient adequacy. Hence, nutrient adequacy of the diet consumed by the individuals depends on the individual dietary diversity score [10, 11]. World Health Organization (WHO) has designed a diet quality indicator to assess child feeding practices among children 6–23 months old. Diversified diet helps children to have appropriate nutrients needed for adequate growth and development [12, 13].
World health organization recommends children to consume foods among the seven food groups [(1). Grains, roots and tubers; (2). Legumes and nuts; (3). Dairy products; (4). Flesh foods (meats/fish/poultry); (5). Eggs; (6). Vitamin A-rich fruits and vegetables; and (7). Other fruits and vegetables] [14]. Infant and Young child feeding (IYCF) practices recommend that breastfed children aged 6–23 months must fed four or more other food groups daily. Non-breastfed children should feed milk or milk products, in addition to four or more food groups [15]. Despite of the importance of diversified food for children aged 6–23 months, only less than a fourth of them globally get diversified food and had recommended meal frequency that are appropriate for their age [3].
Only 4% of breastfed children in Ethiopia have received diversified diet [15]. In Southwest Ethiopia, about 39% of the children were categorized in the low Dietary Diversity Score [16]. The national prevalence of under-five stunting in Ethiopia is 44% and it is 52% in Amhara [15].
Globally, studies show that different socio-demographic and economic characteristics of mothers/care takers and children are associated with dietary diversity for children aged less than two years [14, 17–24]. Place of residence, age of the child, maternal education, birth order, wealth index and number of children less than five years old in the household were some of the factors which determine minimum dietary diversity [11, 25].
The ministry of health of Ethiopia has targeted to improve nutritional practices for children of 6–23 months age. The first 23 months are critical period of opportunity for health and development of children. However, there is still low dietary diversity practice in children age 6–23 months according to 2011 Ethiopian Demographic and Health Survey (EDHS) report [15, 26]. There are no documented studies on the dietary diversity feeding and its associated factors among children aged 6–23 months in Sinan Woreda. This study aimed to identify the magnitude of low dietary diversity among children aged 6–23 months and associated factors.
Methods
Study design and setting
Community based cross-sectional study was conducted in Sinan Woreda, East Gojjam Zone from February 16 to March 10, 2016. Sinan Woreda is located at 327 km from Addis Ababa in Northwest and 303 km from Bahir Dar in Southeast. The estimated population of the Woreda in 2015/16 is about 114,475. The estimated number of the under-five year children is 15,499. The total number of children aged 6–23 months account 4315 (Sinan worea health office: Health sector woreda base strategic plan report of sinan woreda, unpublished). Quantitative data were collected from mothers.
We obtained ethical clearance from the Ethical review committee of College of Health Sciences of Debre Markos University. Verbal informed consent, which was prepared in written form and dictated to the respondents during data collection, was obtained from the study participants after explaining the purpose of the study and the benefits. Respondents were interviewed voluntarily, anonymously and confidentiality also was assured. All participants were allowed to ask questions throughout data collection and could refuse to answer questions or stop the interview at any moment.
Sample size determination and sampling procedure
Sample size was determined using single population proportion formula. [27], where, p represents the proportion of children who took the optimum dietary diversity, which was 12.6% taken from the study done in Ethiopia [28]. To get the optimum sample size, 3% margin of error (d) was considered with 95% confidence interval.
We added 5% for non-response rate and multiplied by 1.5 because of design effect. Then the final sample size was 740.
Of the 17 administrative Kebeles in the Woreda, seven were selected randomly for the study. Proportional to population size allocation was done to select the desired samples from each selected Kebele. Sampling frame, based on community-based health information system of family folder in health posts, was constructed. Lists of all mothers having children age 6–23 months with Community Health Information System (CHIS) number in selected kebeles were used to select the respondents through computer generated methods of random sampling. Children aged 6–23 months who did not start complementary food were excluded from this study.
Data collection procedure and measurements
Questionnaires were composed of dietary diversity score adapted from the World health organization IYCF guideline which contains seven food groups for young child (6 to 23 months old) dietary diversity (Grains, roots and tubers; Legumes and nuts; Dairy products (milk, yogurt, and cheese); Flesh foods (meat, fish, poultry and liver/organ meats); Eggs; vitamin-A rich fruits and vegetables; Other fruits and vegetables) [7] and maternal and child demographic characteristics adapted from EDHS 2011 [15]. Questionnaires were first prepared in English and translated into Amharic Version, which later on, were translated into English. Amharic version questionnaires were used to collect data. Pre-test was done on 5% of the sample, two weeks before the actual data collection at Machakel Woreda. Data on dietary diversity were collected through face to face interviewing of mothers having children aged 6–23 months by allowing them freely to recall the type of food items they feed to their child/children within the last 24 h. Twelve data collectors, recruited based on their previous experience, and two supervisors had participated in data collection process. One day training on questionnaires and methods of data collection procedures was provided to data collectors and supervisors. Supervisors had checked completeness and consistency of the collected data by reviewing each completed questionnaire daily.
The dependent variable is Dietary diversity (dichotomized as optimal /suboptimal). Independent variables include socioeconomic and demographic characteristics (like age, educational status, occupation etc.), health utilization, and child health characteristics.
Operational definition
Optimal dietary diversity: Dietary diversity was defined as optimal if children (aged 6–23 months) received foods from at least four of seven food groups [(1) Grains, roots, and tubers, (2) Legumes and nuts, (3) Dairy products, (4) Flesh foods, (5) Eggs, (6) Vitamin-A rich fruits and vegetables, (7) Other fruits and vegetables, within the preceding 24 h of interview.
Sub-optimal dietary diversity: was defined as receiving three foods or fewer within 24 h [7, 29].
The terms ‘Women and mothers’ are used interchangeably in this study.
Statistical analysis
Data were entered into EpiData version 3.1 with double entry verification. Analysis was performed using SPSS version 20.0. Frequency and cross-tabulation were used to present descriptive data. Both the bivariate and multivariable logistic regression analyses were performed to assess the association between dependent and independent variables. Independent variables that showed P < 0.2 at 95% CI in the bivariate logistic regression analysis were included in multivariable logistic regression model. P < 0.05, with 95% CI, was considered to declare the variables significantly associated with the dependent variable.
Results
Of the total 740 sampled mothers/care takers who had children 6–23 months, 736 of them participated in the study with the response rate of 99%.
Socio-demographic characteristics of mothers
The mean (±SD) age of the mothers was 30 (±5.69) years. Majority (58%) were in the age group of 25–34 years. All of them belong to Orthodox Tewahido Christian in their religion and Amhara in their Ethnicity. More than 95% of them were married. More than three-fourth (78%) of them were unable to read and write. Majority (75%) of them were farmers. More than 92% of them were from male headed households and 82% mothers had involved in decision-making activities (Table 1).
Table 1.
Socio-demographic and economic characteristics of mothers having child aged 6–23 months in Sinan Woreda, Northwest Ethiopia, 2016 (N = 736)
| Variables | Frequency | ||
|---|---|---|---|
| N | % | ||
| Maternal education level | Unable to read and write | 572 | 78 |
| Read and write only | 92 | 13 | |
| Primary school (1–8 grade) | 22 | 3 | |
| Secondary school (9–12 grade) | 33 | 4 | |
| Higher education | 17 | 2 | |
| Father’s education | Unable to read and write | 382 | 52 |
| Read and write only | 239 | 32 | |
| Primary school (1–8 grade) | 54 | 7 | |
| Secondary school(9-12grade) | 41 | 6 | |
| Higher education | 20 | 3 | |
| Maternal Occupation | Housewife | 102 | 14 |
| Government employed | 20 | 3 | |
| Merchant | 54 | 7 | |
| Farmer | 549 | 75 | |
| Others | 11 | 1 | |
| Fathers’ occupation | Farmer | 558 | 76 |
| Government employed | 39 | 5 | |
| Private employed | 10 | 1 | |
| Merchant | 75 | 10 | |
| Daily laborer | 26 | 4 | |
| Others | 28 | 4 | |
| Household family size | < 4 | 190 | 26 |
| > = 4 | 546 | 74 | |
| Number of < 5 years children | 1 | 611 | 83 |
| > = 2 | 125 | 17 | |
| Availability of Media sourcesa at the households | Yes | 155 | 21 |
| Exposure to available media sources | Yes | 139 | 90 |
| Available farmland | Yes | 562 | 76 |
| Cultivating vegetables | Yes | 194 | 26 |
| Available livestock | Yes | 579 | 79 |
| Having cow milk and feed the child | Yes | 98 | 13 |
| Mother involved in decision-making | Yes | 604 | 82 |
aIncludes Radio and Television (TV)
Characteristics of the children aged 6–23 months
The mean (±SD) age of the children was 14.21(±5.3) months. About half (52%) of them were male. Majority (75%) of them were second and above child for the interviewed mothers. Seventy two (10%) of them had experience of morbidity within the preceding two weeks. About 66% of them had received growth-monitoring service and 75% of them received measles vaccine (Table 2).
Table 2.
Selected health related characteristics children aged 6–23 months in Sinan Woreda, Northwest Ethiopia, 2016 (N = 736)
| Variables | Frequency | ||
|---|---|---|---|
| N | % | ||
| Child’s age in months | 6–11 | 297 | 40 |
| 12–17 | 215 | 29 | |
| 18–23 | 224 | 30 | |
| Birth order | First | 182 | 25 |
| Second to fourth | 385 | 52 | |
| Fifth and above | 169 | 23 | |
| Morbidity for the last two weeks | Yes | 72 | 10 |
| Type of morbidity | Diarrhea | 24 | 33 |
| Fever | 15 | 21 | |
| Cough | 24 | 33 | |
| Others | 9 | 13 | |
| BCG Vaccinated | Yes | 723 | 98 |
| Pentavalent1 vaccinated | Yes | 724 | 98 |
| Pentavalent3 vaccinated | Yes | 710 | 96 |
| Measles vaccinated | Yes | 555 | 75 |
| Growth monitoring practice follow up | Yes | 489 | 66 |
BCG Bacillus Calmette-Guérin, Pentavalent A vaccine against Diphtheria, Pertusis, Tetanus, Hepatitis B and Haemophilus influenza type B
Health utilization, feeding practice and behavioral characteristics of mothers
More than three-fourth (78%) of mothers were multigravida. Majority (85%) of them have used family planning before the last pregnancy and 90% of them had Antenatal Care (ANC) follow up during the last pregnancy. More than half (54%) of them gave birth to their last child at health institution. Health professionals assisted 53.3% deliveries. Three hundred forty (46%) mothers have received Postnatal care (PNC) following their last childbirth. Six hundred twenty five (85%) of them have received breast-feeding counseling. Majority (92%) of them knew when to start complementary feeding (CF) and 63% of them have initiated complementary feeding timely. Majority (98%) of them reported feeding breast milk to their children. More than one-third (40%) of them reported feeding their child three times per day (Table 3).
Table 3.
Health service utilization, information on child feeding and feeding practice of mothers in Sinan Woreda, Northwest Ethiopia, 2016 (n = 736)
| Variables | Frequency | ||
|---|---|---|---|
| N | % | ||
| Gravidity | Primigravida | 165 | 22 |
| Multigravida | 571 | 78 | |
| ANC follow up for the index child | Yes | 661 | 90 |
| Place of delivery | Home | 310 | 42 |
| Health posts | 30 | 4 | |
| Health institutions | 396 | 54 | |
| Mode of delivery | Spontaneous vaginal delivery | 693 | 94 |
| Assisted deliveries | 43 | 6 | |
| PNC follow up for the index child | Yes | 340 | 46 |
| Utilizations of Family planning before current pregnancy | Yes | 627 | 85 |
| Counseled on BF | Yes | 625 | 85 |
| Time to reach nearby health center | Less than 2 h | 641 | 87 |
| 2 h and above | 95 | 13 | |
| Knew when to start CF | Yes | 679 | 92 |
| Initiation of CF | Timely initiate CF | 463 | 63 |
| Not timely initiate CF | 273 | 37 | |
| Currently breast feed | Yes | 721 | 98 |
| Source of information of CF | Health professionals | 171 | 23 |
| family members | 141 | 19 | |
| HEWs | 424 | 58 | |
| Meal frequency of children | 1-2times/day | 165 | 22 |
| Three | 295 | 40 | |
| Four and above | 276 | 38 | |
| Feeding material | Feed by cup or spoon | 459 | 62 |
| Active feeding | 205 | 28 | |
| Bottle feeding | 25 | 3 | |
| Othersa | 47 | 6 | |
| Consistency of the CF | Gruel | 176 | 24 |
| Slightly dense porridge | 192 | 26 | |
| Dense porridge | 34 | 5 | |
| Usual household food | 313 | 43 | |
| Othersb | 21 | 3 | |
afeeding by caretakers hands
blocally made bread, tea
Dietary diversity and type of diversified food items
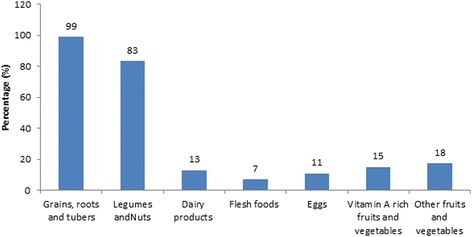
Children who fed four or more food items within 24 h preceding data collection were 13%. Of children included in the study, 74(10%), 379(52%) and 189(26%) consumed from one, two and three food items were respectively. The mean (±SD) dietary diversity score (DDS) was 2.45(±0.95). The dominant food groups consumed were grains (99%) followed by legumes (83%) (Fig. 1).
Fig. 1.
Types of dietary groups given to children aged 6–23 months in Sinan Woreda, Northwest Ethiopia, 2016
Factors associated with dietary diversity among children aged 6–23 months
In multivariable logistic regression analysis, those mothers who had available media at the household level were 2.77 times more likely to feed their children with optimum dietary diversity compared to those who had no media sources. Those who had milk available at household were 2.38 times more likely to feed their children with optimum dietary diversity. Women who have been involved in decision-making were 2.07 times more likely to feed their children with optimum dietary diversity. Feeding with optimum dietary diversity to their children was 2.40 times more among mothers who have delivered their last child at health institution and, mothers who gave their last childbirth with assisted mode of delivery were 2.36 times more likely to feed their children with optimum dietary diversity. Women who have received PNC following their last child birth were 2.07 times more likely to feed their children with optimum dietary diversity. Mothers’ who went to health center for two hours and above, were 3.11 times more likely to feed their children with optimum dietary diversity. Women who fed their children four times and more per day were about three times more likely to feed their children with optimum dietary diversity (Table 4).
Table 4.
The bivariate and multivariable logistic regression analysis showing factors associated with dietary diversity among children aged 6–23 months in Sinan Woreda, Northwest Ethiopia
| Variables | Optimal DD | Sub-optimal DD | Crude Odds Ratio (COR)(95% CI) | AOR (95% CI) | |
|---|---|---|---|---|---|
| Availability of media sources | Yes | 39 | 116 | 3.22(2.04–5.08)*** | 2.77(1.64–4.68)*** |
| No | 55 | 526 | 1 | 1 | |
| Cow milk available at house | Yes | 22 | 76 | 2.28(1.33–3.88)*** | 2.38(1.31–4.35)*** |
| No | 72 | 566 | 1 | 1 | |
| Mother involvement in decision making | Yes | 82 | 522 | 1.57(0.83–2.97) | 2.07(1.02–4.20)* |
| No | 12 | 120 | 1 | 1 | |
| Place of delivery | Health institution | 75 | 321 | 4.59(2.58–8.18)*** | 2.40(1.24–4.67)** |
| Health post | 4 | 26 | 3.03(.94–9.78) | 1.90(0.52–6.95) | |
| Home | 15 | 295 | 1 | 1 | |
| Mode of delivery | Assisted delivery | 15 | 28 | 4.16(2.16–8.13)*** | 2.36(1.12–4.98)* |
| SVD | 79 | 614 | 1 | 1 | |
| PNC follow up | Yes | 70 | 270 | 4.02(2.46–6.55)*** | 2.07(1.18–3.62)** |
| No | 24 | 372 | 1 | 1 | |
| Knowledge of when to start CF | Yes | 92 | 587 | 4.31(1.03–17.97) | 3.07(0.67–14.00) |
| No | 2 | 55 | 1 | 1 | |
| Time to reach nearby health centers | ≥2 h | 21 | 74 | 2.21(1.28–3.79)*** | 3.11(1.66–5.83)*** |
| < 2 h | 73 | 568 | 1 | 1 | |
| Meal frequencies of child | ≥4 times/day | 50 | 226 | 3.43(1.69–6.97)*** | 3.31(1.53–7.18)** |
| 3 times/day | 34 | 261 | 2.02(0.97–4.20) | 2.00(0.91–4.41) | |
| 1-2times/day | 10 | 155 | 1 | 1 | |
Significant at *p-value < 0.05, **p-value < 0.01, and ***p-value < 0.001
Discussion
This study assessed the factors associated with dietary diversity for children aged 6–23 months in Sinan Woreda. It identified that only 12.8% of the children received four or more food groups with in the 24 h preceding the survey. It is consistent with the findings from the studies done in Dangila 12.6% [28] and Tigiray 17.8% [30] districts of Ethiopia, India 13% [19] and Uganda 17.8% [31]. However, the finding is higher than the EDHS 2011 report [15] and lower than the studies done in India 27.4%, Tobago 48.23%, Cambodia 44%, Kenya 39.2%, 27.7%, Kamba district of Ethiopia 23.3% [22, 26, 29, 31–33]. The difference might occur due to time of study, socio-economic difference and geographical variation. The possible reasons for low dietary diversity practices in the study area could be low practice giving complimentary feeds after six months and the habit of the family (i.e. Preparing the family food together, no food preparation for children alone). Also low affordability of foods that is not available at home and those foods that are coasty are sold from the house instead of feeding their child. In addition, due to low feeding practices, animal source foods commonly used during holidays and ceremony other than usual.
The dominant food groups given to the children were grains, tubers and roots (98.8%) and legume (83.2%).This is comparable with the results from the studies done in Ethiopia [26, 28], and South Africa [34]. Feeding of flesh, egg, dairy products, vitamin rich fruits and vegetables and other fruits was low. This was in line with the studies done in Ethiopia [16, 26, 28], Central America [34], and Kenya [20]. The possible reason might be due to the unavailability of these food sources at household level; in which cereals, grains and tubers are the commonest products in the study area. People commonly consume those food items they cultivated and accessed from the market in low cost [35, 36].
The likelihood of feeding children with optimum dietary diversity was more among mothers who had media sources like radio and television (TV). Similar findings have been reported by the previous studies done in Northwest Ethiopia [28] and India [19]. We can understand from this result that availability of media sources at household might help the mothers getting information on recommended child feeding options [36].
Mothers who had available cow’s milk at household level were more likely to feed diversified food group than those who had not. Presence of accessible animal source foods at households helped women to feed their children with dairy products [36]. Similar result has been reported by the study conducted in southern Ethiopia Kemba district [26]. The possible reason might be the household that have cow’s milk, feed their child milk and milk products in addition to usual diet. Those mothers who were participating in decision making at household were more likely practicing optimal dietary diversity feeding to their children. The study done in Northwest part of Ethiopia had also revealed that feeding of optimum dietary diversity to their children is more among mothers who had involved in household decision making [28].
Among health utilization factors, those women who delivered their last child at health institutions were more likely to feed their children with diversified food. Similarly, those mothers who received postnatal care were more likely to feed their children with diversified food. This was in line with the study done in southern Ethiopia that showed the odds of feeding of diversified food was higher among mothers who received institutional delivery and postnatal follow up [26]. A study done in East African Regions [14] also revealed those hospital-based births shown to have a positive relationship with complementary food diversity. Health professionals might provide health education and counseling on dietary diversity when they deliver at health institutions and during postnatal care follow up visits [37]. Those who delivered their last child with assisted mode of delivery were more likely to feed diversified diet to their child than those who had spontaneous vaginal delivery. Mothers who gave birth through assisted mode of delivery might have prolonged stay at health institutions and get the opportunity to receive health education on infant and child feeding by senior providers [37].
Surprisingly, mothers residing relatively far from the health centers had higher odds of feeding their child with diversified diet. The possible reason might be due to frequent visit by health extension workers (HEWs). In rural Ethiopia, HEWs are working at health posts relatively far to health centers but closest to the community. They are responsible to provide health care services summarized into 16 packages at household level in the community [38, 39]. In addition, currently most of the child health activities are carried out at health post in Ethiopia. Children, whose meal frequency was four and more times per day, had higher odds of dietary diversity, This finding was in line with the study conducted in East African regions [14].
Conclusion
Optimum dietary diversity among children aged 6–23 months in Sinan Woreda is low. Availability of media sources, availability of cow’s milk in the household, delivered at health institutions, assisted delivery, postnatal care, relatively far distance to reach to nearby health centers and feeding frequency four and above times/day was significant factors associated with optimal dietary diversity feeding of children aged 6–23 months. Infant and young child feeding practice according to the guideline should be implemented at community level and Mothers should be educated about how to prepare the diversified diet from locale available food groups for complimentary after 6 months. This study concluded that women involvement at household decision making improves dietary diversity of children. Ensuring maternal health service utilization can contribute for better dietary diversity of children aged 6–23 months. The government should strengthen the maternal health service utilization by expanding institutional delivery service, PNC service and counseling on child feeding. Information and advertising about IYCF are disseminated to grass-root level. Large scale an interventional based research has to be conducted.
Acknowledgments
We thank Debre Markos University college of Health science for providing ethical clearance, data collectors, supervisor and study participants for their willingness to participate in the study.
Funding
No funding was obtained for this study.
Availability of data and materials
The datasets used and/or analyzed during the current study are available from the corresponding author. The data will not be shared in order to preserve participant anonymity.
Abbreviations
- ANC
Ante Natal Care
- AOR
Adjusted Odds Ratio
- CF
Complementary Feeding
- CHIS
Community Health Information System
- COR
Crude Odds Ratio
- DDS
Dietary Diversity Score
- EDHS
Ethiopian Demographic Health Survey
- HEWs
Health Extension Workers
- IYCF
Infant and Young Child Feeding
- PNC
Post Natal Care
- SDG
Sustainable Development Goals
- WHO
World health organization
Authors’ contributions
Conceptualization: HT. Formal analysis: HT, TY, MT. Development or design of methodology: HT, TY, MT. Entering data into computer software: HT, MT, TY. Supervision: HT, TY, MT. Validation: TY, MT. writing original draft: HT, TY, MT. Writing review and editing: HT, TY, MT. All authors read and approved the final manuscript.
Ethics approval and consent to participate
We obtained ethical clearance from the Ethical review committee of College of Health Sciences of Debre Markos University. Verbal informed consent, which was prepared in written form and dictated to the respondents during data collection, was obtained from the study participants after explaining the purpose of the study and the benefits. We preferred verbal consent as the majority of the respondents were unable to read and write. Ethical review committee has approved this consent. Respondents were interviewed voluntarily, anonymously and confidentiality also was assured.
Consent for publication
Not applicable.
Competing interests
The authors declare that they have no competing interests.
Publisher’s Note
Springer Nature remains neutral with regard to jurisdictional claims in published maps and institutional affiliations.
Contributor Information
Habtamu Temesgen, Email: habtamutem@gmail.com.
Tebikew Yeneabat, Email: wait4myfather@gmail.com.
Muluken Teshome, Email: mulukenteshome@gmail.com.
References
- 1.WHO | Children: reducing mortality [Internet]. WHO. [cited 2016 Jul 8]. Available from: http://www.who.int/mediacentre/factsheets/fs178/en/.
- 2.WHO. Infant and young child feeding, WHO, 2015 fact sheet 342.
- 3.Infant and young child feeding. WHO, 2015, 342.
- 4.Biesalski K. Bread and Brain, Education and Poverty. 2014. Hidden hunger consequences for brain development. [Google Scholar]
- 5.Infant and Young Child Feeding Practices . CARE: Cooperative for Assistance and Relief Everywhere. 2010. Collecting and Using Data: a Systematic Guide. [Google Scholar]
- 6.Ickowitz A, Powell B, Mohammad A, Terry CH. Dietary quality and tree cover in Africa. Glob Environ Chang. 2014;24:287–294. doi: 10.1016/j.gloenvcha.2013.12.001. [DOI] [Google Scholar]
- 7.WHO/UNICEF . Global strategy for infant and young child feeding. Geneva: WHO/UNICEF; 2005. [Google Scholar]
- 8.Sustainable Development Goals (SDGs). UNDP. [cited 2016 Jul 8]. Available from: http://www.undp.org/content/undp/en/home/sdgoverview/post-2015-development-agenda.html
- 9.United Nations System Standing Committee On Nutrition (UNSCN). Nutrition and the Post-2015 Sustainable Development Goals: A technical note. 2014; Available from: www.unscn.org
- 10.FAO . Nutrition and Consumer Protection Division. 2011. Guidelines for Measuring Household and Individual Dietary Diversity. [Google Scholar]
- 11.Aemro M, Mesele M, Birhanu Z, Atenafu A. Dietary diversity and meal frequency practices among infant and young children aged 6-23 months in Ethiopia: a secondary analysis of Ethiopian demographic and health survey 2011. J Nutr Metab. 2013;2013:782931. doi: 10.1155/2013/782931. [DOI] [PMC free article] [PubMed] [Google Scholar]
- 12.Kennedy GL, Pedro MR, Seghieri C, Nantel G, Brouwer I. Dietary diversity score is a useful indicator of micronutrient intake in non-breast-feeding Filipino children. Community Int Nutr. 2007;137:472–477. doi: 10.1093/jn/137.2.472. [DOI] [PubMed] [Google Scholar]
- 13.WHO/UNICEF. Indicators for assessing infant and young child feeding practices Part 2 Measurement. Geneva: WHO/UNICEF; 2010.
- 14.Gewa C, Leslie T. Young child complementary food diversity in the east African region: cross-country differences, geographic distribution and relationship with health-care utilization. FASEB J. 2013;27(1 Supplement):844.11–844.11. [Google Scholar]
- 15.2011 Ethiopia Demographic and Health Survey . Key findings. Calverton: Ethiopia Central Statistical Agency and ICF International; 2012. [Google Scholar]
- 16.Wolde T, Adeba E, Sufa A. Prevalence of Chronic Malnutrition (Stunting) and Determinant Factors among Children Aged 0–23 Months in Western Ethiopia. J Nutr Disorders. 2014;4:148. [Google Scholar]
- 17.Rah J, Akhter N, Semba R, Pee S, Bloem M, Campbell A, et al. Low dietary diversity is a predictor of child stunting in rural Bangladesh. Eur J Clin Nutr. 2010;64:1393–1398. doi: 10.1038/ejcn.2010.171. [DOI] [PubMed] [Google Scholar]
- 18.Lohia N, Udipi SA. Infant and Child feeding index reflects feeding practices, nutritional status of urban slum children Mumbai, India. BMC Pediatr. 2014;14:290. doi: 10.1186/s12887-014-0290-7. [DOI] [PMC free article] [PubMed] [Google Scholar]
- 19.Peter R, Kumar KA. Mothers’ caregiving resources and practices for children under 5 years in the slums of Hyderabad, India: a cross-sectional study. WHO South East Asia J Public Health. 2014;3:3–4. doi: 10.4103/2224-3151.206748. [DOI] [PubMed] [Google Scholar]
- 20.Schofield L. Report of baseline urban nutrition assessment in the slums of Nairobi east and north districts, Nairobi Kenya. 2009.
- 21.Moursi MM, Arimond M, Dewey KG, Trèche S, Ruel MT, Delpeuch F. Dietary diversity is a good predictor of the micronutrient density of the diet of 6- to 23-month-old children in Madagascar. J Nutr. 2008;138(12):2448–2453. doi: 10.3945/jn.108.093971. [DOI] [PubMed] [Google Scholar]
- 22.Bukania ZN, Mwangi M, Karanja RM, Mutisya R, Kombe Y, Kaduka LU, et al. Food Insecurity and Not Dietary Diversity Is a Predictor of Nutrition Status in Children within Semiarid Agro-Ecological Zones in Eastern Kenya [Internet]. J Nutr Metab. 2014 [cited 2018 Feb 10]. Available from: https://www.hindawi.com/journals/jnme/2014/907153/. [DOI] [PMC free article] [PubMed]
- 23.Nguyen PH, Avula R, Ruel MT, Saha KK, Ali D, Tran LM, et al. Maternal and child dietary diversity are associated in Bangladesh, Vietnam, and Ethiopia. J Nutr Commun Int Nutr. 2013;143:1176–1183. doi: 10.3945/jn.112.172247. [DOI] [PubMed] [Google Scholar]
- 24.Hirvonen K, HJ . Agricultural production and children’s diets: Evidence from rural Ethiopia. Washington: International food policy research institute and Ethiopian development research institute; 2015. [Google Scholar]
- 25.Arimond M, Ruel M. Dietary diversity is associated with child nutritional status: evidence from 11 demographic and health surveys. Nutrition. 2004;134(10):2579–2585. doi: 10.1093/jn/134.10.2579. [DOI] [PubMed] [Google Scholar]
- 26.Gatahun EA, Abyu DM. Dietary Diversity Feeding Practice and Determinants among Children Aged 6-23 Months in Kemba Woreda, Southern Ethiopia Implication for Public Health Intervention. J Nutr Food Sci. 2015;19:1–10.
- 27.Daniel WW. Biostatistics: a Foundation for Analysis in the health sciences. 7. New York: John Wiley and Sons; 1999. [Google Scholar]
- 28.Beyene M, Worku AG, Wassie MM. Dietary diversity, meal frequency and associated factors among infant and young children in Northwest Ethiopia: a cross- sectional study. BMC Public Health. 2015;15:1007. [DOI] [PMC free article] [PubMed]
- 29.Potts S, Potts A. An Assessment of dietary diversity and nutritional status of preschool children. Austin J Nutri Food Sci. 2014;2(7):1040. [Google Scholar]
- 30.Mekbib E, Shumey A, Ferede S, Haile F. Magnitude and Factors associated with appropriate complementary feeding among mothers having children 6-23 months-of-age in northern Ethiopia. A community. J Food Nutr Sci. 2014;2(2):36–42. [Google Scholar]
- 31.DHO-ACF/UNICEF. nutrition surveillance report, Karamoja region, Uganda. 2012.
- 32.Kar S, Bhattacharjee S, Samantaray P, Biswal S. Infant and young child feeding practices among marginalized populations of Odisha, state in India. J Epidemiol Res. 2015;2(1)
- 33.Reinbott A, Kuchenbecker J, Herrmann J, Jordan I, Muehlhoff E, Kevanna O, et al. A child feeding index is superior to WHO IYCF indicators in explaining length-for-age Z-scores of young children in rural Cambodia. Paediatr Int Child Health. 2015;35(2):124–34. [DOI] [PMC free article] [PubMed]
- 34.Steyn NP, Nel JH, Nantel G, Kennedy G, Labadarios D. Food Variety and dietary diversity scores in children: are they good indicators of dietary adequacy? Public Health Nutr. 2006;9(5):644–650. doi: 10.1079/PHN2005912. [DOI] [PubMed] [Google Scholar]
- 35.CSA. WFP . Comprehensive Food Security and Vulnerability Analysis (CFSVA) Ethiopia: CSA WFP; 2014. [Google Scholar]
- 36.Tessema M, Belachew T, Ersino G. Feeding patterns and stunting during early childhood in rural communities of Sidama, South Ethiopia. Pan Afr Med J. 2013;14:75. doi: 10.11604/pamj.2013.14.75.1630. [DOI] [PMC free article] [PubMed] [Google Scholar]
- 37.Manikyamba D, Vidya DL, Satyavani A, Prasad AK, Deepthi KT. Impact of nutritional education on the knowledge of mothers regarding infant and young child feeding practices. Sch J Appl Med Sci. 2015;3(3A):1074–1078. [Google Scholar]
- 38.Medhanyie A, Spigt M, Kifle Y, Schaay N, Sanders D, Blanco R, et al. The role of health extension workers in improving utilization of maternal health services in rural areas in Ethiopia: a cross sectional study. BMC Health Serv Res. 2012;12:352. doi: 10.1186/1472-6963-12-352. [DOI] [PMC free article] [PubMed] [Google Scholar]
- 39.Banteyerga H. Ethiopia’s health extension program: improving health through community involvement. MEDICC Rev. 2011;13(3):46–49. doi: 10.1590/S1555-79602011000300011. [DOI] [PubMed] [Google Scholar]
Associated Data
This section collects any data citations, data availability statements, or supplementary materials included in this article.
Data Availability Statement
The datasets used and/or analyzed during the current study are available from the corresponding author. The data will not be shared in order to preserve participant anonymity.